Thomas Kienbacher, MD1, Birgit Paul, PhD1, Richard Habenicht1, Christian Starek, BSc1,4, Markus Wolf, BSc1,4, Josef Kollmitzer, PhD1,3,4 and Gerold Ebenbichler, MD1,2
From the 1Karl Landsteiner Institute for Outpatient Rehabilitation Research, 2Department of Physical Medicine & Rehabilitation, Vienna Medical University, General Hospital of Vienna, 3TGM - School of Technology and 4University of Applied Sciences, Biomedical Engineering, Vienna, Austria
OBJECTIVE: To determine the short- and long-term test-retest reliability of maximum isometric trunk moment measurements in healthy volunteers over 50 years of age, to compare these results with those from volunteers younger than 50 years, and to test whether volunteers’ anticipatory emotional state affects the precision of these measurements.
METHODS: Forty-two older persons (21 females; age range 50–90 years) and 44 younger persons (19 females; age range 18–49 years) performed maximum isometric trunk extensions, flexions, and rotations using dynamometers (DAVID®, David Health Solutions, Helsinki, Finland). They repeated the tests after 1–2 days (short-term) and at 6 weeks (long-term). Retest-reliability was evaluated for age- and gender-specific subgroups, with assessment of intraclass correlation coefficient (ICC2,1) , standard error of measurement, smallest real difference, and smallest real difference, in percent.
RESULTS: For the elderly group, smallest real difference, in percent values varied up to 33% and were similar to those obtained from young volunteers. Precision of the trunk rotation tests was lower than that of trunk flexion or extension. Retest agreement exceeded 0.75 (ICC2,1) for all tests, with no relevant differences observed between gender- and age-specific subgroups. Neither participants’ motivation nor their anticipatory emotions correlated with the individual coefficients of variation of the trunk muscle moment measurements.
CONCLUSION: Isometric maximum trunk extension and flexion moment measurements taken from healthy persons > 50 years old are as reliable as those from persons < 50 years old, and can be expected to enable an acceptable level of detection of expected changes in muscle strength parameters as a result of planned exercise interventions.
Key words: reproducibility; trunk stabilizing muscles; emotions; motivation; elderly; strength.
J Rehabil Med 2014; 46: 00–00
Correspondence address: Gerold Ebenbichler, Department of Physical Medicine & Rehabilitation, Vienna Medical University, General Hospital of Vienna, Währinger Gürtel 18-20, AT-1090 Vienna, Austria. E-mail: Gerold.Ebenbichler@meduniwien.ac.at
Accepted Sep 18, 2013; Epub ahead of print Jan 28, 2014
Introduction
The force-generating capacity of the trunk-stabilizing muscles is an important aspect in the assessment of an individual’s health status (1, 2). This is especially true in an ageing population whose muscular force-generating capabilities are known to decrease (3). In particular, back muscle weakness may reduce a person’s ability to protect the spinal segments, thereby predisposing the facet joints and intervertebral discs to greater mechanical stress and structural damage (2). Moreover, age-related functional changes toward a forward-leaning posture in elderly persons require increased muscle strength and energy demands of trunk extensors when maintaining an upright posture (4, 5). Trunk muscle weakness has been reported to correlate with pain syndromes of the back (6, 7) and with diseases of the vertebral column, such as osteoporosis or degenerative spine diseases (8–10). Furthermore impaired trunk muscle strength is a likely precursor of osteoporosis of the spine and related disability in older adults (8, 10, 11). Thus, trunk muscle strength testing has been advocated as an important tool within the prevention- and rehabilitation-related assessment of both patients with spine conditions (12) and elderly persons who are limited in their mobility (11).
Static evaluation appears suitable and safe for strength assessment of impaired back muscles in elderly persons. Whereas several studies have provided normative trunk muscle strength values for both young and elderly adults (13–15), other studies have investigated the reliability of isometric trunk muscle strength measures in healthy adults (9, 14, 16–21). These studies employed different test devices to assess back muscle strength test-retest reproducibility in either a prone (9), standing (14, 17, 22), or sitting position (16, 19, 20). The majority of authors behind these studies have suggested good-to-excellent reliability for these measures. Such optimistic conclusions as provided by some of the authors may be premature due to an incomplete assessment of reliability that ignored relevant aspects necessary for a clinically valuable interpretation of test reliability (14, 17). Moreover, we are not aware of any test-retest reliability study that has examined the DAVID® trunk dynamometers (David Health Solutions Ltd, Helsinki, Finland) in healthy volunteers or has recruited persons over 55 years of age.
Reliability of trunk muscle strength measurements from elderly adults could differ from those of younger individuals due to lower values and a reduced day-to-day consistency of measurements, since elderly persons, even if healthy, may be more vulnerable to day-to-day fluctuations in physical and mental state; a person’s anticipatory emotions and motivation may change from test to retest, which probably affects the stability of repeated maximum performance measurements (23).
This research for the first time sought (i) to investigate the reliability of isometric trunk muscle strength measures in healthy persons over 50 years, (ii) to compare findings from older adults with those of younger patients, and (iii) to test whether participants’ anticipatory emotions and motivation correlate with the precision of the maximum isometric trunk muscle measures.
Methods
Participants
A total of 86 asymptomatic male and female volunteers comprised of hospital staff, personal contacts, and community volunteers between 18 and 90 years of age were enrolled into the study. Of these, 44 participants (19 women) were between 18 and 49 years, and another 42 (21 women) were 50–90 years old (Table I). Volunteers were recruited through personal contacts of the examiners, advertising presentations in leisure-time institutions for elderly people, and companies in the area close to the Karl-Landsteiner Institute of Research. Physicians specialized in physical medicine and rehabilitation screened all volunteers. Volunteers were eligible for the study if they were: (i) free of pain, with a maximum of 5 mild episodes of back pain, and/or referring pain to the head, arms, or legs within the past year; (ii) demonstrated normal range of motion of all major joints; (iii) did not seek healthcare advice for back pain within the last year; (iv) had no major general health problems that would interfere with testing; (v) were free from any functional limitations; and (vi) exhibited normal physical activity levels while not performing sports on a competitive level and not performing sports more often than 2 times per week.
|
Table I. Characteristics of participants |
|||||
|
Characteristics |
Test 1 Mean (SD) |
Test 2 Mean (SD) |
Test 3 Mean (SD) |
||
|
Age, years |
|
||||
|
18–49 year-old men |
34.20 (9.34) |
|
|||
|
18–49 year-old women |
32.87 (11.09) |
|
|||
|
50–90 year-old men |
67.24 (11.15) |
|
|||
|
50–90 year-old women |
67.24 (9.99) |
|
|||
|
Height, cm |
|||||
|
18–49 year-old men |
179.52 (5.94) |
|
|||
|
18–49 year-old women |
166.06 (4.84) |
|
|||
|
50–90 year-old men |
179.00 (6.44) |
|
|||
|
50–90 year-old women |
161.05 (5.43) |
|
|||
|
Weight, kg |
|||||
|
18–49 year-old men |
78.37 (10.50) |
|
|||
|
18–49 year-old women |
64.18 (8.15) |
|
|||
|
50–90 year-old men |
84.70 (9.67) |
|
|||
|
50–90 year-old women |
62.67 (7.82) |
|
|||
|
BMI |
|||||
|
18–49 year-old men |
24.31 (3.07) |
|
|||
|
18–49 year-old women |
23.30 (2.99) |
|
|||
|
50–90 year-old men |
26.37 (2.01) |
|
|||
|
50–90 year-old women |
24.18 (2.94) |
|
|||
|
Positive emotions |
|
||||
|
18–49 year-old men |
5.30 (1.84) |
5.38 (2.46) |
5.11 (2.12) |
||
|
18–49 year-old women |
5.00 (1.80) |
4.72 (1.91) |
4.85 (2.24) |
||
|
50–90 year-old men |
5.17 (2.14) |
5.62 (2.21) |
5.75 (2.63) |
||
|
50–90 year-old women |
5.02 (1.58) |
4.38 (1.30) |
4.32 (1.61) |
||
|
Negative emotions |
|||||
|
18–49 year-old men |
0.76 (0.88) |
0.66 (0.82) |
0.69 (0.84) |
||
|
18–49 year-old women |
0.57 (0.77) |
0.75 (1.18) |
0.61 (1.20) |
||
|
50–90 year-old men |
0.62 (1.07) |
0.60 (1.01) |
0.38 (0.78) |
||
|
50–90 year-old women |
0.31 (0.46) |
0.23 (0.37) |
0.24 (0.29) |
||
|
Motivation |
|||||
|
18–49 year-old men |
6.33 (2.07) |
6.23 (2.18) |
6.32 (2.13) |
||
|
18–49 year-old women |
5.43 (2.20) |
5.44 (2.20) |
5.06 (2.20) |
||
|
50–90 year-old men |
5.64 (1.71) |
5.83 (1.67) |
6.05 (2.15) |
||
|
50–90 year-old women |
5.46 (1.31) |
5.83 (1.95) |
5.40 (1.86) |
||
|
Interval between tests, days |
|||||
|
18–49 year-old men |
|
1.81 (1.60) |
44.90 (9.72) |
||
|
18–49 year-old women |
|
1.22 (0.43) |
41.34 (9.08) |
||
|
50–90 year-old men |
|
2.14 (2.73) |
46.72 (27.18) |
||
|
50–90 year-old women |
|
2.35 (3.12) |
42.11 (12.01) |
||
|
The values given for each of the categories, “positive emotions”, “negative emotions”, and “motivation”, represent mean scores rated on Borg scales. Each Borg scale had a range of 0 to 10. BMI: body mass index; SD: standard deviation. |
|||||
Exclusion criteria were: (i) one or more medical visits or sick leave for back pain within the last year or on-going disability pension application/investigation; (ii) inability to follow instructions provided in German; (iii) more than 5 mild back or referring back pain episodes (visual analogue scale > 30) lasting more than 2 days each within the past year; (iv) a history of spine surgery or any kind of specific spine disease; (v) clinical findings indicative of neuropathological conditions or structural impairments; (vi) pregnancy; (vii) any medical condition that might interfere with maximum strength testing; or (viii) body mass index (BMI) exceeding 35 kg/m².
The study protocol was acknowledged by the ethics’ committee of the city of Vienna. Before inclusion, all participants received oral and written information about the study and gave informed consent. Data collection was carried out in accordance with the directives given in the Declaration of Helsinki. Participants received a financial compensation fee after completion of each experimental day.
Instrumentation
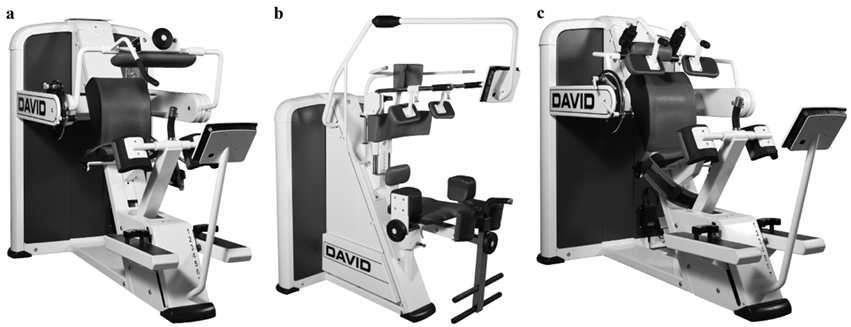
Dynamometers. Isometric trunk muscle moment was collected using specially designed measuring and training units that tested trunk extension (F110 extension; DAVID®, Fi), trunk flexion (F130 flexion; DAVID®, Fi) and axial right- and left-sided trunk rotation (F120 rotation; DAVID®, Fi). The devices are shown in Figs 1a–c. The back extension device consists of a mechanism intended to immobilize the lower body, which is comprised of 5 components: footplates adjustable to lower leg length, knee pads adjustable to thigh length, a pelvic belt, a seat adjustable for height, and a dorsal back pad. The flexion device is equipped with the same hip fixation mechanism and additional shoulder pads. The rotation device is comprised of 4 adjustable components: knee pads, thigh belt, a dorsal pelvis pad, and shoulder pads. Persons were seated on the isometric machines according to the manufacturer’s recommendations. For back extension, the trunk was flexed 30º from the upright sitting position, which corresponded to 0º trunk flexion. For trunk right-left rotation tests, the lower body was laterally rotated 30º. Seat height and all positioning variables were adjusted in accordance with the manufacturer’s recommendations. DAVID® devices measure the effort produced in Nm and do not correct for gravitational forces of the upper body mass. The EVE monitor (evaluated Exercise, David® Health Solutions, Helsinki, Finland) placed in front of the participants provides a visible real-time display of the force curve and permits detection of abnormal peak values. The EVE terminal software selects the highest 1/20 s peak value and presents it on the screen. All data are automatically and wirelessly transferred to a central server.
Fig. 1. Pictures of the David test devices used for assessing maximum isometric trunk extension, flexion and rotation moments. (a) Trunk extension (F110 extension; DAVID®, Fi), (b) axial right- and left-sided trunk rotation (F120 rotation; DAVID®, Fi), and (c) trunk flexion (F130 flexion; DAVID®, Fi).
Participants’ anticipatory emotion and motivation, and assessment of their activity level. Ratings of participants’ anticipatory positive and negative emotions were derived from the Avoidance Endurance Questionnaire (24), and their motivation was assessed as previously published (25) based on factor analyses (data not shown). Shortly before the maximum tests were performed, volunteers were asked to imagine the situation of the maximum trunk muscle moment tests and to rate their respective expectations with Borg Category Ratio scales (26). Each rating on the respective Borg scale ranged from 0 (nothing at all) to 10 (extremely strong). These scales have demonstrated excellent reliability (26). Volunteers further completed the International Physical Activity Questionnaire (IPAQ) to evaluate whether they maintained their usual intensity and frequency of activity over the 6 weeks between evaluations 1 and 3 (27).
Procedures
Data were collected between June 2011 and March 2012. Each person was evaluated 3 times with the first 2 evaluations (days 1 and 2) separated by 1–2 days, and the third 1 (day 3) after an interval of approximately 6 weeks. A 6-weeks interval is considered as the minimum duration of a therapeutic exercise intervention to demonstrate a clear improvement of strength (28, 29). All muscle torque tests were performed by 3 experienced examiners (CS, MW, RH) and conducted at the same time of day to reduce effects of diurnal variation. For 50% of volunteers, the same examiner performed the first 2 evaluations to determine intra-rater reliability. The completion of the Borg scales and the IPAQ was supervised by a certified clinical psychologist (BP). Volunteers were asked to maintain their physical activity level during the 6 weeks of the study.
Isometric trunk muscle testing. Participants performed at least 3 slow, sub-maximum dynamic warm-up trials throughout the full range of trunk motion at low loads and practiced 1 or 2 isometric test contractions at submaximum loads using visual feedback by the EVE monitor. Thereafter, volunteers generated their maximum isometric contraction by gradually increasing their torque moment up to their maximum within the first 2–3 s of each contraction. The entire strength evaluation was performed under supervision of the examiner. The best value obtained out of 2 attempts was stored. If these 2 tests varied by more than 10%, or if the peak moment was achieved later than 3 s after the onset of the contraction, than further trials were permitted until a consistent maximum was achieved. Intervals between maximum test repetitions were a minimum of 15 s. The different maximum isometric tests were separated by 5 min. Verbal instructions and encouragement were standardized according to the recommendations of a clinical psychologist (BP). The order of different muscle group tests was kept constant, with back extension tests first, followed by trunk flexion tests, and finally right-left rotation tests.
Analysis
Outcome variables. The primary end-points were the maximum moments, measured in Nm, derived from the 3 maximum isometric trunk muscle tests. The highest peak-torque value from each test was included in the statistical analysis. For the trunk rotation test, the mean of the best right- and best left-rotation performances was calculated. Secondary outcome measures were the mean rating scores of participants’ anticipatory feelings and emotions, and the score from the IPAQ.
Statistics
All statistical analyses were performed using software package R® (30). All statistical procedures that tested reliability of the maximum torque measurements followed previously published recommendations (31, 32). Examination of the difference scores from the 2 age-specific subgroups (with the data from males and females pooled) revealed a clear heteroscedastic behaviour, and males demonstrated significantly higher trunk muscle moment scores than females (see Tables II and III) for all tests at any time-point. As such, all reliability analyses were conducted separately per gender.
Appropriate reproducibility indices were compiled using data inspection procedures as previously suggested (33). In agreement with current recommendations the following aspects were explored (31, 32): (i) systematic bias by calculating the mean differences and accompanying 95% confidence intervals (95% CI) for days 1 and 2 and for days 1 and 3; (ii) the precision of measurements by calculating the standard error of measurements (SEM) via the limits of agreement method (LOA), which is algebraically similar to the smallest real difference (SRD) (34), by the smallest real difference % (SRD%) (34), and by Bland-Altman analysis (32, 35); (iii) relative reproducibility using the intraclass correlation coefficient (ICC2,1), which was chosen for generalization purposes and revealed similar results when our sample was compared with an ICC model (ICC3,1) (32). Testing of intra-rater reliability was carried out using the ICC1,1.
Multiple correlation analyses determined whether or not participants’ emotions and motivation, as well as the respective changes, were related to the precision of their trunk moment measurements. Pearson correlation coefficients were Bonferroni corrected for 3 comparisons (p < 0.02). Thus, the first set correlated the baseline scores “motivation”, “positive emotions”, and “negative emotions” with each individual’s coefficient of variation calculated from both the short- and the long-term retests of the trunk moment measurements. The second set correlated the individual differences of the short- and long-term changes in motivation and participants’ emotions with the respective coefficients of variation of the trunk moment measurements.
Results
A total of 83 out of 86 participants completed all tests; 2 volunteers (1 young male and 1 young female) were disabled in motor vehicle accidents and 1 further volunteer (1 old male) refused re-evaluation. We further excluded 3 persons (1 young female and 1 young male; 1 old male), whose retest values were 4 standard deviations (SDs) of the mean difference less than their baseline values, in 2 of these cases because of moderate back pain. Measurements were repeated after a mean of 1.9 days (SD 2) and 43.9 days(SD 16.4) . The characteristics of the volunteers are presented in Table I. Volunteers’ International Physical Activity Questionnaire ratings remained unchanged over the 3 evaluations.
Reliability of peak moment measurements in subjects over 50 years old
Absolute reliability. Mean peak moment back extension, flexion, and rotation scores were significantly higher in male than in female volunteers on all test days. Their respective changes from the first to the second test day were highest for back extension and lowest for lumbar flexion in men; or lowest for trunk rotation in women and highest for thoracic flexion in men if the longitudinal changes between the first and third test day were examined. The accompanying 95% CIs overlapped zero in all cases. Visual inspection of all Bland Altman graphs revealed uniform variability across mean performance for the majority of the different trunk muscle tests within each test group. Only in a few examples (Fig. 2) greater differences in mean back extension moment were observed for male persons with higher maximum moment values than for those with lower values. Measurement error was generally higher for men than for women. The respective SEM values were highest for lumbar extension and lowest for trunk flexion tests, and were similar when measurements were repeated after 2 days or 6 weeks. LOAs were higher for men than for women and were highest when men’s back extension was retested after 6 weeks or lowest when women’s trunk flexion was reassessed after 2 days or 6 weeks. The respective SRD% values were highest for trunk rotation and lowest for trunk flexion when participants were retested either in the short- or long-term. All results are presented in Tables II and III.
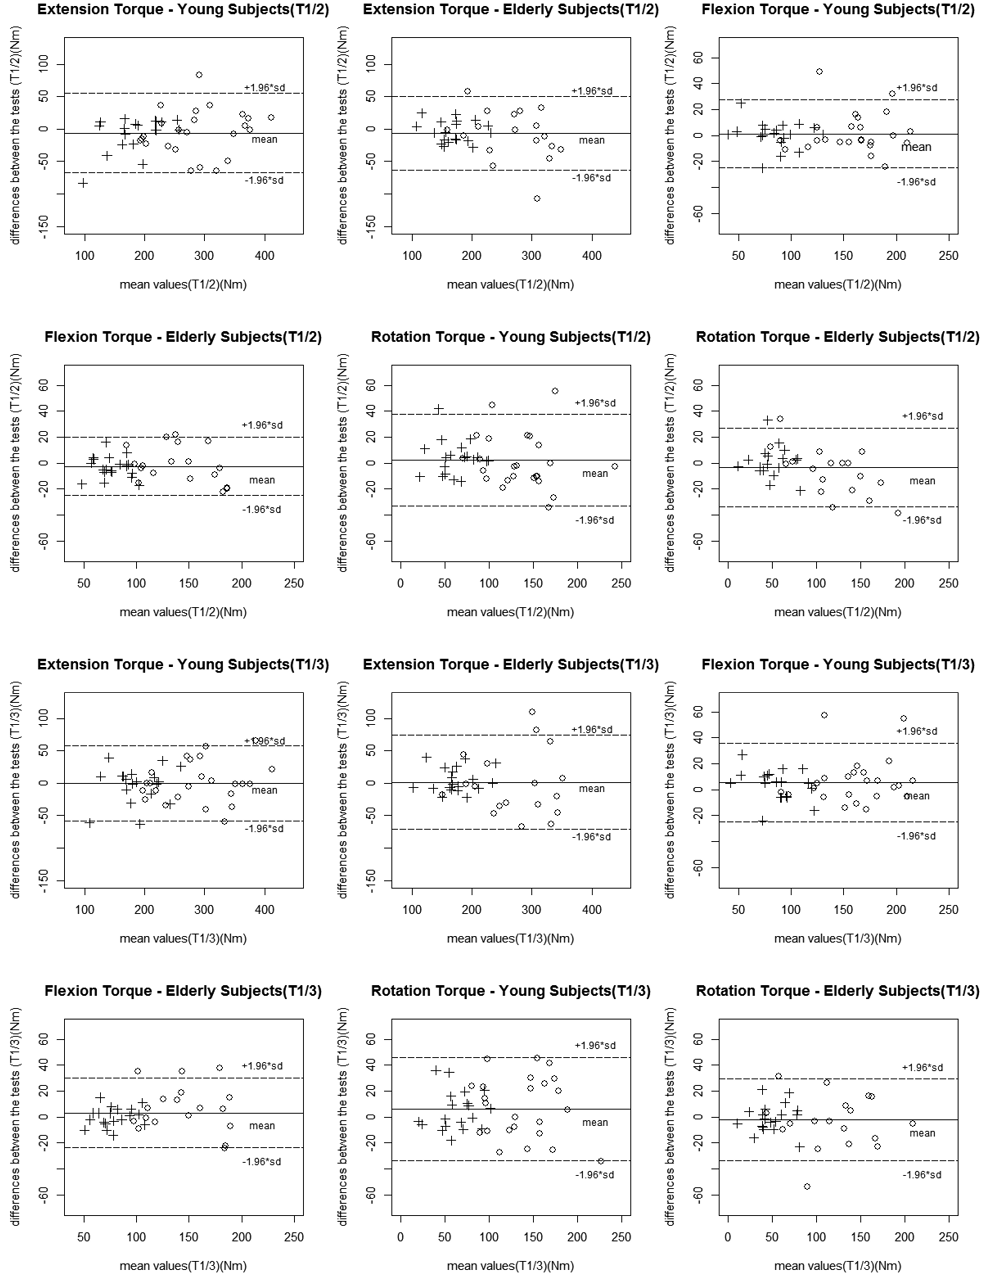
Fig. 2. Differences between the first (T1) and second (T2) test sessions, and the first and third (T3) test sessions, plotted against the respective 2 session mean for peak torque values of all 3 examinations (trunk extension, flexion and right-left rotation) for the age-specific subgroups (> 50 years of age and < 50 years of age). Note: the mean represents the bias between measurements.
Relative reliability. Intraclass correlation coefficients (ICC2,1) exceeded 0.75 for all tests in both genders (Tables II and III) and were similar to those observed for the interclass correlation coefficients (data not shown).
Reliability of the peak moment measurements in the 18–49-year-old subjects
Absolute reliability. Differences in the mean peak moment scores were found to be highest for back extensions and lowest for trunk rotations in women when retested after 2 days, but were lowest for back extensions and highest for trunk rotations when women were retested after 6 weeks. The 95% CIs overlapped zero in all cases. Visual inspection of Bland Altman graphs revealed heteroscedasticity in 6 out of 24 comparisons, with greater differences in mean back extension moment for high male performers (Fig. 2). SEM values were found to be higher for men than for women when repeated after 2 days or 6 weeks. LOAs were higher for men than for women. The SRD% values of these participants were found to be highest for trunk rotation and lowest for trunk flexion when retested after either 2 days or 6 weeks. All results are presented in Tables II and III.
|
Table II. Summary of isometric peak extension, flexion, and right-left rotation torques on test days 1 and 2 provided for the age- and gender-specific subject groups, including the respective reliability variables standard error of measurement (SEM), limits of agreement method (LOA), intraclass correlation coefficient (ICC) and smallest real difference, in percent (SRD%) |
|||||||||
|
Age/gender |
n |
Test 1 Mean (SD) |
Test 2 Mean (SD) |
Difference |
|||||
|
Mean (95% CI) |
R |
SEM |
SRD |
ICC (95% CI) |
SRD% |
||||
|
Lumbar/thoracic extension torque, Nm |
|||||||||
|
50–90 year-old women |
21 |
173.71 (34.89) |
168.14 (34.10) |
–5.57 (–14.41 to 3.27) |
–0.05 (–0.19) |
13.73 |
± 38.03 |
0.84 (0.65 to 0.93) |
22.27 |
|
50–90 year-old men |
21 |
277.71 (69.99) |
266.86 (63.64) |
–10.86 (–28.19 to 6.47) |
0.14 (–0.01) |
26.92 |
± 74.57 |
0.83 (0.64 to 0.93) |
27.41 |
|
18–49 year-old women |
18 |
186.72 (40.45) |
178.22 (52.51) |
–8.50 (–21.89 to 4.89) |
–0.49 (–0.60) |
19.04 |
± 52.74 |
0.83 (0.61 to 0.93) |
28.92 |
|
18–49 year-old men |
21 |
287.62 (60.81) |
285.19 (63.64) |
–2.43 (–18.26 to 13.41) |
0.02 (–0.15) |
24.60 |
± 68.14 |
0.85 (0.67 to 0.94) |
23.81 |
|
Lumbar/thoracic flexion torque, Nm |
|||||||||
|
50–90 year-old women |
21 |
81.24 (19.24) |
77.67 (18.99) |
–3.57 (–07.30 to 0.15) |
–0.11 (–0.34) |
5.79 |
± 16.03 |
0.90 (0.75 to 0.96) |
20.19 |
|
50–90 year-old men |
21 |
142.76 (35.79) |
143.52 (30.12) |
0.76 (–07.02 to 8.54) |
0.09 (–0.19) |
12.09 |
± 33.49 |
0.87 (0.71 to 0.95) |
23.41 |
|
18–49 year-old women |
18 |
81.89 (22.85) |
82.44 (21.04) |
0.56 (–04.84 to 5.95) |
–0.05 (–0.28) |
7.67 |
± 21.25 |
0.88 (0.72 to 0.95) |
25.88 |
|
18–49 year-old men |
21 |
159.38 (34.38) |
159.52 (37.25) |
0.14 (–05.59 to 5.87) |
0.28 (–0.02) |
8.90 |
± 24.66 |
0.94 (0.86 to 0.98) |
15.48 |
|
Lumbar/thoracic rotation torque mean right/left, Nm |
|||||||||
|
50–90 year-old women |
21 |
50.71 (18.90) |
50.74 (18.17) |
0.02 (–5.24 to 5.29) |
0.20 (–0.17) |
8.18 |
± 22.66 |
0.81 (0.59 to 0.92) |
44.70 |
|
50–90 year-old men |
21 |
122.12 (45.03) |
117.57 (34.43) |
–4.55 (–13.10 to 4.01) |
0.25 (–0.39) |
13.29 |
± 36.82 |
0.89 (0.75 to 0.95) |
30.74 |
|
18–49 year-old women |
18 |
60.08 (23.40) |
64.89 (22.98) |
4.81 (–1.69 to 11.30) |
–0.39 (–0.72) |
9.23 |
± 25.58 |
0.83 (0.61 to 0.93) |
40.96 |
|
18–49 year-old men |
21 |
136.71 (41.33) |
136.69 (39.73) |
–0.02 (–9.74 to 9.69) |
0.13 (–0.13) |
15.09 |
± 41.81 |
0.87 (0.70 to 0.94) |
30.61 |
|
95% CI: 95% confidence interval; R: Pearson product moment correlation between pre-log transformation absolute difference scores and mean of the 2 test sessions (values in parenthesis are correlation coefficients obtained after log transformation); SEM: standard error of measurement; SRD: smallest real difference; ICC: intraclass correlation coefficient; SRD%: smallest real difference, in percent. |
|||||||||
|
Table III. Summary of isometric peak extension, flexion, and right-left rotation torques on test days 1 and 3 provided for the age- and gender-specific subject groups, including the respective reliability variables standard error of measurement (SEM), limits of agreement method (LOA), intraclass correlation coefficient (ICC) and smallest real difference, in percent (SRD%) |
|||||||||
|
Age/gender |
n |
Test 1 Mean (SD) |
Test 3 Mean (SD) |
Difference |
|||||
|
Mean (95% CI) |
R |
SEM |
SRD |
ICC (95% CI) |
SRD% |
||||
|
Lumbar/thoracic extension torque, Nm |
|||||||||
|
50–90 years women |
20 |
172.30 (35.17) |
177.30 (36.81) |
5.00 (–3.78 to 13.78) |
–0.09 (–0.41) |
13.26 |
± 36.73 |
0.86 (0.69 to 0.94) |
21.02 |
|
50–90 years men |
21 |
277.71 (69.99) |
277.52 (72.56) |
–0.19 (–21.26 to 20.88) |
0.22 (–0.01) |
32.73 |
± 90.72 |
0.80 (0.56 to 0.91) |
32.68 |
|
18–49 years women |
18 |
186.72 (40.45) |
183.44 (44.64) |
–3.28 (–17.47 to 10.91) |
–0.15 (–0.46) |
20.18 |
± 55.89 |
0.78 (0.51 to 0.91) |
30.22 |
|
18–49 years men |
22 |
297.27 (74.64) |
296.41 (75.34) |
–0.86 (–15.35 to 13.62) |
0.14 (–0.07) |
23.10 |
± 63.99 |
0.91 (0.79 to 0.96) |
21.57 |
|
Lumbar/thoracic flexion torque, Nm |
|||||||||
|
50–90 years women |
20 |
80.80 (19.63) |
80.10 (18.99) |
–0.70 (–4.50 to 3.10) |
–0.19 (–0.23) |
5.74 |
± 15.89 |
0.92 (0.80 to 0.97) |
19.76 |
|
50–90 years men |
21 |
142.76 (35.79) |
151.00 (32.23) |
8.24 (–0.97 to 17.45) |
0.06 (–0.24) |
14.31 |
± 39.64 |
0.81 (0.58 to 0.92) |
27.00 |
|
18–49 years women |
18 |
81.89 (22.85) |
86.56 (20.69) |
4.67 (–0.98 to 10.31) |
–0.38 (–0.60) |
8.03 |
± 22.24 |
0.85 (0.64 to 0.94) |
26.43 |
|
18–49 years men |
22 |
159.59 (33.57) |
163.86 (38.50) |
4.27 (–2.49 to 11.04) |
0.35 (0.22) |
10.79 |
± 29.88 |
0.91 (0.79 to 0.96) |
18.49 |
|
Lumbar/thoracic rotation torque mean right/left, Nm |
|||||||||
|
50–90 years women |
20 |
50.23 (19.25) |
48.58 (19.87) |
–1.65 (–6.90 to 3.60) |
0.21 (–0.49) |
7.93 |
± 21.96 |
0.84 (0.64 to 0.93) |
44.49 |
|
50–90 years men |
21 |
122.12 (45.03) |
121.81 (43.57) |
–0.31 (–10.68 to 10.06) |
–0.12 (–0.40) |
16.11 |
± 44.61 |
0.87 (0.71 to 0.95) |
36.60 |
|
18–49 years women |
18 |
60.08 (23.40) |
66.25 (24.24) |
6.17 (–1.04 to 13.38) |
–0.05 (–0.45) |
10.25 |
± 28.40 |
0.80 (0.53 to 0.92) |
44.99 |
|
18–49 years men |
22 |
138.52 (41.22) |
141.91 (39.44) |
3.09 (–7.17 to 13.95) |
0.35 (–0.25) |
16.84 |
± 46.65 |
0.83 (0.63 to 0.93) |
33.29 |
|
95% CI: 95% confidence interval; R: Pearson product moment correlation between pre-log transformation absolute difference scores and mean of the 2 test sessions (values in parentheses are correlation coefficients obtained after log transformation); SEM: standard error of measurement; SRD: smallest real difference; ICC: intraclass correlation coefficient; SRD%: smallest real difference, in percent. |
|||||||||
Relative reliability. ICCs of the individual maximum trunk muscle torque measurements exceeded values equal to or larger than 0.78 when participants were retested either in the short- or long-term. Furthermore, the ICC values did not reveal relevant differences between the 2 gender-specific subgroups.
Comparison of peak moment measurements and their reliability between the 18–49-year-old subjects and those over 50 years old
Mean peak moment back extension, flexion, and rotation scores were non-significantly higher in younger than in the older male and female participants on all test days. Differences between the mean peak moment back extension, flexion, and rotation scores between the first and second or the first and third assessment were minimal in both age- and gender-specific subgroups. Measurement error of the young participants was similar to that observed for subjects > 50 years old in both gender-specific subgroups. Moreover, relative reliability as expressed in SRD% values, calculated separately for males and females, revealed comparable results between the young and older groups (Tables II–III).
Relationship between participants’ anticipatory feelings and motivation and the stability of their maximum isometric trunk muscle performance
Participants’ motivation and their positive emotions were moderate, whereas their negative emotions were minimal with no statistically significant differences observed between older and younger persons, or between males and females. Both their emotions and motivation remained unchanged from test to retest after 2 days or after 6 weeks (Table I). Neither participants’ anticipatory emotions and motivation at baseline, nor the respective short and long-term differences of their estimates were correlated with the coefficients of variation of the maximum trunk muscle moment tests calculated for each individual in a relevant way. This was the case in both age groups (Table IV).
|
Table IV. Results of the correlation analyses that evaluated the relationship between the baseline values, as well as the test-retest differences of participants’ anticipatory emotions and motivation, and the individual short- and long-term coefficients of variation (CV) of the trunk muscle moment measurements. Note that the statistical analyses correlated the short- and long-term differences of the trunk muscle measurements with the respective short- and long-term retest changes of participants’ emotions and motivation |
|||
|
Correlation of individual trunk muscle strength CVs with: |
R |
95% CI (bootstrapped) |
p-value |
|
Subjects over 50 years old |
|||
|
Negative feelings at baseline |
0.08 |
–0.25 to 0.41 |
0.6 |
|
Positive feelings at baseline |
0.10 |
–0.24 to 0.43 |
0.5 |
|
Motivation at baseline |
0.17 |
–0.17 to 0.49 |
0.3 |
|
Changes of negative emotions |
–0.12 |
–0.31 to 0.11 |
0.3 |
|
Changes of positive emotions |
0.08 |
–0.13 to 0.29 |
0.5 |
|
Changes of motiviation |
0.22 |
–0.02 to 0.42 |
0.05 |
|
Subjects younger than 50 years |
|||
|
Negative feelings at baseline |
–0.09 |
–0.42 to 0.23 |
0.5 |
|
Positive feelings at baseline |
0.12 |
–0.19 to 0.39 |
0.4 |
|
Motivation at baseline |
0.08 |
–0.20 to 0.36 |
0.6 |
|
Changes of negative emotions |
–0.01 |
–0.24 to 0.23 |
0.9 |
|
Changes of positive emotions |
0.21 |
–0.01 to 0.40 |
0.05 |
|
Changes of motiviation |
0.26 |
0.04 to 0.46 |
0.01 |
|
95% CI: 95% confidence interval; R: Pearson product moment correlation between pre-log transformation absolute difference scores and mean of the 2 test sessions. |
|||
Discussion
This study addressed the short- and long-term reliability of trunk muscle peak torque measurements in healthy persons over 50 years of age. First, absolute measurement error was small for the back extension and flexion tests, but higher for the trunk rotation tests in the > 50 years old. The relative retest reliability was good to excellent for all trunk muscle tests in the > 50 years old. Secondly, results of the short- and long-term reliability analyses suggest that retest reliability was similar in persons > 50 years old when compared with young, healthy persons. Thirdly, volunteers’ anticipatory emotions or motivation were not related to the precision of the peak moment measures.
Findings from this study suggest no relevant changes in the mean from the first to the second test day for the 3 different isometric maximum trunk moment tests. Whereas our observation is in agreement with one recently published study (18), it seems that this is in contrast to the majority of published data. These data have suggested significant improvements due to learning effects and/or insufficient recovery time from the first to the second isometric trunk muscle test sessions (16, 36, 37) when the back extension moment was tested in a sitting (16, 36) or standing position (37). Our findings suggest that the application of highly sophisticated trunk muscle assessment protocols may help to prevent systematic bias. The success of our protocol was probably attributed to several factors, including the test procedures as provided by the manufacturer, standardized instructions, standardized familiarization protocols that were individually adapted to the needs and demands of each subject, and the conductance of the tests in a fixed order and supervision by highly experienced individuals. We cannot exclude that the presence of muscle soreness or light pain in trunk muscles when retested may have interfered with participants’ maximum performance on the second test day, thereby compensating for a systematic error. Indeed, approximately half of the testees reported some minor back muscle strains on the second test day (mean VAS scores of 17 ± 2.1 mm, from best = 0 mm and worst = 100 mm), but further statistical analysis revealed no difference in maximum trunk muscle performance between the group that reported no pain and the group with pain (data not shown). As participants did not report pain on the third test day, learning effects would have likely become overt.
Findings of this study revealed that the SEM values of the trunk extension and flexion tests in participants > 50 years old were overall low and sensitive enough to detect a small, clinically relevant change after a preventive training intervention in both healthy elderly (e.g. (38, 39)) and young persons (16, 40, 41). As findings were unanimous between age-specific groups, it may be suggested that the previously reported SEM values from maximum sitting-position trunk muscle moments for young participants could be extended to elderly persons. Thus, the respective findings from the elderly individuals may be compared with those from young individuals (16, 20–22). In one study (16), a total of 136 young persons repeated maximum back extension tests after 3 and 6 days. The mean torque values were comparable to those observed for the young participants of this study, and the measurement error calculated for both males and females was 45 Nm. Another study retested young participants’ maximum back extension and flexion moments after 1 week (21). The estimated SEM values were comparable to those observed in our study.
The findings of this study revealed relatively high SEM values for the trunk rotation tests, and therefore may lack sensitivity to detect real changes after an intervention. There are a few explanations: (i) SEM was not assessed for each direction separately, but rather used the mean value obtained from the right and left rotation strength tests because it compensates for a subject’s preferred rotational direction; (ii) Stabilization of the lower body in the lateral direction may be less efficient than that in the anterior posterior direction due to the soft tissues of the thighs, which allow for an increased variability of adaptations and more degrees of freedom; (iii) Increased variability could also stem from the unpractised nature of trunk rotations against resistance. It is noteworthy that the precision of these trunk rotation tests were still clinically acceptable. A recent training study observed clearly more pronounced improvements in trunk rotation strength (40%) than for trunk flexors or extensors in elderly healthy persons (38).
We also assessed whether the tests were of a sufficient sensitivity to detect a real clinical change for a single individual. For the trunk extension and flexion tests in healthy persons over 50 years of age, the size of the relative change (SRD%) should exceed between 21% and 33% for trunk extension and 20% and 27% for trunk flexion. The respective values for trunk rotation were higher and ranged between 31% and 44%. Findings from previous studies that assessed maximum isometric back extension moment in young persons reported SRD% values between 21% (20) and 34% (21, 37). Likewise, SRD% values for trunk flexion were found to be between 24% (21) and 27% (37). From a clinical standpoint, the SRD% values presented strongly suggest that these trunk muscle moment tests are of sufficient clinical sensitivity to detect a real change in healthy persons as illustrated by a previously published prevention study (39). In that study, healthy elderly persons increased their lumbar extension strength by more than 58% after 6 months of regular training (39).
Bland Altman graphs revealed a few examples of larger measurement error for male participants who scored higher in their trunk muscle tests. Such heteroscedasticity is common for physical performance measurements (32) and may be caused by both physiological and psychological phenomena. Variability is probably greater, when expressed in absolute values, if the strength output is higher. However, if the variability is normalized to the strength measured, the % values are similar between those persons with lower and those with a higher performance. Such measurement variability could not be eliminated by omitting outliers.
Intraclass correlation coefficients (ICC2,1) in the range of 0.5 to 0.6 are fair, those in the range from 0.6 to 0.7 are good, and those above 0.75 are excellent (42). On the basis of these criteria, both the short- and long-term reproducibility of all trunk muscle measurements in male and female persons > 50 years old were excellent and similar to those observed from the younger males and females. ICCs reported in earlier works from young healthy persons appear comparable to those observed in this study. For instance, Paalanne and colleagues (18) reported ICCs for trunk muscle strength measurements ranging from 0.84 to 0.95 when tests were repeated after 7 days. In their study the participants were between 19 and 30 years of age and performed the tests in a standing position using a strain gauge dynamometer. In another study, Graves et al. (16) found high reliability coefficients (R > 0.90) for retesting back extension strength in a sitting position after 3 days when healthy volunteers between 17 and 58 years of age were tested with the MedX® device (Ocala, Florida). One recent study (19) retested healthy young and middle-age persons on the same day after an interval of 15 min and found excellent reproducibility, with ICCs ranging from 0.95 to 0.97.
Although the wide LOAs observed in our study probably induce high relative reliability values, the precision of the DAVID® test devices is sensitive enough to detect changes that may be induced by a rigorous strengthening intervention programme of more than 4 weeks in elderly persons (28, 29) and more than 9 weeks in young persons (16, 40), where significant improvements in trunk muscle strength can be expected. The precision of the tests may, however, be insufficient to identify real improvements if healthy volunteers perform a short or less rigorous exercise programme or if healthy volunteers start a training programme with an initially high trunk strength performance baseline (43).
This study has also investigated whether participants’ anticipatory emotions and motivation, as well as respective changes from test to retest, would influence the measurement noise of the trunk muscle strength tests. One mechanism has been suggested, that both a subject’s positive emotions and motivation anticipating the execution of a motor task would increase attentional control, thus increasing muscle strength. Attentional control is stimulus-driven, especially in persons with strong negative emotions, with the aim to reduce emotional tension. The goal-directed attentional system is disturbed during processing, which interferes with movements of attentional efforts, such as goal-directed tasks (23, 44). Thus, fluctuations in physical performance from test to retest may be related to both a subject’s baseline motivation and emotions, and the respective changes. Results of this study, however, did not reveal significant changes in participants’ emotions or any meaningful correlation between participants’ anticipatory feelings or motivation and the precision of the trunk moment measurements. It is noteworthy that our sample comprised of motivated persons who had few negative emotions. People in the general population who typically do not volunteer for research studies might present with more negative anticipatory emotions and could demonstrate more-pronounced fluctuations of their emotional state, thereby affecting the precision of the measures.
Limitations
Our participants constituted a convenience sample and represented community-dwelling, active, older adults that volunteered to participate in this research. Therefore, our results can only be generalized to older adults who are similar to our study population. The limited number of elderly participants may limit the external validity of estimates of reliability coefficients or the smallest real difference. A larger sample size, however, may not change the estimate of reliability, but may serve to narrow the confidence intervals of reliability coefficients.
One may argue that our ICCs observed were inflated as we included only the best out of 2 measurement repetitions into our statistical analysis. Unfortunately, we were not able to retrieve the complete data of both tests for comparing the respective ICCs. Nevertheless, we are confident that taking the mean of 2 measurements would not have improved the ICCs in a relevant way; the output of 2 consecutive maximum performance tests were required to be within 10%. In addition, previous research from hand dynamometric grips strength measurements performed in elderly persons suggested no difference of the ICC if calculated from the best or the second best out of 3 tests (45).
Conclusion
Reliability of maximum isometric trunk muscle measurements using David® devices performed in elderly healthy persons revealed a favourable level of detection of expected changes in muscular strength parameters as a result of a planned preventive exercise intervention. These findings were similar to those observed for younger persons in this and previous research. The present study has also generated novel SRD data that may assist therapists and clinicians in interpreting post-treatment changes in healthy elderly people.
AcknowledgEmentS
The authors would like to thank S. Ristic, PT, S. Bachinger, PT and M. Ritter, Rehabilitation Institute, XXII Vienna, for their assistance with the conduction of this study, and Professor P. Mair, PhD, Vienna University of Economics and Business, Vienna, Austria for his statistical advice.
References

