


Psychology, School of Life Sciences, University of Hull, Cottingham Road, Hull HU6 7RX, U.K. *E-mail: h.holle@hull.ac.uk
Accepted Nov 17, 2016; Epub ahead of print Nov 21, 2016
The reliable measurement of itch intensity is crucial, both in research as well as clinical contexts. For example, when the reliability of a measurement scale is unknown, it is impossible to determine whether a patient has changed sufficiently to be confident that the change is beyond that which could be attributed to measurement error (1, 2). One factor that might influence the reliability of measurements is the type of rating scale used to assess itch intensity. Previous research (3–4) has documented the retest reliability of different rating scales for assessing chronic itch intensity. However, a retest reliability analysis of rating scales for acute experimental itch, induced using substances such as histamine or cowhage, is currently lacking.
Here, we compare the test–retest reliability of 3 rating scales commonly used for this purpose.
First, we considered the visual analogue scale in its classic form (cVAS), where participants indicate itch intensity on a line ranging from 0 (no itch) to 100 (the most intense itch imaginable). Second, we included a variant of the VAS, where an additional ‘Scratch Threshold’ marker is set at 33% (tVAS [6]), defined as itching strong enough to be scratched (7). Finally, we considered the general Labelled Magnitude Scale (gLMS [8]), where participants judge the magnitude of itch on a line with quasi-logarithmically placed labels of “no sensation” at 0, “barely detectable” at 1, “weak” at 6, “moderate” at 17, “strong” at 35, “very strong” at 53 and “strongest imaginable sensation” at 100. Thus, all 3 scales have an identical range, but differ in the type and number of verbal labels provided (Fig. S1).
Ninety healthy volunteers took part after giving written informed consent. Twelve participants (gLMS group: n = 7, cVAS group: n = 5) were screened out as non-responders after the familiarization session (i.e., itch intensity ratings did not exceed 15) and one as an outlier (itch response above 3 SD of group mean), resulting in a final sample of 77 participants (38 females, mean age 24.66 ± 6.5; n = 25 in gLMS group, n = 26 in cVAS and tVAS group). Participants were told the study was investigating the effect of itch on heart rate and were fully debriefed after the final session. The study was approved by the local Ethics Committee at University of Hull. As an experimental itch model, we used the cowhage provocation paradigm (9). Briefly, 60–65 cowhage spicules were placed into a 16 cm2 area defined by medical tape on the left volar forearm. Spicules were then rubbed into the skin for 45 s. Itch intensity ratings were obtained every 15 s for 10 min using Presentation Version 17.0 (www.neurobs.com).
Participants were randomly assigned to a scale group (cVAS, tVAS or gLMS) and took part in 3 experimental sessions (mean ± SD 7.04 ± 1.0 days between sessions). Session 1 served as a familiarization session, where participants were trained in the correct application of the rating scale (as recommended by 2) and could experience the novel sensation of cowhage-induced itch. The statistical analyses are described below.
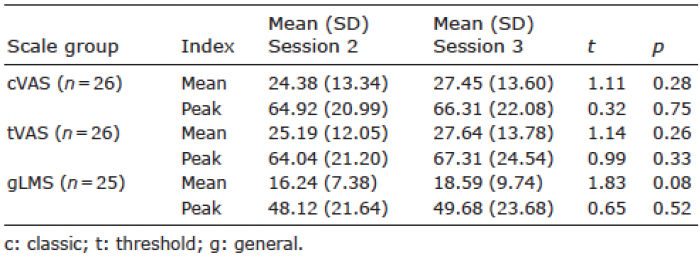
The peak and mean of each time course were used to quantify the overall itch intensity experienced by a participant. Scores did not differ significantly between sessions (Table I). Shapiro-Wilk tests indicated that mean and peak scores were normally distributed (all W > 0.93, all p > 0.09). Scale reliability was estimated by the Intraclass correlation coefficient (ICC) of the respective scores of Sessions 2 and 3, when participants were familiar with the experience of cowhage-induced itch and the scale. For this retest reliability analysis, we used a two-way mixed model, focusing on absolute agreement between sessions (10).
Table I. Descriptive statistics of the two itch indices (mean, peak) for each session and scale group. Columns 5 and 6 provide the t and p value of an independent samples t-test comparing Sessions 2 and 3
As shown in Table II, the gLMS had the highest retest reliability. This was the case regardless of which index was used to quantify itch intensity (peak: ICC 0.86; mean: ICC 0.71). The cVAS was the least reliable scale (peak: ICC 0.50; mean: ICC 0.45) and the tVAS had an intermediate reliability (peak: ICC 0.73; mean: ICC 0.64). Associated p-values, obtained using Fisher’s r-to-Z transformation, indicated that the gLMS was significantly more reliable than the cVAS (p = 0.01, see Table II).
Table II. Retest reliability estimated by the intraclass correlation coefficient (ICC) for the 3 scales and 95% confidence interval (CI)
The higher retest reliability of the gLMS cannot be explained in terms of response clustering (i.e., the clustering of ratings around the verbal labels, see Appendix S1). Instead, our data suggest that retest reliability may be linked to the degree to which scales are open to interpretation. Previous research has highlighted that the lack of verbal anchors in the cVAS creates ambiguity, because participants are unsure where exactly they should place their mark (11, 12). This unsystematic variation may limit the reliability of the cVAS. In contrast, the tVAS adds a scratch threshold marker, providing participants with an additional landmark to guide their ratings which increases scale reliability. Finally, the gLMS with its 7 verbal anchors is least ambiguous and was found to be the most reliable scale for measuring acute itch.
Another factor that could explain the observed superior reliability of the gLMS is that this scale has been explicitly designed to yield ratio data, whereas it is strongly debated whether the cVAS provides ratio (13) or merely ordinal level data (for review, see 12). There is evidence that rather than providing a linear transformation of the internal representation of stimulus intensity, the cVAS provides only a non-linear representation, with a compression of scores especially at the top end of the scale (11). In contrast, the roughly logarithmic distance between the verbal anchors in the gLMS, determined in a semantic scaling procedure, has been demonstrated to yield ratio level data for ratings of oral sensations (14, 15) though a validation in the domain of itch is still outstanding.
A limitation of the present study is that participants were excluded from taking part in sessions 2 and 3 when their intensity ratings did not exceed 15 in the initial familiarization session. No participant in the tVAS group was excluded based on this criterion, but several in the gLMS (n = 7) and cVAS (n = 5) group, which may have biased the results. In general, obtaining very low ratings seems less likely when using the tVAS. Note, however, that this potential bias cannot explain the main finding of our study (gLMS is significantly more reliable in assessing peak itch than cVAS), since a comparable number of participants were excluded from these two groups.
In summary, our results suggest that the gLMS rating scale enables a more reliable measurement of acute itch intensity in healthy volunteers. The gLMS scale may be particularly suited for longitudinal studies, though care must be taken to avoid memory effects (e.g., by allowing for sufficient time between ratings, or by using distractor items). Since scale reliability is not a fixed property, but is also population-dependent (16), further studies are necessary to investigate whether these advantages of the gLMS scale generalise to experimental itch induced in chronic itch patients or to the clinical assessment of chronic itch intensity.
Parts of this study were supported by a grant from the British Skin Foundation, awarded to HH (project number: 7011s).


 Click to show fullsize
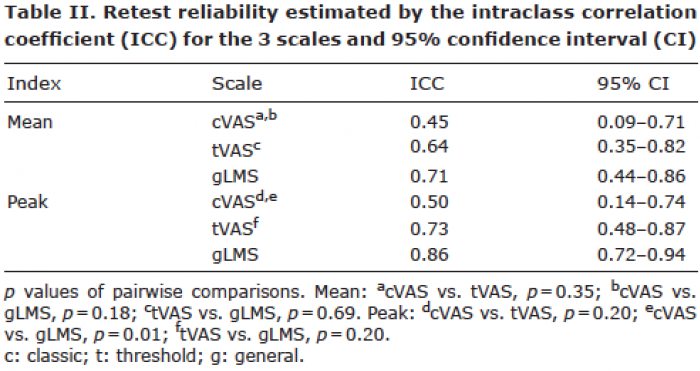 Click to show fullsize