


Department of Dermatology, The First Hospital of China Medical University, National Health Commission Key Laboratory of Immunodermatology, Key Laboratory of Immunodermatology of Ministry of Education, Shenyang, China
Chronic spontaneous urticaria (CSU) is a common skin disorder associated with autoimmunity. Micro-RNAs (miRNAs) are endogenous noncoding RNA molecules reported to be potential biomarkers for some autoimmune diseases. In this study, we investigated the association of miRNAs with CSU. A quantitative PCR (qPCR)-based array was generated from sera as obtained from 20 active CSU patients and 20 healthy controls. Upregulated or downregulated miRNAs were validated by reverse transcription qPCR in sera from 59 active CSU patients and 58 healthy controls. The expression of miR-125a-5p was significantly upregulated in CSU sera and serum levels of CCL17 were also significantly increased in CSU patients. Serum miR-125a-5p expressions were found to be further upregulated in refractory CSU cases (n = 10). In 12 CSU patients in remission, serum miR-125a-5p expression and CCL17 levels were significantly decreased as compared with that obtained in active phase patients. These results indicated that miR-125a-5p and CCL17 can serve as potential serum biomarkers for CSU.
Key words: chronic spontaneous urticaria; chronic idiopathic urticaria; miR-125a-5p; CCL17; IL-17.
Accepted Feb 26, 2019: E-published Feb 27, 2019
Acta Derm Venereol
Corr: Ting Xiao and Hongduo Chen, Department of Dermatology, The First Hospital of China Medical University, No. 155 Nanjing Bei Street, Shenyang 110001, China. E-mails: cmuxt@126.com; hongduochen@hotmail.com.
Currently, there exist no generally accepted objective biomarkers for chronic spontaneous urticaria. Therefore, the identification of new categories of biomarkers for chronic spontaneous urticaria are urgently needed. To the best of our knowledge, no published information is available regarding serum miRNA as related to chronic spontaneous urticaria. In this study, we provide new and important findings which show that serum expression of miR-125a-5p and CCL17 are significantly upregulated in patients with active chronic spontaneous urticaria and significantly decreased in the remission phase. Moreover, a further upregulation in serum miR-125a-5p expression was observed in refractory chronic spontaneous urticaria cases. These results highlight the significance of miR-125a-5p and CCL17 as potential serum biomarkers for chronic spontaneous urticaria.
Chronic spontaneous urticaria (CSU) is defined as the spontaneous recurrence of itchy wheals and/or angioedema that are present for > 6 weeks in the absence of any apparent causes (1). CSU generally has a prolonged duration of 1 to 5 years and exerts a profound impact on the patients’ quality of life. The prevalence of CSU is approximately 1.8% of the adult population (2). A subset of CSU is considered to be an autoimmune disease. Circulating autoantibodies including anti-IgE, anti-Fc?RI, anti-thyroglobulin (TG) or anti-thyroid peroxidase (TPO) have been found in patients with CSU. However, these autoantibodies are not CSU-specific and therefore, cannot serve as biomarkers reflecting disease severity and treatment responses. A number of parameters have been reported to be increased within the sera or plasma of patients with CSU, but few have been generally confirmed as being specifically related to CSU (3). Accordingly, there is a lack of objective and specific biomarkers for CSU and the identification of such biomarkers is urgently needed for this condition.
MicroRNAs (miRNAs) are endogenous ~22nt noncoding RNA (ncRNA) molecules that decrease targeted mRNA levels and/or reduce expression of their cognate target proteins. They can accomplish these effects through a number of different mechanisms including RNA degradation, induced decapping/deadenylation, altered cap protein binding, reduced ribosome occupancy, and/or sequestration of mRNA from translational machinery. MiRNAs, either alone or in combination with other known biomarkers, have been used as diagnostic tools in many studies (4). As secreted miRNAs remain stable in body fluids, they are more readily available for assay and less invasive than biopsies. These advantages make them a very appealing diagnostic instrument.
Th2-mediated immune pathways induce mast cell activation and degranulation via IgE antibody production and its binding to the Fcε receptor (FcεR) (5). Th17 cells show both inhibitory and stimulatory effects on antibody production by mast cells (6). Of particular relevance to the current study are the recent findings revealing that Th2/Th17 cytokines, transcription factors and Th2 chemo-kines are upregulated or elevated in CSU patients’ skin lesions, plasma and serum, respectively (7–10). Accordingly, Th2 and Th17 pathways may be involved in the pathogenesis of CSU, and CCL17 and IL-17 can serve as serum markers of Th2 and Th17 inflammation, respectively.
Increasing evidence has been provided showing that serum/plasma miRNAs are involved in autoimmune diseases including rheumatoid arthritis (RA), systemic lupus erythematosus (SLE) and type 1 diabetes (11–14). However, little is known about the role of miRNAs in CSU. In the present study, we investigated expression profiles of miRNAs in sera of CSU patients. Serum levels of CCL17 and IL-17 were simultaneously detected as references.
Serum samples were obtained from 79 adult Chinese Han ethnic patients (age range: 18–65 years) with active CSU. These patients presented to the urticaria outpatient clinic of the Department of Dermatology at the First Hospital of China Medical University over the period from June, 2014 to February, 2017. The diagnosis of CSU was based on the EAACI/GA2LEN/EDF/WAO guideline (15). Only patients with active CSU were enrolled. Seventy-five of these CSU patients had been treated at local hospitals or by other dermatologists in our hospital prior to presentation at our clinic. Patients with chronic inducible urticaria or urticarial vasculitis, and CSU patients who had been treated by systemic corticosteroid and immunosuppressants, were excluded. CSU patients who simultaneously suffered from active atopic diseases (allergic rhinitis, atopic dermatitis and/or asthma) were excluded. Demographic, clinical and laboratory data were collected through a structured questionnaire, completed medical histories, physical examinations and laboratory tests. Urticaria activity score (UAS) was evaluated by a dermatologist, a postgraduate and the patient.
Control serum samples were collected from 78 healthy age- and sex-matched Chinese Han ethnic volunteers. Healthy controls were required to have normal serum levels of total IgE, negative specific IgE allergens, negative anti-thyroglobulin (TG) and anti-thyroid peroxidase (TPO) antibodies.
The study was approved by the ethics committee of the First Hospital of China Medical University. A written informed consent was obtained from all participants.
Total RNA was isolated from serum samples (200 μl per sample) of 20 CSU patients and 20 controls using a miRNeasy Serum/Plasma Kit (Qiagen, Hilden, Germany) according the manufacturer’s protocols. In general, the yield of total RNA was 2–10 ng/μl. The cDNA was obtained from 3 μl of RNA using the TaqMan® microRNA Reverse Transcription Kit (Applied Biosystems, Beverly, MA, USA). The cDNA product per specimen (2.5 μl) was then pre-amplified using the TaqMan® PreAmp Kit (Applied Biosystems). Quantitative PCR (qPCR)-based array analysis was performed using the TaqMan Low Density Array Human MicroRNA Panel (Capitalbio, Beijing, China). A total of 768 known human miRNAs were quantified using the TaqMan® Human MicroRNA Array A and B kit (Applied Biosystems). Raw cycle threshold (Ct) values were calculated using SDS 2.4 and RQ manager 1.2 software (Applied Biosystems) and applied automatic baseline and threshold settings. A Ct value greater than or equal to 35.0 was discarded.
The small nuclear RNA (snRNA) U6, hsa-miR-16, hsa-let-7a and hsa-let-7d are often used as endogenous controls (16–18). However, C. elegans miRNAs such as cel-miR-39, as obtained from different species and are neither expressed in humans nor show a sequence similarity to known human miRNAs, were used for spike-in controls (19, 20). After qPCR-based array detection, we analyzed stability and variability of expression for U6 snRNA, hsa-miR-16, hsa-let-7a and hsa-let-7d between CSU patients and healthy controls. From this analysis, we found that the expression of hsa-let-7d was more stable and less variable than that of the other 3 miRNAs in both CSU patients and healthy controls. Therefore, we chose hsa-let-7d as an endogenous miRNA control and cel-miR-39 as an exogenous spike-in miRNA control for normalization.
Total RNA was isolated from serum samples of 59 CSU patients and 58 healthy controls. C. elegans miR-39 (1.6 ×10⁸ copies/μl, Qiagen) was added to sera prior to RNA isolation (19, 20). Extracted RNA was eluted into RNAse free water, adjusted to a fixed total RNA concentration of 2 ng/μl, and reversely transcribed using a Reverse Transcription kit (Applied Biosystems). MiRNAs were quantified using TaqMan™ MicroRNA assays (Applied Biosystems). The quantitative PCR (qPCR) was performed using a 7900HT Fast Real-Time PCR System (Applied Biosystems). Each qPCR test was performed in duplicate. Ct values were obtained using SDS 2.4 and RQ manager 1.2 software (Applied Biosystems).
In the course of qPCR validation, Ct values of hsa-let-7d were > 30 in 225 of 234 qPCR tests, and > 35 or undetermined in 15 of 234 qPCR tests. Ct values of hsa-let-7d were significantly different between the 59 CSU patients and 58 healthy controls (p < 0.0001). Based on these results, we chose cel-miR-39 to normalize expression levels of miRNAs for qPCR validation.
Serum levels of CCL17, IL-17 (R&D Systems, USA) and total IgE (Euroimmun, Lübeck, Germany) were measured using ELISA kits according to the manufacturers’ protocols. The minimal detectable concentrations of CCL17 and IL-17 were 7 pg/ml and 15 pg/ml, respectively. The normal range of total IgE was from 0–100 IU/ml.
Serum allergen-specific IgEs were detected using immunoblotting (Euroimmun). The detected allergens included willow/poplar/elm, ragweed, mugwort, pteronyssinus/farinae, house dust, cats, dogs, penicillium/branch spore mould/fumigatus/alternaria, humulus, egg white, cow’s milk, peanut, soybean, beef, mutton, codfish/lobster/scallop, salmon/weever/carp, shrimp, crab. A test result of 0.7 kU/l or higher (level 2 to 6) was considered positive.
Serum levels of anti-TG and anti-TPO antibodies were measured according to the manufacturer’s protocols (Abbott Park, Middletown, USA). The normal ranges of anti-TG and anti-TPO were from 0.0000–4.1100 IU/ml and 0.0000–5.6100 IU/ml, respectively.
Second-generation H1-antihistamines in licensed doses were used as the first-line treatment. Second-generation H1-antihistamines produced by both international and domestic pharmaceutical companies are commercially available in China. All CSU patients in this study had been treated by H1-antihistamines from international pharmaceutical companies. Second-line treatment included an increase in the dose to a maximum of 4-fold of the H1-antihistamines (15) or combinations of H1-antihistamines (designated as up to a 4-fold equivalent dose) (21). If the disease was not completely controlled by this 4-fold dose or 4-fold equivalent dose of H1-antihistamines, H2-antihistamine (ranitidine) (21), leukotriene receptor antagonist (montelukast) (15, 21) or total glucosides of paeony were added. Omalizumab was not available in China when this study was performed. Cyclosporine was used as a third-line treatment. CSU cases requiring a 4-fold dose or 4-fold equivalent dose of H1-antihistamines to achieve complete remission of symptoms were designated as refractory cases. As most patients were already on a H1-antihistamine treatment prior to presentation, we directly administered an increase in the H1-antihistamine dose or added other H1-antihistamines and followed up on the patients weekly. When complete control of symptoms was achieved, the patients, who were on the treatment regimen for 2 to 3 months were followed up at monthly intervals. Therapies were then tapered at monthly intervals until discontinuation of medications.
For qPCR-based array analysis, global normalization was used to subtract the mean Ct value of all detected miRNAs in each serum sample from the Ct value of each individual miRNA from the same sample. The resulting value was the ΔCt value. The ΔΔCt was then calculated by subtracting average ΔCt of the healthy controls from average ΔCt of CSU patients (22). Quantitative PCR-based array data were then analyzed using software R (version 3.2.3; available from https://www.r-project.org/). Differentially expressed miRNAs of qPCR-based array analysis were defined as being both a minimum of a twofold change in 2 | -ΔΔCt | values and a p-value < 0.05 between CSU patients and healthy controls. Expression levels of miRNAs were normalized to cel-miR-39 (ΔCt) and presented as 2-ΔCt in qPCR validation study.
Results for non-normally distributed continuous variables were summarized as medians (along with interquartile ranges, IQR) and were compared with use of the Mann-Whitney U-test. Paired data were analyzed using the non-parametric Wilcoxon signed-rank test. The Fisher’s exact test was used for qualitative variables. Receiver operating characteristic (ROC) curves and areas under the curve (AUC) were used to evaluate the diagnostic performance of miRNA and CCL17. Additionally, with use of the ROC curve, a maximal Youden’s index was calculated. Youden’s index = sensitivity + specificity – 1. The Youden’s index value is associated with the critical expression point or the optimal threshold value, also called cut-off point for the biomarker. Optimal cut-off values were set as the threshold with the maximal Youden’s index (23, 24). Spearman’s rank correlation coefficients were used to assess potential correlations between variables. p-values less than 0.05 were required for results to be considered statistically significant. Statistical analysis was performed using GraphPad Prism 7.0.
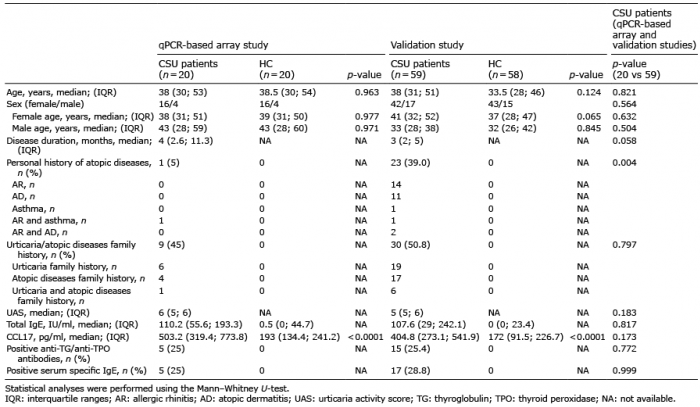
Demographic, clinical and laboratory data of the participants for the qPCR-based array analysis and validation study are presented in Table I.
Table I. Characteristics of chronic spontaneous urticaria (CSU) patients and healthy controls (HC) in the qPCR-based array and validation studies
MiR-125a-5p was significantly upregulated in sera of the 20 CSU patients as compared with that in the 20 healthy controls. In contrast, miR-221-3p, miR-224-5p, miR-296-5p, miR-127-3p, miR-21-5p and miR-25-3p were significantly downregulated in sera of these CSU patients as compared with the healthy controls (Fig. 1).
Fig. 1. Differential analysis of serum miRNAs between chronic spontaneous urticaria (CSU) patients and healthy controls. (A) Heat map illustrating differentially expressed miRNAs. The vertical axis is constructed using -ΔCt values of all 7 differentially expressed miRNAs showing statistically significant differences (p < 0.05). The horizontal axis represents that of 20 controls and 20 CSU patients. (B) The mean - ΔCt values, fold change and p-values of the one significantly upregulated miRNA (with positive fold change) and the 6 significantly downregulated miRNAs (with negative fold change) in CSU patients (p < 0.05). HC: healthy controls; SD: standard deviation.
Among the 7 significantly dysregulated miRNAs in the qPCR-based array study, only miR-125a-5p was significantly upregulated [0.024 (0.013; 0.047) vs 0.009 (0.006; 0.016), p < 0.0001] in sera of the 59 CSU patients as compared with that of the 58 healthy controls (Fig. S1A). Expressions of the remaining 6 miRNAs (miR-221-3p, miR-224-5p, miR-296-5p, miR-127-3p, miR-21-5p and miR-25-3p) were not significantly altered in sera of these CSU patients as compared to the healthy controls. The AUC value for miR-125a-5p was 0.794 (95% CI, 0.712–0.876, p < 0.0001). The sensitivity and specificity of miR-125a-5p (2-ΔCt at the cut-off level of > 0.016) within CSU patients were 71.2% and 77.6%, respectively (Fig. 2A).
Fig. 2. Receiver operating characteristic (ROC) curves and areas under the curve (AUC) values of (A) miR-125a-5p and (B) CCL17 of 59 chronic spontaneous urticaria (CSU) patients and 58 healthy controls. An AUC value equal to 1.0 indicates that the parameter perfectly discriminates between CSU patients and healthy controls. An AUC equal to 0.5 indicates that the results are purely random.
Serum levels of CCL17 in the 59 CSU patients were significantly increased (404.8 [273.1; 541.9] vs 172 [91.5; 226.7] pg/ml, p < 0.0001, Fig. S1B) as compared with those obtained from the 58 healthy controls. The AUC value for CCL17 was 0.911 (95% CI, 0.860–0.961, p < 0.0001, Fig. 2B). The sensitivity and specificity of CCL17 (at the cut-off level of > 263.0 pg/ml) within CSU patients was 78.0% and 94.8%, respectively. Surprisingly, serum IL-17 was nondetectable in 77 CSU patients and 76 healthy controls. Only 2 CSU patients and 2 healthy controls showed detectable levels of IL-17 of approximately 20 pg/ml.
The 59 CSU patients were allocated into different subgroups by sex, with/without angioedema, with/without personal history of atopic diseases, with/without urticaria family history, with/without atopic disease family history, with positive/negative anti-TG/anti-TPO antibodies, with normal/increased serum total IgE and with positive/negative serum specific IgE. With the exception of the with/without angioedema subgroup, no statistically significant differences in serum expression levels of miR-125a-5p were obtained within the other subgroups. Interestingly, however, relative expressions of serum miR-125a-5p were markedly upregulated in 46 CSU patients with CCL17 > 263.0 pg/ml in comparison with 13 CSU patients showing CCL17 ≤ 263.0 pg/ml (0.032 [0.018; 0.053] vs 0.011 [0.009; 0.026], p = 0.002) (Table SI). In addition, miR-125a-5p expression was positively correlated with CCL17 (Spearman rho = 0.394, p = 0.002, Fig. S2).
No statistically significant differences between the 10 refractory cases (Table SII) and the 49 non-refractory cases (Table SIII) were obtained for sex, age, disease duration, with/without personal history of atopic diseases, with/without urticaria family history, with/without atopic diseases family history, with/without angioedema, UAS, serum total IgE level, serum CCL17 level, positive/negative anti-TG/anti-TPO antibodies, and positive/negative serum specific IgE. Interestingly, relative expressions of serum miR-125a-5p were significantly increased in the 10 refractory cases as compared with that obtained in the 49 non-refractory cases (p = 0.012, Table II).
Table II. Characteristics of refractory versus non-refractory chronic spontaneous urticaria (CSU) cases
None of the patients in our study required cyclosporine. Additional serum samples from 12 CSU patients (8 refractory cases, 4 non-refractory cases) in the remission phase were collected. Characteristics of these 12 patients are presented in Table SIV. Three patients had discontinued their medications for > 6 weeks, while the remaining 9 were mostly controlled with a standard dose of H1-antihistamines (Table SV). In comparison with levels observed in the active phase, relative expressions of serum miR-125a-5p were significantly downregulated in the remission phase (0.028 [0.007; 0.058] vs 0.004 [0.002; 0.009], p = 0.018, Fig. 3A). Meanwhile, serum CCL17 levels were significantly decreased in the remission phase (597.1 [346.3; 976.6] vs 343.3 [256.6; 488.9] pg/ml, p = 0.001, Fig. 3B).
Fig. 3. Serum levels of miR-125a-5p and CCL17 in active and remission phases of the 12 patients with chronic spontaneous urticaria. In comparison with the active phase, (A) serum miR-125a-5p expression levels were significantly downregulated (p = 0.018), and (B) serum CCL17 levels were significantly decreased (p =0.001) in the remission phase.
Universally employed miRNA target data bases, including Diana-microT-CD, miRDB, TarBase, and TargetScanHuman 7.1, were identified using a Wikipedia (The Free Encyclopedia, Wikimedia Foundation, San Francisco, CA) search engine (25). As these data bases predict targeted genes of miRNA merely based on miRNA sequence, an element of chance may exist. To avoid this possibility, we considered only the 154 potential targeted genes that had been reported to be related with CSU (25). No matched targeted genes of miR-125a-5p using Diana-microT-CD, miRDB and TarBase were found. Currently, TargetScanHuman 7.1 contains the greatest number of possible target genes for each miRNA (25). With use of this database, we first generated a gene set of potential targeted genes for miR-125a-5p and then compared this gene set with the 154 CSU-related genes. Three targeted genes were found to match, B-cell/lymphoma 2 (BCL2), signal transducer and activator of transcription 3 (STAT3) and transforming growth factor-beta receptor type1 (TGFBR1). All 3 of these targeted genes have been reported to be upregulated within lesions of CSU patients (26). The bioinformatics of each of these 3 matched genes using the KEGG pathway data base (27) and the PathCards data base (28) were examined. A signaling pathway comprising ≥ 3 different genes was considered as comprising a trustworthy canonical signaling pathway (25). Based on this assumption, the following seemed to represent valid pathways – advanced glycation end products and receptor for AGE (AGE-RAGE) (including BCL2, STAT3, TGFBR1), forkhead box O (FoxO, including BCL2, STAT3, TGFBR1), janus kinase and signal transducer and activator of transcription (JAK-STAT, including BCL2, STAT3), and epidermal growth factor receptor (EGFR) tyrosine kinase inhibitor resistance (including BCL2, STAT3) (Table SVI).
CSU is a common immune mediated inflammatory disorder. To date, there was only one published plasma miRNA study for CSU. Lin et al. (25) used qPCR-based array technology (LC Sciences, LLC, Houston, TX) for the quantitation of 2,567 known human miRNAs within the plasma of 6 patients with chronic idiopathic urticaria (CIU) and active hives and 6 CIU patients without active hives. A total of 16 miRNAs were found to be differentially expressed and 13 CIU-associated targeted genes were targeted by at least 3 differentially expressed miRNAs. The expression levels of miR-2355–3p, miR-2355–5p, miR-29c-5p, miR-361–3p, and miR-4264 were significantly increased in plasma samples of 3 patients with active hives and Fc? antibody (chronic autoimmune urticaria, CAU) (25). Interestingly, the 5 differentially expressed miRNAs as identified by the qPCR-based array analysis within the plasma of CIU patients in Lin et al’s study were completely different from the 7 differentially expressed miRNAs observed within the sera of CSU patients in our study. The differences in qPCR-based array results obtained between the two studies might be due to ethnicity differences and/or size of the miRNA library. To the best of our knowledge, the present report represents the first study to investigate serum miRNAs expression in CSU. In this study, we show that expression levels of miR-125a-5p are significantly upregulated in the sera of CSU patients (especially in refractory cases) and significantly decreased in the remission phase.
MiR-125a-5p is associated with a number of autoimmune diseases. For example, plasma miR-125a-5p has also been found to be a potential diagnostic marker of RA (13). Moreover, miR-125a-5p mimics decrease CXCL13 levels and miR-125a-5p inhibitors increase CXCL13 levels in CD4+ T cells of patients with immune thrombocytopenic purpura (29). miR-125a-5p is a key regulator for regulatory T (Treg) cell function through regulating the expression of the IL-6 receptor and STAT3 (30). Expression of miR-125a-5p was found to be upregulated while CCR2 downregulated in Treg cells from pancreatic draining lymph nodes of patients with type 1 diabetes. Such results indicate that miR-125a-5p expression should normally be low in functional Treg cells whereas an upregulation of miR-125a-5p would be detrimental for Treg-cell function (14). Interestingly, a decreased percentage of Treg cells in PBMCs was found in patients with CSU (31).
Among the 154 previously reported CSU-associated genes, only BCL2, STAT3 and TGFBR1 were targeted genes of miR-125a-5p. In contrast, to date, no association with CSU/CIU has been reported for AGE-RAGE, FoxO and EGFR tyrosine kinase inhibitor resistance signaling pathways. Based upon these results, these 3 miR-125a-5p targeted genes, as identified through prediction analysis, were chosen for focus in our subsequent discussion. Although they cannot be completely described as being causal in the pathology of CSU, their prospective relationship with CSU merits consideration.
BCL2, which is located on chromosome 18, represents an important anti-apoptosis gene in mammalian cells (32). Overexpression of BCL2 dysregulates apoptosis of central or peripheral T cells and leads to autoimmune reactivities. T-cell activation is proportional to mast cell degranulation in CSU (33) and it has been demonstrated that an increased protein expression of BCL2 is present in activated B and T lymphocytes within severe CSU patients as compared with that observed in moderate CSU patients and normal controls (34).
STAT3, located in chromosomal region 17q21, is an essential protein involved in cell growth and apoptosis and is expressed in all tissue types (35). STAT3 is a member of the transcription factors family that play critical roles in affecting cytokine-induced changes in gene expression. Loss-of-function mutations in the STAT3 gene results in hyperimmunoglobulin E syndrome (36). Gain-of-function mutations in the STAT3 gene have been reported to result in multiorgan early-onset autoimmune diseases such as hypothyroidism, type 1 diabetes mellitus, autoimmune enteropathy, autoimmune hemolytic anemia, autoimmune thrombocytopenia and autoimmune neutropenia (37). STAT3 activity, which is driven by IL-6, is important for chemokine regulation of T cell recruitment (38) and an IL-6 deficiency is associated with a defective expression of CCL17 (38). Interestingly, the inflammatory process in CSU patients, which is independent of the involvement of autoimmune/autoreactive phenomena, is mirrored by increases in plasma IL-6 concentrations (39).
With regard to TGF-β, this signaling pathway regulates cellular proliferation, apoptosis, differentiation, remodeling, cell cycle arrest and extracellular matrix (ECM) formation. The signal is transduced by transmembrane serine-threonine kinase receptors, TGF-β receptor type 1 (TGFBR1) and TGF-β receptor type 2 (TGFBR2). Patients with mutations in the genes encoding TGF-β receptor subunits (TGFBR1 and TGFBR2) are strongly predisposed to develop allergic diseases (40).
An additional factor related to CSU is CCL17, or thymus activation-regulated chemokine (TARC). CCL17 is a well-recognized Th2 chemokine that has been reported to be increased in the sera of CSU patients as Lu et al. (9) showed that serum concentrations of CCL17 were significantly increased in 24 patients with CSU as compared to 25 healthy controls. Moreover, in the present study, we report that serum levels of CCL17 were significantly increased in the active phase of CSU and significantly decreased in the remission phase. Although the CCL17 gene is not one of the targeted genes of miR-125a-5p, it is associated with CSU-related genes (25). According to KEGG, the CCL17 gene is involved with 3 signaling pathways: the cytokine-cytokine receptor interaction signaling pathway, chemokine signaling pathway and the IL-17 signaling pathway. The cytokine-chemokine network consequent to immune dysregulation may be a notable component in the pathogenesis of CSU. It seems likely that different pathomechanisms are interlinked in CSU rather than that involving independent cascades (41). Interestingly, the targeted genes of miR-125a-5p described above are related with CCL17. For example, STAT3 together with CCL17 is involved in the chemokine signaling pathway while TGFBR1 together with CCL17 is involved in the cytokine-cytokine receptor interaction signaling pathway. In this study, we report that serum expression levels of miR-125a-5p were markedly upregulated in 46 CSU patients with serum CCL17 > 263.0 pg/ml but not in 13 CSU patients with serum CCL17 ≤ 263.0 pg/ml. Taken together these findings indicate two salient characteristics regarding the relationship among miR-125a-5p, CCL17 and CSU. First, that miR-125a-5p and CCL17 may exert synergistic actions in the pathogenesis of CSU and, second, that CCL17 may serve as a serum biomarker for CSU.
The association between IL-17 and CSU has received relatively little attention and the results available on this relationship are somewhat inconsistent. Dos Santos et al. (42) and Atwa et al. (10) reported that serum IL-17 levels were significantly increased in CIU/CSU patients and Grzanka et al. (43) also showed that plasma IL-17 was significantly increased in CSU patients. In contrast, Arshi et al. (31) showed that serum IL-17 levels were nondetectable in 37 of 41 CSU cases, and in our present study, we found that serum IL-17 levels were nondetectable in 77 of 79 CSU patients. Our results were similar with Arshi et al’s findings, though their patients were free of antihistamines for 7 days before blood sampling. A possible explanation for the differences in these results may be attributable to the disease duration of CSU. The median duration of CSU in patients of our study was 4 months, which is substantially shorter than that in Atwa et al. (8.9 months) and Grzanka et al. (2.5 years) studies. Another possible explanation may be differences in the ethnicity of patients used in these studies. The role of IL-17 in CSU needs further investigation.
The findings presented in our study represent that encountered from real-life circumstances. Notably, patient compliance was generally poor. Moreover, as the basic medical insurance system in China is quite different from those systems of referral in European countries and the US, patients often are seen by several different doctors in our dermatologic clinic within the same day. It was difficult to persuade these patients to discontinue their antihistamines for 7 days to score UAS7 and autologous serum skin tests were not performed in this study. Finally, the in vivo function of miR-125a-5p in CSU and the genes targeted by miR-125a-5p were not investigated. Nonetheless, this descriptive study involving CSU patients in the active phase of their disease provides valuable new information which can serve as the foundation for subsequent research. In specific, this study represents the first investigation on serum miRNA expression in CSU within the largest sample size to date.
In conclusion, increased serum expression levels of miR-125a-5p and CCL17 are observed in patients with CSU. These findings suggest two significant novel insights into the processes related to CSU. First, that miR-125a-5p and CCL17 may function synergistically in CSU and second that they can serve as biomarkers for this condition. Further studies utilizing different patient populations and functional investigations will be required to corroborate these findings.
This study was supported by the National Key Clinical Specialist Subject Construction Project on Urticaria from National Health Commission ([2012]649) and the Basic Research Project from the Department of Education, Liaoning Province, China (LZ2015078).
The authors have no conflict of interest to declare.


 Click to show fullsize
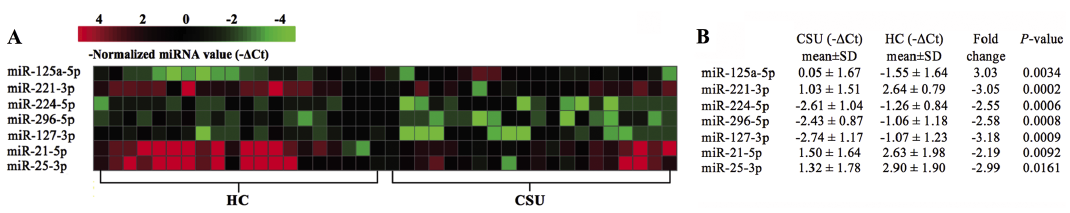 Click to show fullsize
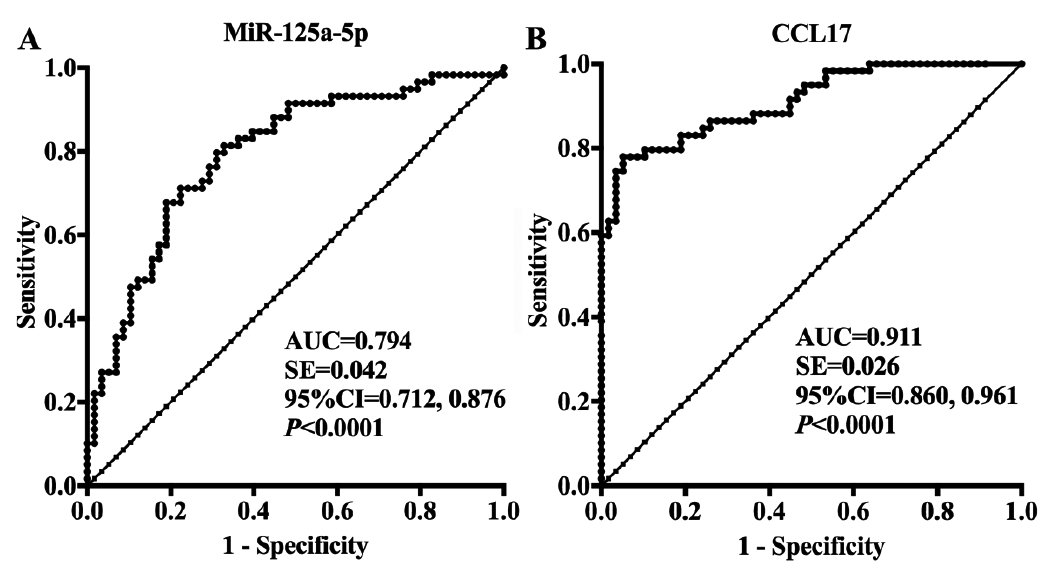 Click to show fullsize
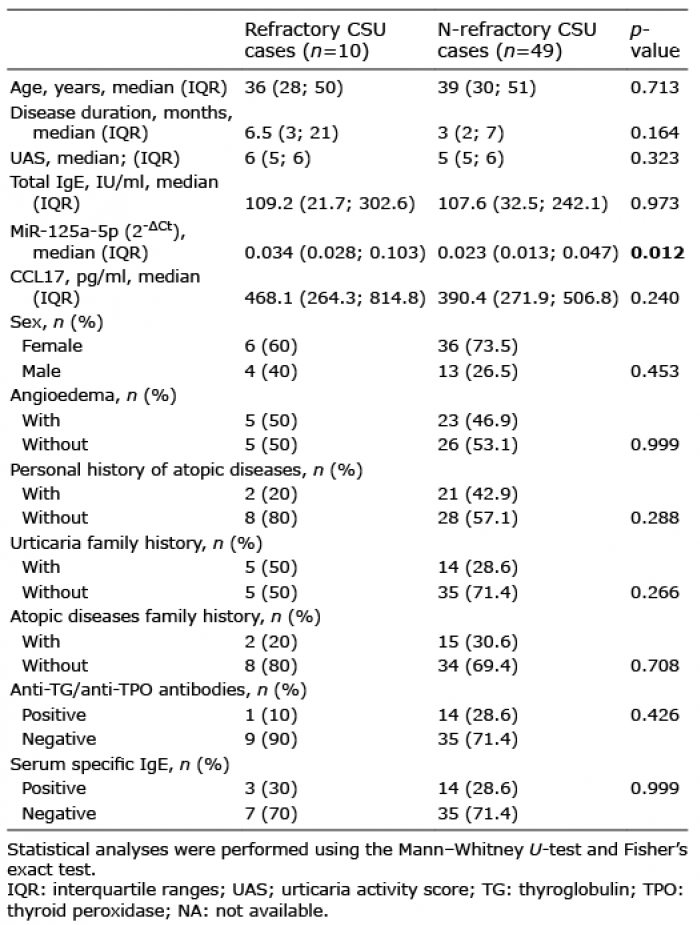 Click to show fullsize
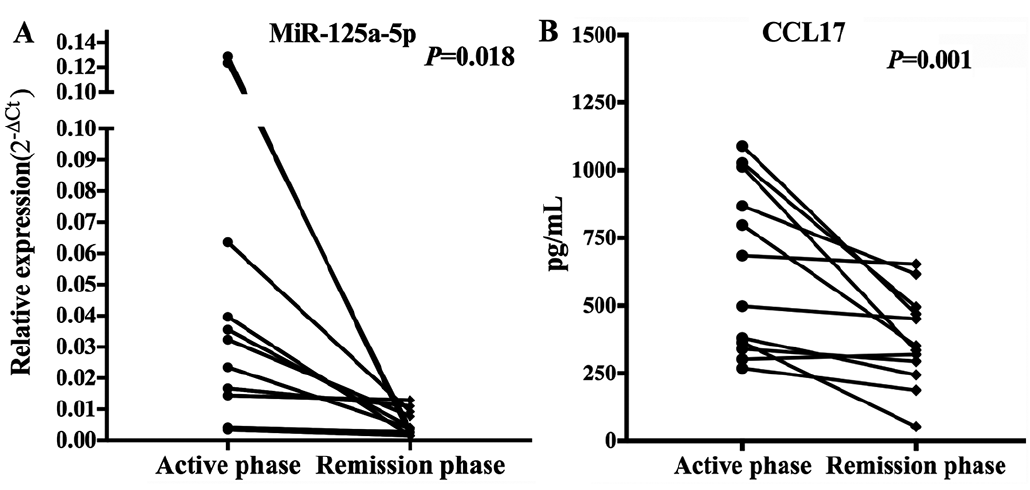 Click to show fullsize