


1Department of Pathophysiology, 2Department of Dermatology, University of Tartu, 3Clinic of Dermatology, Tartu University Hospital, Tartu, Estonia, 4Centre for Comparative Genomics, Murdoch University, 5The Perron Institute for Neurological and Translational Science, Perth, Australia and 6Department of Oncology and Metabolism, The Medical School, University of Sheffield, Sheffield, UK
#Both authors contributed equally to this manuscript.
Accurate biomarker-based diagnosis of psoriasis vulgaris has remained a challenge; no reliable disease-specific biomarkers have yet been identified. There are several different chronic inflammatory skin diseases that can present similar clinical and dermoscopy features to psoriasis vulgaris, making accurate diagnosis more difficult. Both literature-based and data-driven selection of biomarker was conducted to select candidates for a multicomponent biomarker for psoriasis vulgaris. Support vector machine-based classification models were trained using gene expression data from locally recruited patients and validated on 7 public datasets, which included gene expression data of other inflammatory skin diseases in addition to psoriasis vulgaris. The resulting accuracy of the best classification model based on the expression levels of 4 genes (IL36G, CCL27, NOS2 and C10orf99) was 96.4%, outperforming classification based on other marker gene combinations, which were more affected by variability in gene expression profiles between different datasets and patient groups. This approach has the potential to fill the void of clinically applicable diagnostic biomarkers for psoriasis vulgaris and other inflammatory skin diseases.
Key words: psoriasis; transcriptome; support vector machine.
Accepted Oct 14, 2019: E-published Oct 14, 2019
Acta Derm Venereol 2020; 100: XX–XX.
Corr: Freddy Lättekivi, Department of Pathophysiology, University of Tartu, 14b Ravila Str., EE-50411 Tartu, Estonia. E-mail: freddy.lattekivi@ut.ee
This article highlights the issue that previously proposed gene expression-based biomarkers for psoriasis vulgaris are dataset-specific, and therefore perform less accurately in alternative groups of patients. This paper addresses this problem by demonstrating that combining several potential biomarkers into a single multicomponent biomarker results in more accurate classification models, which retain their accuracy across different datasets and patient groups with the inclusion of other inflammatory skin diseases. We believe that this approach has the potential to fill the void of clinically applicable diagnostic biomarkers for psoriasis vulgaris and other inflammatory skin diseases.
Psoriasis can be a challenging disease to diagnose, as no reliable disease-specific and clinically viable biomarkers have been identified. Psoriasis is one of the most prevalent chronic inflammatory autoimmune diseases of the skin, affecting 2–3% of the population worldwide (1). Clinically, psoriasis can manifest itself in a broad spectrum of subtypes, the most common of which is psoriasis vulgaris (PsV) (2). PsV can share several similar clinical and molecular features with other chronic inflammatory skin conditions, such as parapsoriasis, lichen planus, pityriasis rosea, contact eczema, and atopic dermatitis (3–5). All these diseases, however, have different treatment and disease management strategies (6–9), which necessitates accurate and biomarker-based diagnosis.
Currently, the diagnosis of PsV relies mainly on the assessment of visible and dermoscopic symptoms by a clinician (10–13) or, in borderline cases, histological evaluation (2). Disease-specific biomarkers could also improve the diagnosis of PsV overlapping with other papulosquamous disorders and provide more accurate means of quantifying treatment efficacy. Years of high-throughput “omics” research have resulted in multiple potential biomarkers for PsV and other inflammatory skin diseases, yet most of them are universal for inflammation and no single marker has shown to be robustly specific to a given disease (14).
The approach of using multiple biomarkers in combination has proven to be more robust and accurate than the standalone measurements of individual biomarkers in the context of several human diseases (15–17). With the advancement of computational methods, multicomponent biomarkers offer a solution to overcome interindividual variability in the biomarker-based diagnostics of complex heterogeneous diseases (18–20). As such, we hypothesized that using a set of biomarkers in combination as a multicomponent biomarker would allow PsV to be distinguished from other inflammatory skin diseases more accurately than any of the individual markers independently. Coupling this with a low-cost gene expression quantification method, such as quantitative real-time PCR (qPCR) could result in a clinically viable tool for the diagnosis of PsV.
Patients and sample collection
Twenty patients with psoriasis vulgaris (PsV) and 18 with atopic dermatitis (AD) were recruited from the Dermatology Clinic of Tartu University Hospital. The Ethics Review Committee on Human Research of the University of Tartu approved the protocols and informed consent forms used in this study. All participants signed an informed consent form. Detailed characteristics of recruited patients are shown in Appendix S1. All skin samples were obtained with 4-mm punch biopsy. The biopsy specimens were instantly frozen on dry ice and stored at –80°C (for up to 3 months) until RNA extraction.
Public datasets included in the analysis
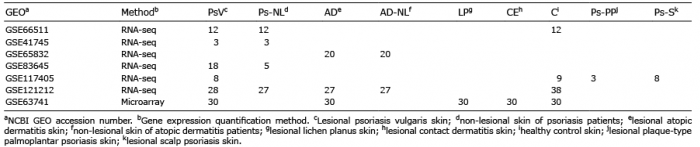
The NCBI GEO (https://www.ncbi.nlm.nih.gov/geo) datasets included in the analysis are summarized in Table I. The core datasets used for testing the disease-specific multicomponent biomarker approach were the microarray dataset GSE63741 and RNA-seq dataset GSE121212, as these included several other inflammatory skin diseases in addition to PsV. Additional 5 RNA-seq datasets were included in the test set in order to incorporate more of different PsV patient groups and additional skin conditions, such as atopic dermatitis (AD), non-lesional skin samples of AD patients (AD-NL) and non-lesional psoriatic skin (Ps-NL) samples. No datasets including other inflammatory skin diseases (e.g. lichen planus or contact eczema) were found among the RNA-seq datasets listed in the NCBI GEO repository.
Table I. Datasets comprising the test set and corresponding number of samples
Quantitative PCR analysis
Quantitative real-time PCR (qPCR) was used to quantify the expression levels of marker genes in 2 groups of locally recruited patients. Skin samples from the first group were collected as a part of a previous study (21) and consisted of 12 paired PsV and Ps-NL skin samples from the same patients and 12 samples from healthy controls (C). This dataset is hereinafter referred to as “qPCR dataset 1”. The same samples also constitute the GSE66511 RNA-seq dataset. The second group consisted of 20 patients with PsV and 18 patients with AD. Gene expression data of these patients are hereinafter referred to as “qPCR dataset 2”. The qPCR experiments were conducted following MIQE guidelines (22). Detailed description of the methods are shown in Appendix S1.
RNA-seq data analysis
All base-space datasets were aligned to the hg38 reference genome using STAR v2.6 (23). Aligned reads were quantified according to GENCODE (24) release 26 with the “–quantMode GeneCounts” option of STAR. Non-default options used for read alignment are shown in Appendix S1. The colour-space SOLiD (Life Technologies Ltd) reads of the GSE66511 dataset were mapped to the hg19 reference genome and exon-exon junctions using LifeScope software (Life Technologies Ltd) mapping module with recommended settings. Mapping quality cut-off was set at 10 (MAPQ ≥10). Aligned reads were quantified according to UCSC (25) RefGene annotations for hg19 using LifeScope software.
Classification models and data visualization
RNA-seq expression data was analysed and visualized as log transformed (base 10) or standardized (z-score) Reads Per Kilobase of transcript per Million mapped reads (RPKM) values. Gene expression values from qPCR were analysed and visualized as –ΔΔCq values. Microarray gene expression data were analysed and visualized as Cy5/Cy3 intensity ratios. All gene expression values were standardized prior to being used in the support vector machine (SVM) models. In order to use the different gene expression measures interchangeably in a single model, a novel method was developed to transform the expression values of into new features. In brief, the expression values of the marker genes (e.g., IL36G, CCL27, NOS2 and C10orf99) as RPKM values, –ΔΔCq values or Cy5/Cy3 intensity ratios were transformed into polynomial equation coefficients followed by z-score standardization. This method is limited to be used with a small number of genes. The transformation method is explained in detail in Appendix S1.
SVM models were implemented using the e1071 package (26) in R. Gamma and cost parameters were determined by the tune.svm() function using values of 2X, where x was an integer in the range [–15, 3] for gamma and [–5, 15] for cost parameters. Linear (1 feature) or sigmoid (more than 1 feature) kernels were used in the SVM models. Leave-one-out method was used for cross-validation (LOOCV) of the trained models. ROCR package (27) was used to plot receiver operating characteristic (ROC) curves and calculate the area under the curve (AUC).
Feature selection was conducted using the Recursive Feature Elimination (RFE) method from the caret package (28) in order to determine the best 4-gene sets for PsV classification. RFE was implemented using the predefined Random Forest function with 10-fold cross-validation. RFE was conducted separately on the GSE63741 and GSE121212 datasets and was limited to the genes present in both (n = 1,419).
ggplot2 package (29) or R base graphics (30) were used for data visualization. Principal components were calculated using prcomp() function from the Stats package (30). Spearman’s correlation coefficients were calculated to assess correlations between gene expression levels and patient characteristics for the PsV samples from both qPCR datasets and AD samples from the qPCR dataset 2.
Experimental design
Literature review for identification of proposed biomarkers. A review of published studies was conducted to identify potential biomarkers for PsV. The search was performed using the PubMed search engine (https://www.ncbi.nlm.nih.gov/pubmed) and the keyword “psoriasis biomarker”. All review and research articles published in the years 2012 to 2017 were reviewed, including relevant research articles cited by the review articles. The full list of reviewed publications is shown in Table SI.
Validation of selected biomarker candidates. The selected gene expression-based biomarker candidates were validated in 2 steps. First, the differential expression of the marker genes was confirmed in RNA-seq dataset (GSE66511) of locally recruited patients and healthy controls followed by additional quantification by qPCR. Secondly, the disease-specificity of the selected markers was assessed using the GSE63741 and GSE121212 datasets and additionally recruited 20 patients with PsV and 18 patients with AD.
Classification model construction and testing. Five additional public datasets were included and classification models trained on qPCR data of locally recruited patients were validated on a total of 7 public datasets comprised of different patient groups. As an alternative data-driven biomarker selection approach, the GSE63741 and GSE121212 datasets were used to select 4-gene combinations that best differentiate PsV from other samples. Similarly, these multicomponent biomarkers were then validated on the full test set.
A graphical overview of the study design is presented in Fig. S1; Appendix S2).
Biomarker candidates from the literature
From the review of published studies reporting biomarkers of PsV, it became evident that the expression levels of specific genes in the lesional skin hold the most promise for disease-specific biomarkers. In contrast, circulatory biomarkers seem to reflect more general inflammatory processes (14). As a result, 5 genes (IL36G, NOS2, CCL27, C10orf99 and IGFL1) with altered expression levels in PsV lesions, which had previously been proposed as biomarkers of PsV by 3 independent studies, were selected to form the multicomponent biomarker (Table SII, Appendix S2).
Confirmation of differential expression of the selected genes
The differential expression of the selected genes was confirmed in a previously published RNA-seq dataset (GSE66511) of 12 paired PsV skin samples and non-lesional skin samples from the same patients and 12 healthy controls. Despite the minor overlap of expression levels in PsV and Ps-NL or C samples in case of IGFL1, NOS2 and CCL27, the differences in expression of the genes, as previously described, were apparent. Expression levels of the marker genes were further quantified by qPCR. The combined expression pattern of the 5 genes clearly distinguished PsV samples from Ps-NL and C skin samples (Fig. S2; Appendix S2).
Disease-specificity of the selected genes and classification models
The disease-specificity of the selected biomarker genes and the classification models based on them were first assessed independently on the GSE63741, GSE121212, and combined qPCR datasets. It should be noted that the probes for one of the selected marker genes (IGFL1) were not included on the microarrays used to create the GSE63741 dataset and this was a limiting factor to the analysis.
The GSE63741 dataset is characterized by significantly higher IL36G expression levels in PsV samples compared with other inflammatory skin diseases and control samples (Fig. 1a), making it a near perfect biomarker for PsV, as reported by D’Erme and colleagues (31). None of the 3 other biomarker genes displayed comparable disease-specific qualities in this dataset, as C10orf99 was upregulated in all the inflammatory skin diseases, CCL27 was downregulated in both PsV and LP samples, and NOS2 displayed only minor upregulation in all skin disease samples compared with controls. Leave-one-out cross-validation (LOOCV) of a SVM classification model based on IL36G expression yielded perfect accuracy (AUC=1) for this dataset. The NOS2 and CCL27 combination proposed by Quaranta and colleagues (5) resulted in a relatively poor classification model (AUC=0.84) in this case. A model based on all 4 genes performed with LOOCV accuracy comparable to IL36G-based classification (Fig. S3a–c; Appendix S2).
Fig. 1. Overview of marker gene expression levels in the GSE63741, GSE121212 and qPCR datasets. (a) Expression levels as Cy5/Cy3 intensity value ratios of the 4 out of 5 biomarker genes across 30 psoriasis (Ps), 30 atopic dermatitis (AD), 30 contact eczema (CE), 30 lichen planus (LP) and 30 healthy control (C) skin samples in the GSE63741 dataset. The expression levels of IGFL1 were absent from this dataset. (b) Expression levels as –ddCq (ΔΔCq, quantitation cycle of the target gene adjusted for quantitation cycles of reference genes and calibration sample) values of the 5 marker genes for 32 psoriasis vulgaris (PsV_1 and PsV_2), 18 AD, 12 non-lesional psoriasis (Ps-NL) and 12 C skin samples in the qPCR datasets. (c) Expression levels as log10 of RPKM (Reads Per Kilobase of transcript per Million mapped reads) values of the 5 marker genes for 28 PsV, 27 Ps-NL, 27 AD and 38 C skin samples in the GSE121212 dataset. The first 2 principal components of the 4 (or 5) gene expression values in the (d) GSE63741, (e) qPCR, and (f) GSE121212 datasets. Error bars represent 95% confidence intervals.
Interestingly, in the combined qPCR datasets with 2 independent PsV groups, IL36G expression levels alone did not allow as accurate classification of PsV samples (AUC=0.95) due to the overlap of expression levels in the PsV and the AD groups (Fig. 1b). In the confines of this dataset, a SVM classification model based on NOS2 and CCL27 outperformed classification based on only IL36G. Classification accuracy further improved slightly with the 4-gene (excluding IGFL1) and 5-gene models. Similarly, the 4-gene and 5-gene models displayed better results compared with the IL36G or NOS2 and CCL27-based models for the GSE121212 dataset due to overlapping expression levels in the different groups of samples (Fig. 1c and Fig. S3d–k; Appendix S2).
The recurrent theme in the comparison of the 3 datasets was the consistent accuracy of sample classification by the 4-gene model (and the 5-gene model, where applicable), as the combined expression profile of these genes better survived the effect of inter-dataset variability (Fig. 1d–f). Therefore, the 4-gene model based on the expression levels of L36G, CCL27, NOS2 and C10orf99 with high LOOCV accuracies ( 95%) in all 3 independent datasets was selected as the preferred disease-specific classification model for PsV (Fig. S4; Appendix S2).
In addition, the correlations between the marker genes and patient characteristics in the qPCR datasets were assessed, but no statistically significant (p ≤ 0.05) correlations were observed between the expression levels of the marker genes and disease severity in either the PsV or the AD group (Table SIII, Appendix S2).
Test set assembly and transformation of gene expression values
A test set comprised of 7 public datasets (Table I) totalling 504 samples was assembled to fully test the performance of the 4-gene classification model. Gene expression values in these datasets were transformed into new features to correct for the differences in values obtained by different gene expression quantification methods (RNA-seq, microarray, and qPCR). The transformation of expression values of the 4 marker genes (IL36G, CCL27, NOS2 and C10orf99) into polynomial equation coefficients followed by z-score standardization rescaled the RPKM values, Cy5/Cy3 intensity ratios, and –ΔΔCq values, while retaining the overall expression profiles (Fig. 2 and Figs S5–8; Appendix S2). This enabled the interchangeable use of different gene expression values in a single model. Transformation into polynomial equation coefficients prior to z-score standardization was essential to rescaling the data and maintaining the expression pattern in the form of new features, and outperformed simple z-score standardization without transformation (Fig. S9; Appendix S2).
Fig. 2. Expression values of initial marker genes transformed to new features. (a) Untransformed expression values for the 4 marker genes as Reads Per Kilobase of transcript per Million mapped reads (RPKM) values for RNA-seq datasets (GSE117405, GSE121212, GSE41745, GSE65832, GSE66511, and GSE83645), Cy5/Cy3 intensity value ratios for the GSE63741 microarray dataset or –ΔΔCq values (quantitation cycle of the target gene adjusted for quantitation cycles of reference genes and calibration sample) for qPCR datasets. Samples are coloured on the graphs as lesional psoriasis vulgaris skin samples (PsV: red) or other samples (Ot: blue). The latter consists of non-lesional skin samples of psoriasis vulgaris patients, atopic dermatitis, non-lesional atopic dermatitis, contact eczema, lichen planus and healthy control skin samples. (b) Expression values for the 4 marker genes transformed into new features intercept, x, x2 and x3 as in y=β0 + β1 x + β2 x2 + β3 x3 + ε1. The polynomial line equation was obtained by coding the 4 marker genes as integers and using a linear model to fit a degree 3 polynomial line to connect expression values along the x-axis. The new features were further standardized as z-scores, where standard deviation (SD) and mean were calculated separately for each gene and expression quantification method group (RNA-seq, microarray or qPCR) successfully rescaling the gene expression values obtained by different quantification methods.
Model testing
A new 4-gene model was trained on the transformed qPCR data with a LOOCV accuracy of 95.9%, comparable to the model trained on untransformed data (Fig. S10; Appendix S2). Three PsV samples produced false-negative predictions during LOOCV. In these samples, the expression levels of IL36G and NOS2 were considerably lower than the majority of the PsV samples (Fig. S11; Appendix S2).
The model was then tested on an assembled set of 493 samples, labelled PsV or Ot (other). The accuracy of model predictions on the validation set was 96.4%, with 6 false-negative and 9 false-positive calls, with PsV as the positive outcome (Fig. 3). Falsely predicted samples in both the training and test set differentiate from their respective groups based on their gene expression profiles (Fig. S12; Appendix S2) and are listed in Table SIV; Appendix S2. Classifiers based solely on IL36G expression levels or the combination of NOS2 and CCL27 genes, resulted in respective prediction accuracies of 94.7% and 74.7% on the test set (Fig. S13; Appendix S2).
Fig. 3. Support vector machine (SVM) classification model performance on transformed test set. (a) Predictions of the SVM classification model trained on transformed qPCR datasets and tested on 6 transformed RNA-seq and 1 transformed microarray datasets of 99 psoriasis vulgaris (PsV), 47 non-lesional psoriasis (Ps-NL), 77 atopic dermatitis (AD), 47 non-lesional atopic dermatitis (AD-NL), 30 lichen planus (LP), 30 contact eczema (CE), and 88 C skin samples. The predictions on scalp psoriasis (Ps-S) and palmoplantar psoriasis (Ps-PP) samples were not included in the calculations of different model performance metrics. (b) Receiver operating characteristic (ROC) plot and corresponding area under the curve (AUC) value based on the prediction scores obtained from testing the model trained on qPCR data on the assembled test set.
The SVM model was also used to classify 8 scalp psoriasis (Ps-S) and 3 plaque-type palmoplantar psoriasis (Ps-PP) samples from the GSE117405 dataset. Seven Ps-S samples were classified as PsV and all of the Ps-PP were classified as Ot. Ps-PP samples displayed NOS2 expression levels comparable to the expression levels of healthy control samples from the same dataset, leading the model not to recognize them as PsV (Fig. S14; Appendix S2).
Data-driven alternative to biomarker candidate selection
In addition to the set of marker genes selected based on the results of previously published studies, a data-driven biomarker selection was conducted using the GSE63741 and GSE121212 datasets. The RFE method was used to select the best 4-gene combinations differentiating PsV samples in both datasets. Inherent to the GSE63741 dataset, IL36G proved to be the best PsV-specific biomarker and including the 3 next best genes, CRABP2, S100A7A, and IL36RN, marginally increased resulting prediction errors (Fig. S15a; Appendix S2). In case of the GSE121212 dataset, prediction errors decreased with each added marker gene (Fig. S15b; Appendix S2). The top 4 predictors of PsV based on the GSE121212 dataset were SPRR2A, PRELP, ARG1 and KYNU. The expression levels of these 8 genes were mostly consistent between the 2 datasets, with the exception of PRELP, which was downregulated in PsV compared with AD samples in the GSE121212, but not in the GSE63741 dataset (Fig. 4 a–b).
Validated on their respective source datasets, the LOOCV accuracies of the SVM classification models based on these multicomponent biomarkers were 98.7% and 95.9% for the GSE63741 and GSE121212 gene set, respectively (Fig. 4c–d). The accuracy of the classification model trained on the GSE63741 set and tested on GSE121212 was 95.9%. The accuracy of the model trained and tested vice versa was 90.0% (Fig. 4e–f). When tested on the full transformed test set, the performances of both SVM models were inferior to the initial multicomponent biomarker (IL36G, CCL27, NOS2 and C10orf99) with accuracies of 88.8% and 88.6% for the GSE63741-derived gene set and the GSE121212-derived gene set, respectively (Fig. S16; Appendix S2). The previously described method of data transformation was applied to construct the test set for these models (Figs S17–20; Appendix S2).
Fig. 4. Overview of expression levels of the genes selected by the data-driven approach in the GSE63741 and GSE121212 datasets. (a) Expression levels as Cy5/Cy3 intensity value ratios of the 8 biomarker genes across 30 psoriasis (Ps), 30 atopic dermatitis (AD), 30 contact eczema (CE), 30 lichen planus (LP) and 30 healthy control (C) skin samples in the GSE63741 dataset. (b) Expression levels as log10 of RPKM (Reads Per Kilobase of transcript per Million mapped reads) values of the 8 marker genes for 28 PsV, 27 Ps-NL, 27 AD and 38 C skin samples in the GSE121212 dataset. The genes that are not marked by an asterisk were selected based on Recursive Feature Elimination (RFE) on the GSE63741 dataset and the genes that are marked by an asterisk were selected as the result of (RFE) on the GSE121212 dataset. Error bars represent 95% confidence intervals. (c) Results of leave-one-out cross-validation (LOOCV) of the classification model based on the GSE63741-derived gene set and (d) results of LOOCV of the GSE121212-derived gene set model. (e) Results of testing the classification model based on the GSE63741-derived gene set on the GSE121212 dataset and (f) results of testing of the GSE121212-derived gene set model on the GSE63741 dataset
Several gene expression-based biomarkers for PsV have been proposed, but none of them have been completely discriminatory for PsV or confirmed in multiple patient cohorts. In the present study, it was hypothesized that using a classification model based on several potential biomarkers proposed by separate studies with independent patient cohorts would ensure improved results in the biomarker-based diagnosis of a heterogeneous disease, such as PsV. As such, the aim of this study was to present a proof of concept classification model capable of more accurate classification of PsV samples across different patient groups than any of the marker genes individually. A SVM classification model was trained based on the expression levels of 4 genes (IL36G, CCL27, NOS2 and C10orf99) in the lesional skin tissue using 2 independent sets of samples from locally recruited patients. The model was validated on 7 different public datasets, resulting in a 96.4% accuracy of distinguishing PsV from other inflammatory skin diseases. This multicomponent biomarker combination outperformed classification based on single marker genes and other gene sets, which were more affected by the variability of gene expression profiles between different datasets and patient groups.
This study was limited by the availability of (gene expression) data from large patient cohorts and the inter-dataset variability inherent to the available datasets. Conventional application of machine learning methods implies large datasets, the absence of which can lead to limited accuracy and high possibility of overfitted models trained on small datasets (32–34). Public gene expression datasets of inflammatory skin diseases other than psoriasis are scarce and recruiting a large number of patients with different inflammatory skin diseases for a conventional machine learning application would be an extensively laborious task. Therefore, in this study, support vector machine (SVM) classification models were used in an unconventional setting with emphasis on training and testing the model on data from different groups of patients.
Defining the best possible combination of biomarkers for PsV diagnostics is heavily dependent on the available datasets and the possibility to integrate them. The avail-ability of 2 larger datasets (GSE63741 and GSE121212) and the novel method developed as a part of this study to normalize different gene expression measures allowed the possibility to pursue this direction. RFE was used to find combinations of genes best differentiating PsV from other samples, similarly to the study by Guo et al. (35), but with the exception of including other inflammatory skin disease samples as well. Although this analysis was limited to the genes present in the GSE63741 microarray dataset, it did provide data-driven alternatives to the hypothesis-based selection of the genes making up the multicomponent biomarker.
Perhaps the most important observation in this study was that the expression profiles of individual marker genes were notably variable across different datasets. In the GSE63741 dataset, the expression levels of IL36G were uniformly different in PsV compared with AD skin samples, but displayed an overlap of expression values in the qPCR and GSE121212 datasets. Interestingly, in case of the 3 outlying PsV samples in the qPCR dataset in terms of lower IL36G expression levels, the lesions of these patients exhibited hallmark signs of PsV and were in the process of acute exacerbation during the time of sampling. Similarly, the expression levels of NOS2 and CCL27, a gene pair that has previously been used to differentiate PsV from eczema samples (5), were surprisingly variable across the datasets included in this study and did not result in highly accurate predictions when used in a SVM classification model. For example, in the GSE63741 dataset, NOS2 displayed comparable expression levels in PsV, AD, and CE samples and CCL27 was downregulated in both PsV and LP samples. Conversely, in the confines of the qPCR datasets, expression levels of NOS2 and CCL27 in the PsV samples compared with AD samples were in line with the result reported by Quaranta and colleagues (5). From amongst the genes selected based on RFE, PRLEP was downregulated in PsV samples in the GSE121212 and GSE66511 datasets and improved the classification accuracy, while in the GSE63741 and GSE83645 datasets this was not the case.
Many factors could potentially lead to considerable differences between individual datasets (groups of patients), e.g. differences in patient characteristics, disease severity, cellular composition of the skin biopsy (36), genetic background (37, 38), non-representative sample sizes, or the effects introduced by the use of different expression quantification methods. Nevertheless, it was apparent throughout the 3 independent datasets used for LOOCV that the 4-gene (IL36G, CCL27, NOS2 and C10orf99) multicomponent biomarker retained its accuracy, while individual genes displayed inconsistent expression levels. The combined expression profile of the genes making up the multicomponent biomarker was less affected by differences between datasets (groups of patients) compared with individual genes, demonstrating that the former to be a more consistent biomarker.
The performances of all constructed classification models were tested on the assembled set of 493 samples, which consisted of several inflammatory skin disease samples in addition to PsV and control samples (Table I). As this was an imbalanced dataset, with 99 of the 493 being PsV samples, the combined measure of precision and recall, the F1 score, is best suited to compare the different models (39). The 4-gene (IL36G, CCL27, NOS2 and C10orf99) model yielded F1 score of 0.925 (96.4% accuracy) and the next-best model based only on IL36G resulted in a F1 score of 0.880. Classification based on IL36G yielded a recall value of 0.818 compared with the 0.939 of the 4-gene model, resulting in a less sensitive, yet slightly more precise model. Due to the inter-dataset variation of NOS2 and CCL27 expression levels, classification based on these genes was poorer, with a F1 score of 0.597, falling short of the level of performance reported by Quaranta and colleagues. The performance of this classifier was heavily affected by the expression levels of NOS2 in the GSE63741 dataset. The RFE on GSE63741 and GSE121212 datasets yielded models with respective F1 scores of 0.732 and 0.780. Therefore, the data-driven selection of marker genes for the multicomponent model did not result in a better combination of genes than the initial hypothesis-based selection.
In conclusion, combining multiple gene expression markers as a multicomponent biomarker allowed the distinction of PsV from other inflammatory skin diseases more accurately than any of the markers individually. This approach could potentially be further expanded to differentiate between disease subtypes (40), improve distinction in cases of overlap of different inflammatory skin disorders, and to more accurately monitor the efficacy of treatments. However, the need for validation in larger groups of patients remains. Coupled with a cost-effective gene expression quantification technique, this approach has the potential to fill the void of clinically applicable biomarkers for PsV and other inflammatory skin diseases.
This work was supported by the European Union’s Horizon 2020 research and innovation programme under grant agreement No 668989, by the personal research Grant PUT1465 (from the Estonian Research Council), by institutional research funding IUT20-46 (from the Estonian Ministry of Education and Research), and European Regional Development Fund.
Datasets related to this article (Table I) can be found in the NCBI GEO repository (https://www.ncbi.nlm.nih.gov/geo/).
The authors have no conflicts of interest to declare.


 Click to show fullsize
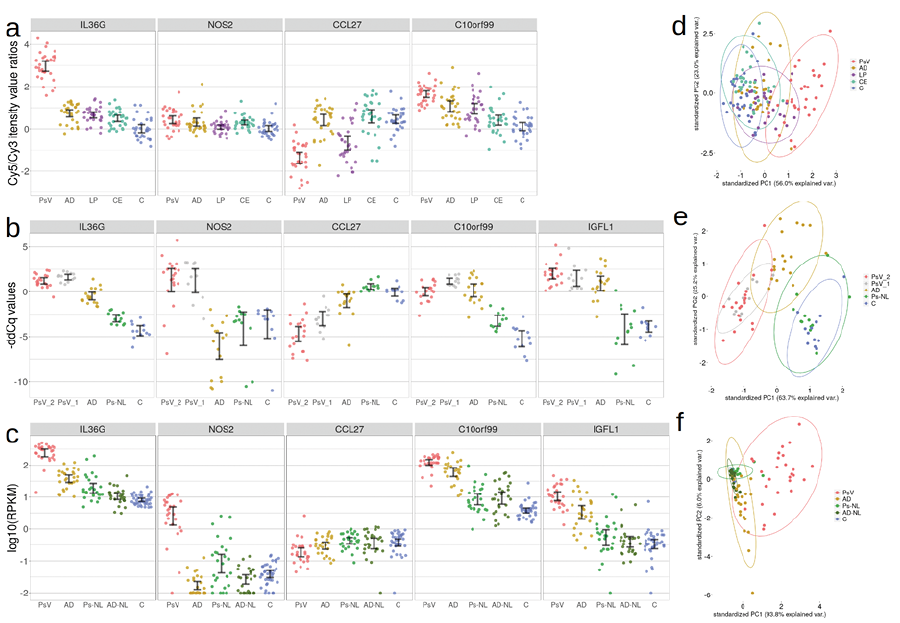 Click to show fullsize
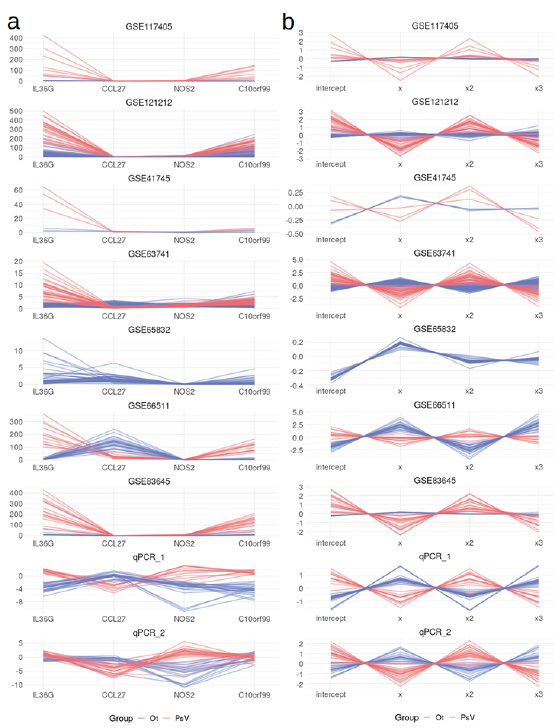 Click to show fullsize
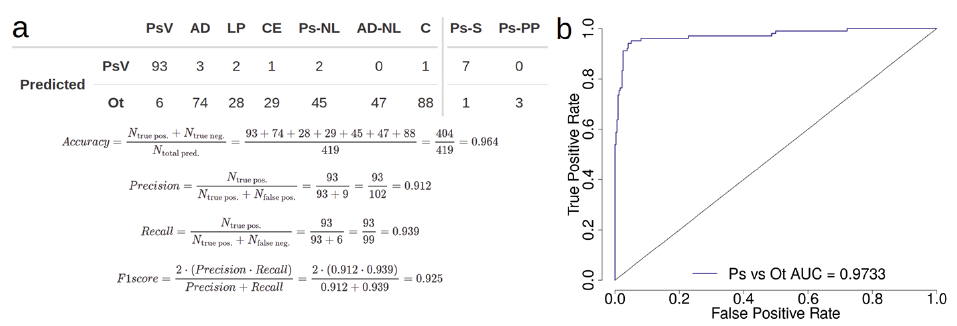 Click to show fullsize
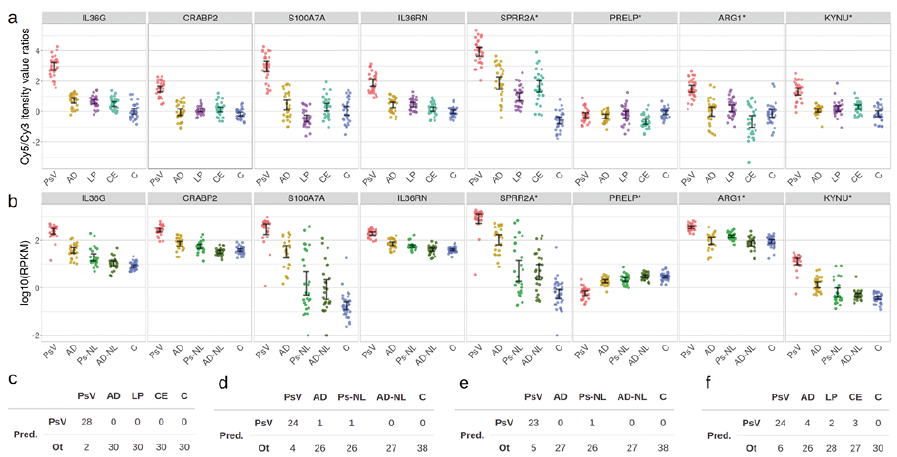 Click to show fullsize