MORTALITY AFTER SPINAL CORD INJURY IN NORWAY
Ingeborg Beate Lidal, MD1, Hildegun Snekkevik, MD2, Geir Aamodt, PhD3, Nils Hjeltnes, MD, PhD1, Johan Kvalvik Stanghelle, MD, PhD1, and Fin Biering-Sørensen, MD, PhD4
From the 1Sunnaas Rehabilitation Hospital, Faculty Division Ullevaal University Hospital, University of Oslo, Nesoddtangen, 2NIMI, Oslo, 3Akershus University Hospital, Nordbyhagen, Norway, and 4Clinic for Spinal Cord Injuries, Neuroscience Centre, Rigshospitalet, Copenhagen University Hospital, Copenhagen, Denmark
OBJECTIVES: To study mortality, cause of death and risk indicators for death in Norwegian patients with spinal cord injury.
DESIGN: A cross-sectional study with retrospective data.
SUBJECTS: All patients (n=387) with traumatic spinal cord injury admitted to Sunnaas Rehabilitation Hospital, Norway, during the period 1961–82.
METHODS: Medical records were reviewed retrospectively. Causes of death were collected from Statistics Norway and death certificates. Standardized mortality ratios (SMRs) were calculated for the entire sample and for causes of death. To explore risk indicators for death, a Cox regression model was used.
RESULTS: During the observation period, 1961–2002, 142 patients died. The main causes of death were pneumonia/influenza (16%), ischaemic heart diseases (13%) and urogenital diseases (13%). SMR was 1.8 for men and 4.9 for women. Cause-specific SMRs were markedly elevated for urogenital diseases, suicide, pneumonia/influenza, urogenital cancer, and diseases of the digestive system. Risk indicators for death were: higher age at injury, tetraplegia, functionally complete spinal cord injury, pre-injury cardiovascular disease, alcohol or substance abuse and psychiatric diagnosis.
CONCLUSION: The SMRs show that life expectancy is reduced in chronic spinal cord injury in Norway, more for women than for men. Cause-specific SMRs and risk indicators suggest that the high mortality rates after spinal cord injury to a certain degree are related to preventable aetiologies. To maximize longevity in chronic spinal cord injury, more attention must be paid to co-morbidity.
Key words: spinal cord injury, mortality, causes of death, epidemiology, risk indicators.
J Rehabil Med 2007; 39: 145–151
Correspondence address: Ingeborg Beate Lidal, Sunnaas Rehabilitation Hospital, Faculty Division Ullevaal University Hospital, University of Oslo, pb 1130 Blindern, NO-0318 Oslo, and Department of Research, Sunnaas Rehabilitation Hospital, NO-1450 Nesoddtangen, Norway. E-mail: ingeborg.lidal@sunnaas.no
Submitted April 24, 2006; accepted October 11, 2006.
INTRODUCTION
Causes of death in spinal cord injury (SCI) have changed, from being primarily urinary tract disease (1–5) to, increasingly, cardiovascular disease (CVD) (mainly ischaemic heart disease) (1, 3, 6–10) and respiratory complications (1, 3, 6–8, 10–14), thus becoming similar to the causes of death in the general population. Improved early medical care, specialized rehabilitation and regular follow-up visits have contributed to this development. However, the longevity of persons with SCI still remains below that of the general population (1, 2, 4–9, 15–19). Several analyses on mortality have found that important risk indicators for death in this group include the neurological level of injury (1–3, 7, 12, 15–17, 19–21), completeness of the SCI (1–4, 7, 15, 17, 19–22), older age at injury (1–3, 9, 12, 15–17, 19–21) and the risk of death is highest during the first year(s) post-injury (1, 15–17, 19).
There is a lack of previous studies on mortality of SCI in Norway. However, the social welfare system, covering all people in society, makes it possible to perform such studies. The aims of the present study were to compare survival in persons with SCI with survival in the general population, causes of death, and to explore predictors of eventual early death in SCI.
METHODS
Material
A total of 396 persons with traumatic SCI were admitted to Sunnaas Rehabilitation Hospital between 1961 and 1982 inclusive. According to the annual incidence of traumatic SCI in Norway, the sample represents approximately 25–30% of all new cases of SCI from this period. The patient selection to Sunnaas was not 100% from specific areas of Norway in any year. The main proportion of persons enrolled, were resident in eastern or southern areas of Norway (i.e. 68% of the total sample). However, patients from all areas of the country are represented.
Four patients who died within one year post-injury were excluded. One patient was omitted due to lack of vital data, and another 4 patients could not be identified. The remaining 387 persons (321 men and 66 women) survived at least one year following injury and were included in this retrospective study. All subjects were at least 20 years post-injury when the study was performed. Dates of death were registered until 31 December 2002.
Data collection
Information on the vital status of the observed population was obtained from The Central Population Register of Norway. This register contains vital data for all Norwegian citizens, including date of birth, residence and date of death. A personal 11-digit number makes it possible to identify any Norwegian citizen. The survival status of 8 persons who emigrated from Norway could not be determined. These subjects were censored at their last known date alive. Vital data for the general population from the study period was obtained from Statistics Norway.
The “underlying cause of death” is used in the international cause of death statistics. To determine the causes of death we collected information from 2 sources: (i) the Cause of Death Register, Statistics Norway; (ii) death certificates. Information on the underlying cause of death used in the Cause of Death Register is based primarily on medical death certificates (23, 24). The underlying cause of death gives more prominence to the external cause of the injury-producing event (19), i.e. in many cases the injuries that caused the SCIs, rather than to the direct/immediate causes of death. For this reason, we decided to recode the cases where the injury that caused the SCI was listed as the underlying cause of death. In these situations, we extracted information from the death certificates as follows: We coded the next cause listed in the death certificate as the underlying cause of death, instead of the original cause noted in the Cause of Death Register. Only in the cases of new accidents, i.e. new events subsequent to the SCI, were “Unintentional injuries” (ICD-9 E800–E949) recorded as the underlying cause of death. In addition, the underlying causes of death in Norwegian men and women through the years 1961 to 2002 inclusive were obtained from the Cause of Death Register (23, 25, 26). ICD-9 (International Classification of Diseases – 9th Edition Clinical Modification) was used to classify diseases causing death. Deaths classified according to ICD-7, ICD-8 and ICD-10 revisions were translated to ICD-9.
Information extracted from each patients’ medical record included demographic data, occupational status, prevalence of pre-injury medical conditions, date of admission and discharge from the rehabilitation hospital, injury-related data including associated injuries caused by the accident, neurological level of injury (grouped into tetraplegia, i.e. cervical spinal cord lesions, or paraplegia, i.e. thoracic and lumbar-sacral lesions), Frankel classification (merged into 2 groups, i.e. Frankel A–C and D–E) (27) and post-injury secondary medical complications. Occupational classification was determined by a modified version of the Erikson Goldthorpe Portocarero social class scheme (28, 29) and included 10 categories. Retired persons were classified according to their former occupation. Persons younger than 16 years were excluded from analysis that included occupational classification. Pre-injury medical diseases were categorized into 6 groups according to the most frequent diagnoses.
The material was dichotomized into 2 incidence groups according to the time of injury, i.e. 1961–75 or 1976–82. This was done because the SCI-rehabilitation gradually became organized as a specialized unit with multidisciplinary teams from the early to mid-1970s.
The study was approved by The Regional Ethics Committee, Oslo, Norway.
Statistical analysis
Descriptive statistics were generated, including medians, percentages and frequencies in order to emphasize the actual numbers. The t-test and the Mann-Whitney U test were performed where appropriate. χ2 methods were applied to compare categorical variables. Standardized mortality ratios (SMRs) were computed for gender, tetraplegia/paraplegia and 2 incidence periods (1961–75 and 1976–82). SMR is the actual mortality in the observed population divided by the expected mortality in the general population occurring during the specified time interval of the study. If the SMR exceeds 1.0, the mortality rate in the study population was larger than expected. An estimated SMR of 2.0 indicates that twice as many deaths occurred in the study population. Accordingly, SMRs for selected causes of death were calculated. The expected numbers of deaths were estimated using age-gender-specific rates for the selected diagnoses.
Risk indicators and relative risk estimates associated with death were estimated by means of a Cox regression model. First, the relationship between each potential explanatory variable and the outcome variable of interest, i.e. the time interval from entry into the study (at the time of injury) until death or point censored, was examined. A criterion level of p<0.25 for inclusion in the final model was chosen. Next, a forward selection procedure was used to fit the adjusted model (30).
Kaplan–Meier curves were used to visualize survival by age at death or censoring of the studied SCI population compared with the general population. Further, Kaplan–Meier curves were used to show time from injury until death or censoring for patients injured in the periods 1961–75 (n=198) and 1976–82 (n=189). A log-rank test was carried out to compare survival between the 2 incidence periods, and included all subjects. The algorithms in Statistical Packages for the Social Sciences (SPSS) version 11.5 were used in all calculations. p-values less than 0.05 were considered statistically significant.
RESULTS
Population
Table I presents the study population (n=387) divided into tetraplegia and paraplegia, respectively. Persons with tetraplegia were significantly older at injury and included more men. A higher proportion of functionally incomplete SCI appeared among persons with tetraplegia compared with persons with lower lesions. The aetiology was transport accidents in 46% of all cases, most frequently traffic injuries. Fall accidents and assaults were more common in persons with paraplegia, while sports accidents were seen more often in persons with tetraplegia. Frequent associated injuries were traumas of the head (25% of the total sample) and other bone fractures (23% of the total sample). The predominating secondary medical complications during initial rehabilitation were pressure ulcers (21% of the total sample), urinary tract complications, such as severe infections and calculi (21% of the total sample), and troublesome spasticity (14% of the total sample). Twenty-four patients were included more than one year after injury. The observation period from injury until 31 December 2002 was median 27 years (range 20–39 years). Comparisons of persons injured during the period 1961–75 (n=198) vs those injured during the period 1976–82 (n=189) were made, but no significant differences were observed. The subjects injured prior to 1976 represented a smaller proportion (i.e. approximately 20%) of the total number of new SCIs in the period 1961–75 than the studied persons injured in the period 1976–82 (i.e. approximately 40% of the total number of new cases injured in the period 1976–82).
| Table I. Characteristics of all patients with traumatic spinal cord injury (SCI) included in the study, divided by the neurological level of lesion (tetraplegia/paraplegia) | |||
| Category | Tetraplegia n=182 % | Paraplegia n=205 % | Total n=387 % |
| Men/women | 88/12 | 78/22* | 83/17 |
| Age at injury (median years) (range) | 31.4 (11–77) | 25.3** (3–82) | 27.9 (3–82) |
| Cause of injury | |||
| Sports | 18 | 5** | 11 |
| Assaults | 1 | 6 | 4 |
| Transport | 47 | 45 | 46 |
| Fall | 28 | 36* | 32 |
| Others | 6 | 8 | 7 |
| Unknown | 1 | 1 | 1 |
| Working accident | 19 | 19 | 19 |
| Frankel classification | |||
| A | 40 | 53* | 47 |
| B | 8 | 4 | 6 |
| C | 8 | 17* | 13 |
| D | 41 | 24** | 32 |
| E | 2 | 2 | 2 |
| Complications during initial rehabilitation | 62 | 55 | 58 |
| Associated injuries | 42 | 61** | 52 |
| Prevalence of chronic medical conditions and/or traumas prior to SCIa | 23 | 17 | 20 |
| History of pre-injury alcohol or substance abuse | 5 | 6 | 6 |
| aAll chronic conditions or severe traumas noted in each patient’s medical journal, are included. Differences between tetraplegia and paraplegia: *p<0.05; **p<0.001. | |||
Deceased
During the observation period 121 men and 21 women of the 387 patients had died. Table II presents the study population divided by persons who died and persons who survived until 31 December 2002. As expected, age at injury was higher in the deceased compared with the survivors. The deceased were more often injured in fall accidents, but transport or sports accidents were more frequent among the survivors. The group of persons who died comprised a higher proportion of persons with cervical level of injury and the neurological impairment was more commonly classified as Frankel D–E compared with the survivors. Regarding patients with tetraplegia, Frankel D, 62% of these subjects had no bony injury. Analysis within the deceased showed no differences between persons with cervical SCI and those with lower lesions, nor between the patients injured in the first incidence period (n=76) vs those injured during the later one (n=66).
| Table II. Characteristics of persons with traumatic spinal cord injury (SCI) included in the study compared by survivors and deceased | ||
| Category | Survivors n=245 % | Deceased n=142 % |
| Men/women | 82/18 | 85/15 |
| Age at injury (median years) (range) | 21.6 (3–58) | 52.3* (15–82) |
| Cause of injury | ||
| Sports | 15 | 4** |
| Assaults | 5 | 2 |
| Transport | 51 | 37* |
| Fall | 23 | 49** |
| Others | 6 | 8 |
| Unknown | 1 | 1 |
| Working accident | 18 | 22 |
| Level of injury | ||
| Tetraplegia | 38 | 63** |
| Paraplegia | 62 | 37 |
| Frankel classification | ||
| A | 52 | 38* |
| B | 7 | 4 |
| C | 13 | 13 |
| D | 25 | 43** |
| E | 2 | 2 |
| Complications during initial rehabilitation | 62 | 55 |
| Associated injuries | 51 | 55 |
| Prevalence of chronic medical conditions and/or traumas prior to SCIa | 14 | 31** |
| History of pre-injury alcohol or substance abuse | 3 | 10* |
| aAll chronic conditions or severe traumas noted in each patient’s medical journal are included. Differences between survivors and deceased: *p<0.05; **p<0.001. | ||
Causes of death
The predominant underlying causes of death in our sample were respiratory disease (n=30, 21%), and in particular pneumonia/influenza (n=22, 16%); ischaemic heart disease (n=18, 13%); urogenital diseases (n=18, 13%); cancer (n=17, 12%); and suicide (n=9, 6%). There were no noticeable differences in the causes of death between persons with tetraplegia and those with paraplegia.
Sixty percent of all respiratory deaths were found in individuals classified as Frankel D, most of them (77%) had a tetraplegia. The causes of injury were fall accidents in 50% of the cases. The median age at injury in those who died because of respiratory illness was 61 years (range 17–75 years) and at death 70 years (range 26–94 years). In contrast, subjects who died from suicide were 40 years at injury (range 15–62 years) and at death 46 years (range 22–83 years). However, calculations of the median age at death will change, as well as the frequency of the causes of death, as the survivors will also die in the future. In persons who died because of ischaemic heart disease, 11% had a history of pre-injury CVD. In the deceased classified as Frankel grade A–C, the organ system most frequently implicated in death was the urinary tract system. Seventeen of all patients died from neoplasm; i.e. lung cancer (n=4), cancer in the urinary tract (n=5; 4 bladder cancer, 1 kidney cancer), prostate cancer (n=3), abdominal cancer (n=3; inclusive, one rectum cancer), cancer in the oral cavity (n=1) and cancer of the uterus (n=1).
Survival
Fig. 1 illustrates survival in the study population divided into 2 groups, i.e. persons injured during the period 1961–75 and those injured during the period 1976–82. The log-rank test showed no improvement in survival times for those injured after 1 January 1976 (p=0.67).
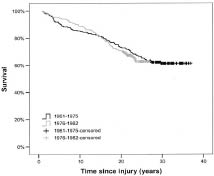
Fig.1. Survival of traumatic spinal cord injured admitted to Sunnaas Rehabilitation hospital in 1961–1975 and 1976–1982.
Fig. 2 illustrates age at death or censoring in the study population as well as a control curve of the age at death for the general population.
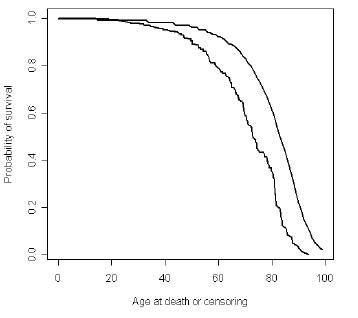
Fig. 2. Illustration of age at death or age at censoring of all persons (n=387) with traumatic spinal cord injury admitted to Sunnaas Rehabilitation Hospital 1961-82. The curve above/at right illustrates the age at death in the normal population.
Standardized mortality ratios
The SMR values are presented in Table III. The ratios were higher for women than for men. The SMR values were also higher for persons injured during the period 1976–82 than for those injured before 1976.
| Table III. Standardized mortality ratios (SMRs) for men and women with spinal cord injury (SCI) and incidence period | |||||
| Category | Men | Women | |||
| SMR | (95% CI) | SMR | (95% CI) | ||
| All SCI (n = 387) | 1.8 | (1.5 – 2.2) | 4.9 | (3.0–7.5) | |
| Tetraplegia (n = 182) | 2.4 | (1.9 – 3.0) | 7.6 | (3.9–13.3) | |
| Paraplegia (n = 205) | 1.3 | (0.9 – 1.8) | 3.3 | (1.5–6.3) | |
| Date of injury between 1961 and 1975 | 1.5 | (1.1 – 1.9) | 4.7 | (2.3–8.5) | |
| Date of injury between 1976 and 1982 | 3.6 | (2.7 – 4.6) | 5.5 | (2.6–10.2) | |
| CI: Confidence Interval. | |||||
The cause-specific SMRs (Table IV) demonstrate the high prevalence of various causes of death in persons with SCI.
| Table IV. Standardized mortality ratios (SMRs) for men and women for various causes of death | ||
| SMR (95% CI) (n = actual number of deaths) | ||
| Cause of death (ICD-9) | Men | Women |
| Septicaemia (038) | 6.9 (0.0–39.5) (n = 1) | – |
| Pulmonary cancers (162) | 1.0 (0.2–2.9) (n = 3) | 5.9 (0.0–34.2) (n = 1) |
| Urogenital cancers (188–189) | 4.4 (1.4–10.4) (n = 5) | – |
| Neoplasms* (140–239) | 0.9 (0.5–1.5) (n = 14) | 1.4 (0.3–4.1) (n = 3) |
| Ischaemic heart disease (410–414) | 0.9 (0.5–1.5) (n = 18) | – |
| Cerebrovascular disease (430–438) | 0.8 (0.2–1.8) (n = 5) | – |
| Other vascular disease (440–450) | 0.7 (0.0–3.8) (n = 1) | 5.3 (0.0–30.2) (n = 1) |
| Respiratory disease (460–478) (490–519) | 2.7 (0.9–5.9) (n = 6) | 8.9 (0.9–33.1) (n=2) |
| Pneumonia and influenza (480–487) | 5.6 (3.2–9.1) (n = 16) | 8.7 (3.1–18.9) (n = 6) |
| Diseases of the digestive organs (520– 579) | 3.8 (1.5–7.8) (n = 7) | – |
| Diseases of the urogenital system (580–599) | 21.9 (12.2–36.3) (n = 15) | 23.4 (4.4–69.1) (n = 3) |
| Unintentional injuries (E800–E949) | 1.6 (0.6–3.5) (n = 6) | – |
| Suicide (E950– E959) | 4.7 (1.9–9.7) (n = 7) | 19.2 (1.8–70.5) (n = 2) |
| *All cancers, including pulmonary and urogenital cancers. CI: confidence interval | ||
Risk indicators for death
The univariate analyses showed that age at injury, marital status at injury, pre-injury occupational classification, place of residence according to 5 regions of Norway, living alone at the time of injury, injury aetiology, neurological level of injury, Frankel classification, pre-injury psychiatric diagnosis, pre-injury CVD, pre-injury respiratory disease, and pre-injury alcohol or substance abuse, were significantly related to the time interval from injury until death or time censored (p<0.25). These factors were included in the multiple Cox regression analysis and the final results are shown in Table V. Significant indicators for death were higher age at injury, cervical level of injury, functionally complete SCI, pre-injury presence of CVD, pre-injury presence of psychiatric disease and a history of alcohol or substance abuse before the SCI.
| Table V. Risk indicators for death | |||
| Factors | RR | 95% CI | p-value |
| Age at injury* | 1.08 | 1.06–1.09 | <0.001 |
| Paraplegia (ref.) | 1.00 | – | – |
| Tetraplegia | 1.64 | 1.12–2.39 | 0.012 |
| Frankel classes D–E (ref.) | 1.00 | – | – |
| Frankel classes A–C | 1.84 | 1.24–2.73 | 0.002 |
| No cardiovascular disease pre-injury (ref.) | 1.00 | – | – |
| Cardiovascular disease pre-injury present | 2.80 | 1.22–6.40 | 0.015 |
| No psychiatric diagnosis pre-injury (ref.) | 1.00 | – | – |
| Psychiatric diagnosis pre-injury present | 7.17 | 2.57–20.01 | <0.001 |
| No alcohol or substance abuse pre-injury present (ref.) | 1.00 | – | – |
| Alcohol or substance abuse pre-injury present | 2.21 | 1.24–3.93 | 0.007 |
| *For each year of advancing age at injury, the relative risk (RR) of dying increased by 0.08. CI: confidence interval. | |||
DISCUSSION
The study shows elevated overall SMRs in persons with chronic SCI, especially in women. We also found elevated cause-specific SMRs for urogenital diseases, pneumonia/influenza, suicide, diseases of the digestive system, and urogenital cancer. Furthermore, we showed that age at injury, level and extent of the SCI, and pre-injury medical conditions were predictors of mortality.
The dominating underlying causes of death in the study population were pneumonia/influenza, CVD, genitourinary conditions, cancer and suicide. Several other studies have documented a high frequency of respiratory cause of death in chronic SCI; more commonly in persons with complete SCI compared with those with incomplete lesions (1, 10, 14). In our material, the highest percentage of respiratory death was found in individuals classified as Frankel D, although it is notable that their age at injury and at death were fairly high. The fact that respiratory diseases are frequent causes of death in the elderly general population should also be taken into consideration (31). Furthermore, many of these subjects probably had a central cord syndrome, which also may affect respiratory function.
Cigarette smoking is a major risk factor for respiratory disease and CVD, and previous studies have suggested a higher proportion of smokers among persons with SCI compared with the general population (32). Garshick et al. (33) showed that current smokers at study entry had an increase in mortality of 4% per cigarette smoked per day compared with never smokers, in chronic SCI. Our investigation did not include data on cigarette smoking among the studied individuals. Since respiratory disease and CVD were found to be the most common causes of death in our study, information on cigarette smoking would be of value.
It is well known that persons with SCI are exposed to potential risk factors associated with CVD (34), and several studies have found that deaths due to CVD are frequent in this population (1, 2, 4–10, 14). CVD (ICD-9 codes 390–450), predominantly ischaemic heart disease, accounted in total for 23% of the deaths in our investigation. An important finding was the significant association between the presence of pre-injury CVD and premature death in the study population. Furthermore, the Cox regression also revealed that the presence of pre-injury psychiatric disease as well as pre-injury alcohol or substance abuse were significant predictors for death. Thus, paying attention to co-morbidity and treatable factors must be more emphasized. Garshick et al. (33) recently assessed that diabetes, heart disease, lower levels of pulmonary function, and current or recent smoking were risk factors for death. Krause et al. (22) identified that hospitalization within the 2 years before data collection was associated with mortality, and concluded that greater attention needs to be given to medical secondary conditions that precede mortality.
Hartkopp et al. (6, 35) documented a high suicide rate in individuals with Frankel grade E lesions. Their results showed frequent previous psychiatric diagnoses in individuals who committed suicide. In the current study, 4 persons who committed suicide were classified as Frankel grade A and 5 as Frankel grade D. Psychiatric problems pre-injury were registered in one person only. Information on illness during the period after initial rehabilitation until death was not available. It is well known from studies in the general population that a major proportion of individuals committing suicide suffer from psychiatric illness, above all depression (36, 37). The frequency of suicide in the current study is somewhat lower (6.4% of all deaths) than shown by Hartkopp et al. (6, 35) (9.8%). Yet, the calculated SMRs demonstrate that suicide is a serious problem in the SCI population. Our results emphasize that more attention is needed to detect psychological maladjustment in persons with SCI.
Bombardier et al. (38) concluded that a history of problem drinking may be a risk for poorer rehabilitation progress in patients with SCI. We observed that persons with a history of pre-injury alcohol or substance abuse were at increased risk of premature death. Special attention, including more intensive follow-up of this group, is necessary to detect and prevent illness and thus improve their survival probability. Heightened awareness among rehabilitation staff is needed to reveal alcohol or substance abuse in persons with SCI.
The overall SMRs were higher in women than in men in this study, and the difference seems to be larger than in previous chronic SCI mortality studies (6). In consistency with previous studies, older age at injury as well as level and extent of SCI were associated with mortality.
The calculated SMRs for cancer in the urinary tract system were markedly elevated (in men only), and support earlier observations on increased mortality due to bladder malignancy in persons with SCI (39, 40). The SMRs for septicaemia were not elevated in this study. Several other publications have documented high frequency and/or markedly elevated SMRs for septicaemia in persons with SCI (2, 6, 7, 10, 11, 14). Some of this discrepancy might be a result of different ways of coding causes of death. Septicaemia is usually coded as an immediate (direct) cause of death with either an underlying cause of respiratory infection, urinary infection or pressure ulcer, etc. From the information on the death certificates, we found that septicaemia frequently contributed to death, i.e. septicaemia was coded as the immediate cause of death.
The study was restricted by the selection of patients enrolled. Our data show that a relatively small proportion (approximately 22%) of persons who sustained SCI in Norway were treated at Sunnaas in the 1960s and the early period of the 1970s, in contrast to the number of persons admitted to the hospital after 1974/75 (approximately 45% of all new incidents in Norway). There is no reason to believe that the annual incidence of traumatic SCI was lower during the early period (41). Furthermore, there is lack of information on strategies concerning patient selection for rehabilitation at Sunnaas Rehabilitation Hospital prior to 1973, and also what happened to individuals with SCI who were not admitted to Sunnaas. We assume that a relatively high proportion of persons with higher grade of impairment, and/or older age at injury were sent to local hospitals for treatment and subsequently to local nursing homes. Therefore, a possible bias is that survival is overestimated because the studied sample represents a more selected group concerning the incidences in the 1960s and the early 1970s. If the representativeness had been better in the first incidence period, we believe that our findings concerning risk indicators for death would have shown even more explicit results, at least with regards to age at injury and level and extent of injury.
The results may be biased because of the inclusion of 24 persons who were enrolled in the study more than one year following injury. The survival is probably overestimated because deaths during the first year post-injury were excluded (10, 15, 17).
Concerning the computed cause-specific SMRs, we ended up with some adjusted results. Since 32 cases of death were coded at the Cause of Death Register as deaths due to “Unintentional injuries” (ICD9 codes E800-E949), we decided to recode in those situations where the injury-producing event was listed as the underlying cause of death. Otherwise, the results would indicate high SMR values (i.e. SMR in men: 7.2, CI: 4.7–10.5; SMR in women: 13.8, CI: 4.4–32.4) concerning “Unintentional injuries” (in most cases representing the injury which caused the SCI), which did not seem justified. The SMRs presented (Table IV) are biased, since the actual number of deaths due to “unintentional injuries” was reduced, but the expected number was not altered and thus slightly overestimated in this model. These kinds of deaths (late effects of chronic injuries) are relatively rare in the general population. Some of the SMRs in this study were computed on basis of small numbers of deaths (Table IV), resulting in uncertain values.
In conclusion, the overall SMRs confirm that mortality is high in persons with chronic SCI in Norway, especially in women. In addition to older age at injury and level and completeness of injury, this study shows that pre-injury medical conditions are risk indicators for death. The results highlight the importance of management of co-morbidity in persons with SCI.
ACKNOWLEDGEMENTS
This project was financed from the Norwegian Foundation for Health and Rehabilitation (EXTRA). The authors thank The Norwegian Association of the Disabled and The Norwegian Association for Spinal Injuries.
REFERENCES
1. Frankel HL, Coll JR, Charlifue SW, Whiteneck GG, Gardner BP, Jamous MA, et al. Long-term survival in spinal cord injury: a fifty-year investigation. Spinal Cord 1998; 36: 266–274.
2. Whiteneck GG, Charlifue SW, Frankel HL, Fraser MH, Gardner BP, Gerhart KA, et al. Mortality, morbidity and psychosocial outcomes of persons spinal cord injured more than 20 years ago. Paraplegia 1992; 30: 617–630.
3. Freed MM, Bakst HJ, Barrie DL. Life expectancy, survival rates, and causes of death in civilian patients with spinal cord trauma. Arch Phys Med Rehabil 1966; 47: 457–463.
4. Geisler WO, Jousse AT, Wynne-Jones M. Survival in traumatic transverse myelitis. Paraplegia 1977; 14: 262–275.
5. Geisler WO, Jousse AT, Wynne-Jones M, Breithaupt D. Survival in traumatic spinal cord injury. Paraplegia 1983; 21: 364–373.
6. Hartkopp A, Brønnum-Hansen H, Seidenschnur A-M, Biering-Sørensen F. Survival and cause of death after traumatic spinal cord injury. A long-term epidemiological survey from Denmark. Spinal Cord 1997; 35: 78–85.
7. DeVivo MJ, Krause JS, Lammertse DP. Recent trends in mortality and causes of death among persons with spinal cord injury. Arch Phys Med Rehabil 1999; 80: 1411–1419.
8. Le CT, Price M. Survival from spinal cord injury. J Chronic Dis 1982; 35: 487–492.
9. Samsa GP, Patrick CH, Feussner JR. Long-term survival of veterans with traumatic spinal cord injury. Arch Neurol 1993; 50: 909–914.
10. DeVivo MJ, Black KJ, Stover SL. Causes of death during the first 12 years after spinal cord injury. Arch Phys Med Rehabil 1993; 74: 248–254.
11. DeVivo MJ, Kartus PL, Stover SL, Rutt RD, Fine PR. Causes of death for patients with spinal cord injuries. Arch Intern Med 1989; 149: 1761–1766.
12. Minaire P, Demolin P, Bourret J, Girard R, Berard E, Deidier C, et al. Life expectancy following spinal cord injury: a ten-years survey in the Rhõne-Alpes Region France, 1969–1980. Paraplegia 1983; 21: 11–15.
13. Nakajima A, Honda S, Yoshimura S, Ono Y, Kawamura J, Moriai N. The disease pattern and causes of death of spinal cord injured patients in Japan. Paraplegia 1989; 27: 163–171.
14. Soden R, Walsh J, Middleton JW, Craven ML, Rutkowski SB, Yeo JD. Causes of death after spinal cord injury. Spinal Cord 2000; 38: 604–610.
15. Yeo JD, Walsh J, Rutkowski S, Soden R, Craven M, Middleton J. Mortality following spinal cord injury. Spinal Cord 1998; 36: 329–336.
16. Burke MH, Hicks AF, Robins M, Kessler H. Survival of patients with injuries of the spinal cord. JAMA 1960; 172: 121–124.
17. DeVivo MJ, Stover SL, Black KJ. Prognostic factors for 12-year survival after spinal cord injury. Arch Phys Med Rehabil 1992; 73: 156–162.
18. Krause JS, DeVivo MJ, Jackson AB. Health status, community integration, and economic risk factors for mortality after spinal cord injury. Arch Phys Med Rehabil 2004; 85: 1764–1773.
19. O’Connor PJ. Survival after spinal cord injury in Australia. Arch Phys Med Rehabil 2005; 86: 37–47.
20. Kiwerski JE. Factors contributing to the increased threat to life following spinal cord injury. Paraplegia 1993; 31: 793–799.
21. Sneddon DG, Bedbrook G. Survival following traumatic tetraplegia. Paraplegia 1982; 20: 201–207.
22. Krause JS, Sternberg M, Lottes S, Maides J. Mortality after spinal cord injury: an 11-year prospective study. Arch Phys Med Rehabil 1997; 78: 815–821.
23. Pedersen AG. A survey of the Cause of Death Registry and the existing rules to establish codes 1996–1997. Report; Official Statistics of Norway; 2000, [in Norwegian].
24. Pedersen AG, Strøm K, Østevold G, Hoff J, Djume W, Westby G. Causes of death 1991–2000. Report; Official Statistics of Norway; 2003.
25. Gjertsen F. The Cause of death registry and research. Tidsskr Nor Lægeforen 2000; 120: 723–725 [in Norwegian].
26. Gjertsen F. Cause of death registry – an important data source for medical research. Tidsskr Nor Lægeforen 2002; 26: 2551–2554, [in Norwegian].
27. Frankel HL, Hancock DO, Hyslop G, Melzak J, Michaelis LS, Ungar GH, et al. The value of postural reduction in the initial management of closed injuries of the spine with paraplegia and tetraplegia. Paraplegia 1969; 7: 179–192.
28. Krokstad S, Ringdal K, Westin S. Classifying people by social class in population based health surveys: two methods compared. Norsk Epidemiologi 2002; 12: 19–25.
29. Krokstad S, Westin S. Health inequalities by socioeconomic status among men in the Nord-Trøndelag Health Study, Norway. Scand J Public Health 2002; 30: 113–124.
30. Altman DG, ed. Practical statistics for medical research, 1st edn. London: Chapman & Hall; 1991.
31. Statistics Norway. Pneumonia and influenza as cause of death in different age groups. Official Statistics of Norway; 2002 [in Norwegian].
32. Biering-Sørensen F, Biering-Sørensen M. Sleep disturbances in the spinal cord injured: an epidemiological questionnaire investigation, including a normal population. Spinal Cord 2001; 39: 505–513.
33. Garshick E, Kelley A, Cohen SA, Garrison A, Tun CG, Gagnon D, et al. A prospective assessment of mortality in chronic spinal cord injury. Spinal Cord 2005; 43: 408–416.
34. Bauman WA, Kahn NN, Grimm DR, Spungen AM. Risk factors for atherogenesis and cardiovascular autonomic function in persons with spinal cord injury. Spinal Cord 1999; 37: 601–616.
35. Hartkopp A, Brønnum-Hansen H, Seidenschnur A-M, Biering-Sørensen F. Suicide in a spinal cord injured population: its relation to functional status. Arch Phys Med Rehabil 1998; 79: 1356–1361.
36. Kjølseth I, Ekeberg Ø, Teige B. Suicide among elderly in Norway. Tidsskr Nor Lægeforen 2002; 122: 1457–1461 [in Norwegian].
37. Grøholt B. Risk factors for suicidal behaviour among young people in Norway. Norsk Epidemiologi 2002; 12: 207–221 [in Norwegian].
38. Bombardier CH, Stroud MW, Esselman PC, Rimmele CT. Do preinjury alcohol problems predict poorer rehabilitation progress in persons with spinal cord injury? Arch Phys Med Rehabil 2004; 85: 1488–1492.
39. West DA. Role of chronic catheterization in the development of bladder cancer. Urology 1999; 53: 292–297.
40. Groah SL, Weitzenkamp D, Whiteneck GG, Lezotte DC, Hamman RF. Excess risk of bladder cancer in spinal cord injury: evidence for an association between indwelling catheter use and bladder cancer. Arch Phys Med Rehabil 2002; 83: 346–351.
41. Gjone R, Nordlie L. Incidence of traumatic paraplegia and tetraplegia in Norway: a statistical survey of the years 1974 and 1975. Paraplegia 1978; 16: 88–93.

