OBJECTIVE: To improve, with the aid of psychometric analysis, the Balance Evaluation Systems Test (BESTest), a tool designed to analyse several postural control systems that may contribute to poor functional balance in adults.
METHODS: Performance of the BESTest was examined in a convenience sample of 115 consecutive adult patients with diverse neurological diagnoses and disease severity, referred to rehabilitation for balance disorders. Factor (both explorative and confirmatory) and Rasch analysis were used to process the data in order to produce a new, reduced and coherent balance measurement tool.
RESULTS: Factor analysis selected 24 out of the 36 original
BESTest items likely to represent the unidimensional construct of “dynamic balance”. Rasch analysis was then used to: (i) improve the rating categories, and (ii) delete 10 items (misfitting or showing local dependency). The model consisting of the remaining 14 tasks was verified with confirmatory factor analysis to meet the stringent requirements of modern measurement.
CONCLUSION: The new 14-item scale (dubbed mini-BESTest) focuses on dynamic balance, can be conducted in 10–15 min, and contains items belonging evenly to 4 of the 6 sections from the original BESTest. Further studies are needed to confirm the usefulness of the mini-BESTest in clinical settings.
Key words: postural balance, outcome assessment, psychometrics.
J Rehabil Med 2010; 42: 323–331
Correspondence address: Franco Franchignoni, Fondazione Salvatore Maugeri, Clinica del Lavoro e della Riabilitazione, IRCCS, Via Revislate 13, IT-28010 Veruno, Italy. E-mail: franco.franchignoni@fsm.it
Submitted August 25, 2009; accepted January 5, 2010
INTRODUCTION
Assessment of balance and mobility in clinical settings can help to determine both risk of falling (1) and the most suitable measures to reduce postural instability (2–3). Laboratory studies have shown that postural control embraces different subdomains, including stability during quiet stance, postural reactions to external disturbances, anticipatory postural adjustments to perturbations caused by self-initiated movements (e.g. lifting an object), and dynamic balance during gait (4). However, until recently clinical balance tests did not systematically evaluate all these subdomains (5–6).
Recently, a new clinical tool for assessing subdomains underlying balance deficits has been presented: the Balance Evaluation Systems Test (BESTest) (7). The BESTest is a comprehensive balance assessment tool developed to identify the postural control systems underlying poor functional balance, so that treatments can be targeted to the specific balance deficit. Since the BESTest encompasses 4–6 items for each of 6 different balance domains, it takes approximately 35 min to administer, compared with only approximately 15 min for other balance scales (e.g. the Berg Balance Scale; BBS) (8). This is an important shortcoming of the BESTest, limiting its routine use. On the other hand, the main disadvantage of other popular balance scales, including the BBS, is that they do not include important aspects of dynamic balance control, such as the capability to react to postural perturbations, to stand on a compliant or inclined surface, or to walk while performing a cognitive task. All of these features of balance control are known to be important in assessing balance disorders in different types of patients, and reflect balance challenges during activities of daily living (5, 7, 9). Therefore, there is need for a comprehensive balance assessment tool that can be administered in a short time period.
In developing and validating new clinical instruments there is a growing trend of using Rasch analysis (10). Whereas traditional psychometric approaches focus on an instrument’s total score, item response theory (IRT) models, such as the Rasch measurement models, are founded on the probability that a person will make a particular response according to their level of the underlying latent variable. In this framework, it is possible to evaluate how well an item performs in terms of its relevance or contribution for measuring the underlying construct, the level of the underlying construct targeted by the question, the possible redundancy of the item relative to other items in the scale, and the appropriateness of the response categories (11). For these reasons, Rasch analysis has been recommended as a complementary method to assess the scaling properties of new clinical instruments, in addition to the traditional psychometric criteria for disability outcomes research (12).
The purpose of this study was to use both classical psychometric techniques and Rasch analysis to evaluate the BESTest, investigating a wide range of measurement requirements (e.g. dimensionality, quality of the rating categories, construct validity, reliability indexes) in order to improve the structure and measurement qualities of the test. Based on this analysis, we present a new, mini-BESTest that focuses on dynamic balance and can be conducted in 10–15 min.
MATERIAL AND METHODS
Patients
A total of 115 patients (53 men and 62 women), mean age 62.7 years (standard deviation, (SD) 16), were studied. They represent a convenience sample of patients with balance disorders, recruited with a consecutive sampling method. Patient diagnosis was as follows: 22 hemiparesis (12 right, 10 left), 21 Parkinson’s disease, 15 neuromuscular diseases, 14 hereditary ataxia, 11 multiple sclerosis, 10 unspecific age-related balance disorders, 7 peripheral vestibular disorders, 6 traumatic brain injury, 4 diffuse encephalopathy, 3 cervical myelopathy, and 2 central nervous system (CNS) neoplasm. All subjects were inpatients referred to the Scientific Institute of Veruno for rehabilitation assessment and treatment. Inclusion criteria were: ability to walk with or without a cane; absence of severe cognitive or communication impairments; ability to tolerate the balance tasks without fatigue. Prior to taking part in the study, all participants signed an informed consent that had been approved by the central ethics committee of the “Salvatore Maugeri” Foundation.
Instrument and procedure
The BESTest (7) contains 6 subscales, covering a broad spectrum of performance tasks: (i) biomechanical constraints, (ii) stability limits, (iii) transitions and anticipatory postural adjustments, (iv) postural responses to perturbation, (v) sensory orientation while standing on a compliant or inclined base of support, and (vi) dynamic stability in gait with and without a cognitive task (Table I). The BESTest consists of 27 items, some of which are subdivided into 2–4 sub-items (e.g. for left and right sides) for a total of 36 tasks. Each item is scored on a 4-category ordinal scale from 0 (worst performance) to 3 (best performance). Specific patient and rating instructions, and stopwatch and ruler values are used to improve reliability (see www.bestest.us). Patients were rated by a physical therapist (MG) with 4 years of practice experience in balance assessment, who participated in a one week training course on the BESTest, at the Balance Disorders Laboratory, Oregon Health & Science University.
| Table I. Summary of BESTest items and subsystem categories. The 14 items forming the mini-BESTest for dynamic balance are in bold. Only the worst performance in items 11 “Stand on one leg” and 18 “Lateral stepping” have to be taken into account for the score. Moreover, the performance in item 27 “Cognitive Get Up and Go” must be compared with that in the baseline item 26 |
| I Biomechanical constraints | II Stability limits | III Anticipatory- transitions |
| 1. Base of Support 2. Alignment 3. Ankle Strength 4. Hip Strength 5. Sit on Floor and Stand Up | 6. a. Lateral Lean L b. Lateral Lean R c. Sitting Verticality L d. Sitting Verticality R 7. Reach Forward 8. a. Reach L b. Reach R | 9. Sit to Stand 10. Rise to Toes 11. Stand on One Leg (both right and left) 12. Alternate Stair Touch 13. Standing Arm Raise |
| IV Postural responses | V Sensory orientation | VI Dynamic gait |
| 14. In-place forward 15. In-place backward 16. Stepping forward 17. Stepping backward 18. Lateral stepping (both right and left) | 19. a. Stance EO (firm surface) b. Stance EC (firm surface) c. Foam EO d. Foam EC 20. Incline EC | 21. Gait Natural 22. Change Speed 23. Head Turns 24. Pivot Turns 25. Obstacles 26. Get Up and Go 27. Cognitive Get Up and Go |
| L: left; R: right; EO: eyes open; EC: eyes closed. |
Statistical analysis
Unidimensionality, i.e. whether items are measuring a single underlying dimension or several separate dimensions, is one of the key requisites for test analysis and must be verified before applying Rasch models (13). To test the dimensionality of the BESTest, we performed the following statistical steps.
1. A confirmatory factor analysis for categorical data (CFA, LISREL 8.80 software, Scientific Software International, Inc., Lincolnwood, IL 60712, USA) was performed to evaluate the fit of the scale to a unidimensional model. The extent to which the model can be used to reproduce the sample data was determined by examining the following indexes: the non-normed fit index (NNFI, or Tucker-Lewis index), the comparative fit index (CFI), the root mean square error of approximation (RMSEA) and the standardized root mean square residual (SRMR). NNFI and CFI scores range from 0 to 1 with higher values indicating better fit: values greater than 0.95 are indicative of an acceptable model fit. A RMSEA value lower than 0.08 reflects an adequate fit and a RMSEA value equal to or less than 0.05–0.06 suggests a good fit. A SRMR value between < 0.10 and 0.05 is reflective of an acceptable fit (14–15).
2 In the event of a poor fit (i.e. multidimensionality is suspected) the following statistical steps were performed sequentially:
a. Horn’s parallel analysis (16) was used to estimate the number of meaningful dimensions in the response matrix: the size of eigenvalues obtained from principal component analysis (PCA) was compared with those obtained from a randomly generated data set of the same size and number of variables. Only factors with eigenvalues exceeding the values obtained from the corresponding random dataset were retained for further investigation. Parallel analysis was conducted using ViSta (17) Parallel Analysis plugin (http://www.mdp.edu.ar/psicologia/vista/).
b. Explanatory factor analysis (EFA, STATA 10.1 software, StataCorp LP College Station TX 77845, USA) was performed with a principal factor analysis using the number of factors suggested by the parallel analysis. After varimax rotation, the relationships between the test items and retained factors were taken into account. For a solution that is stable and approximates the population pattern, given the sample size, only items with loading > 0.50 were considered as correlated to the factors (18).
c. Item exclusion, based on the EFA results and expert review, was performed leading to a preliminary reduced set of test items.
Following the above analysis and item exclusion, the matrix of item responses of the 24 retained items for each subject underwent Rasch analysis using WINSTEPS software (Linacre JM, WINSTEPS Rasch measurement computer program, version 3.68. Chicago: Winsteps.com; 2009) (19).
As a first step, we investigated whether the rating scale of each BESTest
item was used in the expected manner. We evaluated the rating scale categories (partial credit model) using criteria suggested by Linacre (20, 21): (i) at least 10 observations per response option; (ii) even distribution of category use; (iii) monotonic increase in both average measures of persons with a given score/category and thresholds (thresholds, or step calibrations, are the ability levels at which the response to either of 2 adjacent categories is equally likely); (iv) category outfit mean square (MnSq) values less than 2 (see below); and (v) threshold differences larger than 1.4 and lower than 5 logits. We collapsed categories following these guidelines, and compared different collapsing solutions, examining not only the category diagnostics, but also reliability indices. We were guided by the intention to select a solution that maximized statistical indices and clinical meaningfulness.
After this rating scale modification, a new Rasch analysis was performed, including PCA on the standardized residuals to evaluate: (i) the presence of sub-dimensions, as an independent confirmation of the unidimensionality of the scale, and (ii) the local independence of items.
1. “Unidimensionality” assumes that, after removal of the trait that the scale intended to measure (the “Rasch factor”), the residuals will be uncorrelated and normally distributed (i.e. there are no principal components) (19). The following criteria were used to determine whether additional factors were likely to be present in the residuals: (i) a cutoff of 50% of the variance explained by the Rasch factor; and (ii) eigenvalue of the first residual factor smaller than 3 (19).
2. “Local independence” between items indicates that they do not duplicate some feature of each other or they both incorporate some shared dimension. Item couples with a standardized residual correlation > 0.30 were considered as possibly dependent components (22). Based on examination of the respective item information functions and expert judgement, we progressively eliminated all dependencies, either removing one of the items, or, in the case of dependent items that were related to the same task performed in different directions (e.g. scores assessing right and left sides), collapsing the items into a new one reporting only the worst performance.
Internal validity of the scale was assessed by evaluating the fit of individual test items to determine if the pattern of item difficulty was consistent with the model predictions. We estimated the goodness-of-fit of the observed data to data predicted by the Rasch model (23, 24). Information-weighted (infit) and outlier-sensitive (outfit) mean-square statistics (MnSq) for each item were calculated to test whether there were items that did not fit the model expectancies. Both of these fit statistics are expected to approach 1 if the data fit the model. In accordance with the literature (10), we considered MnSq > 0.7 and < 1.3 as an indicator of acceptable fit.
We also estimated the level of difficulty of each item (“item difficulty”) and the ability of each individual subject, and then we examined the data for floor and ceiling effects. Item difficulty and subject ability are expressed, on a common interval scale, in logit units, a logit being the natural logarithm of the ratio (odds) of mutually exclusive alternatives (e.g. pass vs fail, or higher vs lower response option) (23, 24). Logit-transformed measures represent linear measures. By convention, 0 logit was ascribed to the mean item difficulty. For Rasch analysis, a sample size of more than 100 persons will estimate item difficulty with an alpha of 0.05 within ± 0.5 logits (25).
Reliability was evaluated in terms of “separation” across test items, defined as the ratio of the true spread of the measures to their measurement error (23, 24). Two indexes were calculated: the item separation index and the person separation index, that give an estimate (in standard error units) of the spread or “separation” of items and persons along the measurement construct, respectively. A separation of 2.0 is considered good (24). Related indexes are the reliability of the item separation index and of the person separation index. These provide the degree of confidence that can be placed in the consistency of the estimates. This confidence ranges from 0 to 1, and coefficients > 0.80 and > 0.90 are considered respectively good and excellent (23).
RESULTS
The confirmatory factor analysis (CFA) gave, using all the items in the BESTest, an inadequate fit (NNFI = 0.91, CFI = 0.91, RMSEA = 0.12, SRMR = 0.15). Horn’s Parallel Analysis (PA) revealed 3 factors with empirical eigenvalues exceeding those from the random data. These 3 factors explained 43%, 11% and 8% of the variance, respectively. To investigate the contribution of each item to the scale, we tested the 3-factor model suggested by PA using explanatory factor analysis for ordinal data (EFA) with a principal axis factor extraction method. After varimax rotation, 24 items loaded > 0.50 in the first factor, 4 items (6 a–d) in the second factor, and 3 items (7, 8a and 8b) in the third factor, while items 1–4 and 13 failed to load meaningfully in any factor.
Taking into account these results and expert opinion, 12 items (1–4, 6a–d, 7, 8a–b, 13) were deemed as not belonging to the main trait and therefore were dropped from subsequent analyses. The expert review judged the remaining 24 items to potentially measure a factor likely to represent “dynamic balance” in a variety of functional conditions. These 24 items underwent Rasch analysis.
Rating scale diagnostics showed that the 0–3 level rating categories did not comply with our pre-set criteria for category function. The model best meeting the criteria reduced the rating scale from 4 to 3 levels by combining categories 0 (absent) and 1 (mild) or 1 (mild) and 2 (moderate) (Table II), with different collapsing strategies used across items.
| Table II. Mean difficulty estimates for each of the 14 items of the mini-BESTest with standard errors (SE) and infit and outfit mean-square statistics (MnSq). The more difficult the item estimate, the less likely it is for any subject to gain a high score. Alongside each item is its number in the original BESTest (see Table I). The rating scale column shows how the 4 scaling categories were collapsed into 3 categories, e.g. 0012 means that categories 0 and 1 have been collapsed and then the remaining 3 categories have been re-numbered accordingly. L: left; R: right; EO: eyes open; EC: eyes closed |
| Item | Mean difficulty | SE | Infit MnSq | Outfit MnSq | Rating scale |
| 11 a/b – Stand on L/R leg | 2.43 | 0.25 | 0.90 | 1.07 | 0112 |
| 18 a/b – Postural Stepping L/R | 1.10 | 0.22 | 0.84 | 0.76 | 0112 |
| 23 – Head turns | 1.00 | 0.19 | 0.91 | 0.83 | 0012 |
| 17 – Postural Stepping backward | 0.93 | 0.22 | 0.97 | 1.08 | 0112 |
| 27 – Cognitive “Get Up and Go” with dual task | 0.77 | 0.24 | 1.07 | 1.08 | 0112 |
| 10 – Rise to toes | 0.65 | 0.20 | 0.94 | 1.11 | 0012 |
| 19 d – Foam Surface EC | 0.54 | 0.20 | 1.04 | 1.12 | 0112 |
| 25 – Obstacles | 0.10 | 0.21 | 0.75 | 0.73 | 0112 |
| 16 – Postural Stepping forward | –0.03 | 0.21 | 1.14 | 1.23 | 0112 |
| 20 – Incline EC | –0.64 | 0.21 | 1.12 | 1.00 | 0112 |
| 24 – Pivot turns | –0.85 | 0.21 | 0.99 | 1.32 | 0112 |
| 22 – Change speed | –1.00 | 0.20 | 0.89 | 0.78 | 0112 |
| 9 – Sit to stand | –1.78 | 0.24 | 1.30 | 1.32 | 0012 |
| 19 a – Stance EO | –2.51 | 0.39 | 1.12 | 0.66 | 0012 |
After combining these rating scale categories, 22 out of the 24 items fitted the underlying construct of dynamic balance that the scale was intended to measure (infit and outfit MnSq between 0.7 and 1.3). Item 5 “Sit on floor and stand up” was underfitting (i.e. with unexpectedly high variability) and item 26 “Get up and go” was overfitting (i.e. with an overly predictable pattern), so they were eliminated.
The PCA of standardized residuals showed several high (> 0.30) residual correlations between items.
Based on examination of the respective item information functions and expert judgment, all misfitting items and residual correlations > 0.30 were eliminated one by one, and the Rasch analysis was re-run. Correlated (redundant) items were removed either by deleting one of them, or by maintaining only the worst performance in items 11 and 18, which assessed the same task on both right and left side. At the end of these iterations, only 14 test items remained. This set of items (called the mini-Balance Evaluation Systems Test of dynamic balance; mini-BESTest) (see Table I) underwent further analyses.
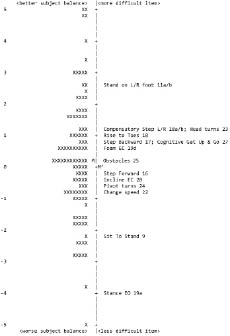
All of the final 14 items showed good infit and outfit MnSq values (Table II). The variance explained by the estimated Rasch measures was 58.8%, whereas only 5.3% of the variance was explained by the first residual factor (eigenvalue 1.8). Regarding the hierarchic ordering of items, Figs 1 and 2 show, according to the Rasch model, the distribution of subject ability and item difficulty. Item difficulty showed a fairly even spread (from the most easy item “Stand with eyes open on a firm surface” to the most difficult item “Stand on one leg”), and subject ability presented a normal distribution spanning from –5 to +4.9 logits, with an average measure = +0.15 (mean SE 0.59). Only 2 subjects showed extreme maximum scores: the precision of their ability estimates was quite low, the SE being approximately 30% of the corresponding measure. No floor effect was found. Overall, these findings demonstrate an adequate sample-item distribution. The item difficulty estimates spanned from –4 to +2.5 logits. The reliability indices of mini-BESTest were as follows: item separation index = 7.35 and item separation reliability = 0.98; Person separation index = 2.50 and Person separation reliability = 0.86.
Fig. 1. Subject-ability and item-difficulty maps of the mini-BESTest (n = 115). In both maps, the vertical line represents the measure of the variable, in linear logit units. The left-hand column locates each patient’s ability, from best to worst dynamic balance. The right-hand column locates each item’s relative difficulty for this sample (for each item, the difficulty estimate represents the mean calibration of the threshold parameters according to the partial credit model). From bottom to top, measures indicate better balance for patients and higher difficulty for items. By convention, the average difficulty of items in the test is set at 0 logits (and indicated with M’) and patients with average ability are located at M. L: left; R: right; EO: eyes open; EC: eyes closed.
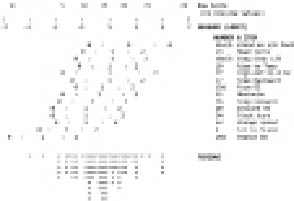
Fig. 2. Expected scores for the mini-BESTest (n = 115). Distance between points is equal-interval. Logit measure at top of key, centred at the mean item difficulty. The rating scale is collapsed from 4 to 3 categories renumbered 0 (severely impaired), 1 (moderately impaired), and 2 (normal). The threshold between adjacent categories is marked by “:”. At the bottom is the distribution of the person measures (subject ability): each marker is a single person. L: left; R: right; EO: eyes open; EC: eyes closed.
A final CFA confirmed the unidimensionality of the mini-BESTest, supporting the unidimensional model with the following indexes: NNFI = 0.98, CFI = 0.99, RMSEA = 0.064, and SRMR = 0.098.
The final version of the mini-BESTest is shown in Appendix I.
DISCUSSION
The original BESTest is composed of a comprehensive battery of 36 balance tasks, developed to analyse 6 different postural control systems that may contribute to poor functional balance in adults of any age (7). Thus, it is not surprising that this test failed to meet a unidimensionality assumption (i.e. that a single dimension underlies all item responses), when applied to 115 patients with a wide range of diagnoses and severity of disease.
Our dimensionality assessment extracted from the test battery 24 item assumed to define “dynamic balance”. On these items we performed an analysis of category and item properties using Rasch psychometric methods, which led to the definition of the 14 most psychometrically useful and practical items: the refined mini-BESTest measures the unidimensional construct of “dynamic balance” without redundant items or significant ceiling/floor effects (26) and takes 10–15 min to administer.
The rating scale diagnostics (21) performed on the 24 items retained after EFA showed that the original 4 levels were redundant (23). This finding was expected, since some BESTest items were borrowed (with modifications) from the BBS and the Dynamic Gait Index. These 2 well-known balance and mobility scales have been shown to include sub-optimal category functioning (27, 28) when strict diagnostic criteria are applied (20). In addition, it has already been demonstrated that the BBS (and other balance scales) show essentially identical psychometric properties, including responsiveness, when used with a 3-category, instead of a 4- or 5-category rating scale (29). Appropriate combination of levels 0–1 or 1–2 eliminated underutilized rating categories, and ensured that each rating category was distinct from the others in representing a distinct balance ability.
After collapsing the categories to 3 distinct levels, the data from the 24-item set were reanalysed to calculate fit statistics and the PCA of the residuals. This analysis enabled us to eliminate 10 misfitting or redundant items without loss of measurement information and with the great advantage of improving test acceptability and feasibility. For the remaining 14-item (the mini-BESTest), we calculated fit statistics, extracted Rasch-modelled parameters of ability and difficulty, and then examined internal validity and test reliability. The average ability of this group of patients was very similar to the mean value of 0 logits (+0.15): this means that the test is well targeted to the sample. Moreover, the person-ability and item-difficulty mapped logit scale showed a broad range for both person-ability and item-difficulty (Fig. 1). The 1.7% of subjects (2/115) with extreme maximum scores, the 2 “×” at the top of the left-hand column in Fig. 1, constituted a minor trend toward a ceiling effect in very highly functioning subjects. No floor effect was found. However, one should interpret the extreme results with caution, since these person measures have the least precision due to the larger errors of measurement. On the other hand, the high item separation reliability indicates that great confidence can be placed in the consistency of item difficulty estimate across future samples.
Content validity of the dynamic mini-BESTest is high, since many items included in the test are part of well-known balance batteries: (i) “Sit to stand” is from the Berg Balance Scale (30) and the Performance-Oriented Mobility Assessment (31); (ii) “Stand on one leg” is from the Ataxia Test Battery (32) and the Berg Balance Scale; (iii) “Stance – eyes open” and “Stance on foam – eyes closed” are from the modified Clinical Test of Sensory Integration of Balance (33, 34); (iv) Gait when balance is challenged by changing speed, head rotations, pivot turns, or stepping over obstacles comes from the Dynamic Gait Index (35); (v) the “Get Up and Go” test (36) and the “Get Up and Go with a simultaneous cognitive task” (37) are stand-alone tests. In the BESTest, Horak et al. (7) made only minor modifications to some of the above original items, in order to increase their challenge and improve their consistency and reliability. Novel items in the mini-BESTest have been adapted from laboratory tests where they were shown to distinguish different types of balance disorders: (i) postural reactions to external perturbations (38); (ii) rise to toes (39); and (iii) stance on an inclined surface with eyes closed (40).
As an additional demonstration of the internal construct validity of the scale, the general hierarchical arrangement found by Rasch analysis (Table II) is consistent with clinical expectations. For example, the maintenance of feet-together stance, eyes open on a firm surface (“Stance EO”) is the easiest task and “Stand on one leg” the most difficult task item (28). In fact, “Stance EO” makes few sensory demands and requires low effort, whereas “Stand on one leg” is very challenging because of the narrow base of support and musculoskeletal demands. In addition, the results of Rasch analysis of the mini-BESTest show a hierarchical order of item difficulty: “Gait with horizontal head turns”, “Stand on one leg”, and “Lateral stepping responses” were the most difficult items, whereas “Stance EO” and “Sit to Stand” were the easiest items. The high difficulty of the item “Gait with horizontal head turns” may be attributed to vestibular influences (35) and is in line with the results of the two Rasch studies on the Dynamic Gait Index (28, 41).
The mini-BESTest contains 14 items belonging evenly to 4 of the 6 sections from the original BESTest (Table I): section III “Anticipatory Postural Adjustments” (sit to stand, rise to toes, stand on 1 leg); section IV “Postural Responses” (stepping in 4 different directions); section V “Sensory Orientation” (stance – eyes open; foam surface – eyes closed; incline – eyes closed); and section VI “Balance during Gait” (gait during change speed, head turns, pivot turns, obstacles; cognitive “Get Up and Go” with dual task).
Our factor analysis procedure (42) isolated a number of items, primarily in the first 2 sections of the BESTest, that did not contribute to the dominant trait (dynamic balance), suggesting that parts I “Biomechanical constraints” and II “Stability limits” of the BESTest warrant separate psychometric studies. Biomechanical constraints (such as orthopaedic limitations on the base of foot support, postural alignment and strength) and stability limits (ability to lean to perceived limits of stability and perception of verticality) are also important facets of postural control, but appear to be independent of the construct “dynamic balance”.
This study has several limitations, which restrict the generalization of our results to different groups or settings, and raters. In particular, the selection criteria of our convenience sample (recruited with a consecutive sampling method) may represent a threat to external validity. Our sample was a cross-section of adults drawn from a single rehabilitation facility and with balance disorders of very different origins and severities. Moreover, we used only one rater, but to improve the reliability of results he participated in a one week training course on BESTest, held by one of its developers (FBH).
In conclusion, the new mini-BESTest offers a unique, brief clinical rating scale for dynamic balance that has excellent psychometric characteristics. The potential interest of the mini-BESTest in clinical settings is high, but further studies are needed. They should include: (i) analysis of the actual performance of the new 3-level response structure; and (ii) a study of differential item functioning, i.e. the stability of item hierarchy across sub-samples defined according to potentially relevant clinical criteria; (iii) relation of the scores to fall risk and to other clinical tests of balance; and (iv) age-related normative values.
ACKNOWLEDGEMENT
Fay Horak was supported by a Grant from the National Institutes on Aging AG-06457 (USA).
REFERENCES