OBJECTIVE: Determining the feasibility of implementing a new concept to objectively evaluate actual functional abilities of transfemoral amputees into a new measuring tool called “Assessment of Daily Activity Performance in Transfemoral amputees” (ADAPT).
DESIGN: Study 1: cross-sectional design. Study 2: repeated measures design.
SUBJECTS: Study 1 comprised two groups of 10 participants, age range 19–72 years. One group used microprocessor-controlled knee joints and the other group used mechanically controlled knee joints. Study 2 comprised 20 participants, age range 31–68 years.
METHODS: Two versions of ADAPT were assessed in the separate studies. In study 1 performance times on version 1 of ADAPT were compared between groups. In study 2 participants completed version 2 of ADAPT twice with a 1 h rest between trials. The Locomotor Capabilities Index was administered. Reliability was determined by calculating correlation coefficients and by Bland-Altman analyses.
RESULTS: In study 1, ADAPT version 1 proved to be sensitive in detecting differences in performance between groups. In study 2, 75% of all correlation coefficients exceeded 0.90 in version 2 of ADAPT. Bland-Altman analyses showed high test-retest agreement.
CONCLUSION: It is feasible to reliably assess actual functional abilities of transfemoral amputees using standardized simulations of daily activities. This ADAPT concept is able to differentiate between different functional performance levels.
Key words: amputation; rehabilitation; functional abilities; participation; activity; prostheses.
J Rehabil Med 2010; 42: 744–751
Correspondence address: Patrick Theeven, Adelante, Centre of Expertise in Rehabilitation and Audiology, Zandbergsweg 111, 6432 CC Hoensbroek, The Netherlands. E-mail: p.theeven@adelante-zorggroep.nl
Submitted October 30, 2009; accepted May 25, 2010
INTRODUCTION
Amputation of a lower limb changes a person’s life and diminishes their functional ability to perform activities of daily living (1). Receiving a prosthesis and completing a rehabilitation programme may partly restore this decreased functional ability. In transfemoral amputation, the type of knee joint fitted to the prosthesis is critical, because the knee needs to be stabilized and controlled by the amputee in order to ambulate effectively and safely (1, 2). To select the most suitable prosthetic knee joint for an individual patient is a challenge due to the large variety of available prosthetic components, each of which has specific functions and purposes. The effects of different types of prosthetic knee joints on the functioning of transfemoral amputees has been the topic of many studies (3–7). These studies have typically focused on biomechanical and (neuro)physiological measures, i.e. measures at ICF function level, in order to quantify any possible added value due to prosthetic knee joints. Although important, the effects of prosthetic components should not be assessed solely at ICF function level, as this would disregard the problems that occur at the activity and participation level. From the amputee’s perspective, it is more important to be able to resume previous social roles, rather than to be able to, for example, walk 100 m a few seconds faster.
Several instruments are currently available to evaluate the functional ability of amputees. For example, the Locomotor Capabilities Index (LCI) (8) and the Functional Measures for Amputees (FMA) (9). These evaluate the functional ability of amputees using self-report questionnaires and thus rely heavily on the amputee having a realistic self-knowledge, which makes these tests highly subjective. The Special Interest Group of Amputee Medicine (SIGAM) of the British Society of Rehabilitation Medicine has developed a method to assign leg amputees to 1 of 6 mobility classes (A–F) using a 21-item questionnaire in combination with an accompanying algorithm (10). This test is used in several countries, including the Netherlands (SIGAM-WAP) (11). Although all the above-mentioned tests are valid and reliable, they all measure perceived functional performance, rather than actual functional performance with a prosthesis. The Amputee Mobility Predictor (with prosthesis) (AMPPRO) (12) is a more objective 21-item performance test including transfers, sitting and standing balance, and several gait skills to assess the amputee’s mobility and existing or potential functional ambulation with a leg prosthesis. However, this test focuses on individual aspects of performance with a prosthesis (sitting balance, standing balance, minor gait manoeuvres), whereas it would be even more important to focus on the necessary ability of the amputee to combine these different aspects during functional performance in their home situation.
A recent search of the literature did not reveal any instruments that objectively quantify the actual functional ability of amputees to perform common daily activities. Such an instrument, however, is important because it could provide information about the effect of a prosthesis component on the functioning of the amputee in daily life. It could therefore help in the selection and prescription of prostheses that best suit the individual’s physical abilities and participation aims.
A concept for a new tool that may objectively measure functional performance in daily life was developed. This concept is based on the idea that the most straightforward way to assess an individual’s functional performance level is to observe the patient performing the selected set of daily activities that are most common in their life. However, this would mean that a new measuring tool based on this concept should be different for each patient, because each person performs different activities during their daily routine. This would lead to a test with endless variations, which would be highly impractical.
In order to limit the number of variations of activities, a series of structured interviews was performed among unilateral transfemoral amputees and experienced occupational therapists with the aim of making an inventory of daily activities perceived by amputees as difficult to perform with a prosthesis. With the information obtained from these interviews, a gross list was composed, listing limiting factors as perceived by persons with a leg amputation in their daily pursuits, such as overhead reaching, bending down, kneeling, turning, maintaining balance, walking, negotiating stairs, descending a sloped surface, pulling/pushing, and carrying objects. From this gross list, a number of common daily situations were identified that were expected to be the most difficult to perform, for example putting a bag of potatoes into a shopping trolley in the supermarket or hanging out laundry on a clothes line.
Ideally, the patient should be assessed in real life circumstances. However, from a research point of view, it is necessary to measure under repeatable circumstances. Therefore, the next step in the development of this new tool to measure functional performance was the operationalization of the identified common daily activities into standardized and measurable test situations or “circuit stations”, consisting of simulated representations of these daily activities. This tool would thereby link the experienced disability level with the actual activity level.
The final step of incorporating this concept into a new measuring tool is to select the most suitable and reliable circuit station activities with high sensitivity to detect small changes in functional performance levels from all the simulated daily life activities available. Based on two test versions evaluated in the present study, a final test may be constructed involving a selection of those circuit stations that best simulate daily life situations. This final version will be called the “Assessment of Daily Activity Performance in Transfemoral amputees” (ADAPT) test.
The aim of this study was to evaluate the feasibility of implementing a concept of objectively assessing functional abilities of transfemoral amputees in daily life performance into a new measuring tool (the ADAPT test). Therefore, proof of principle was sought by investigating the ability to differentiate between functional performance levels of two groups of transfemoral amputees, i.e. discriminant validity, and the level of reproducibility, i.e. test-retest reliability, in two different test versions of the ADAPT test.
METHODS
In two separate consecutive studies “proof of principle” for implementing the ADAPT test was evaluated.
Study 1 evaluated a first test version of an ADAPT test in terms of the sensitivity to differentiate between functional levels of performance of different groups of users of leg prostheses. A subset of available circuit stations was used in this study, as described in Table I (subset A).
| Table I. Description of subset A of the Assessment of Daily Activity Performance in Transfemoral amputees test circuit stations used in study 1 |
| Subset A | Circuit station | Task description |
| 1 | Supermarket | “Easy”: 18 low-weight (500 g), easy to handle objects have to be picked from shelves at different heights and placed into a shopping trolley. Seven objects are labelled with an “A”, 6 objects with a “B” and 5 objects with a “C”. |
| “Moderate”: 4 moderate weight (2 and 5 kg) objects (labelled with a “D”) have to be picked from the shelves at different heights and placed into a shopping trolley. |
| “Difficult”: 2 large and heavy (6 kg) objects (labelled with an “E”) have to be picked from the shelves at different heights and placed into a shopping trolley. |
| 2 | Shopping bags | The 18 “easy” objects (described in circuit station 1) have to be loaded into 3 shopping bags with corresponding labels “A”, “B”, “C”, that are placed on a table. |
| 3 | Kitchen cabinets | Unload the shopping bags into kitchen cabinets of a height-adjustable kitchen at different reaching heights. |
| “Easy”: put the 18 low-weight objects into the designated cabinets labelled “A”, “B” and “C”. Cabinets “A” and “C” are at eye-level. Cabinet “B” is at knee-level. |
| “Difficult”: put the 5 objects from cabinet “C” onto cabinet “A” (high) with the help of a two-step kitchen step. |
| 4 | Unloading low kitchen cabinets | “Easy”: Unload objects placed in the front part of a cabinet at knee height and put them on the floor. |
| “Moderate”: Unload objects placed in the middle part of a cabinet at knee height and put them on the floor. |
| “Difficult”: Unload objects placed in the deep part of a cabinet at knee height and put them on the floor. |
| 5 | Slalom (13 m) | Short slalom (approximately 13 m) while holding a serving tray with 5 plastic cups filled with water. |
| 6 | Get the remote control | Sit down, stand up, walk to the television set to pick up the remote control and sit down again. |
| “Easy”: sit down in an armchair. |
| “Moderate”: sit down in the middle of a low sofa without using the armrests. |
| “Difficult”: sit down on a very low bench. |
| 7 | Car | Walk towards a small car and get in at the passenger side (distance: 4 m). Get out and walk round the car once, get into and out of the car again and walk to the place where you started the task. |
| 8 | Stairs descent | Go down the stairs. |
| “Easy”: normal walking. |
| “Moderate”: walking while holding a plastic cup of water in one hand. |
| “Difficult”: walking while holding an empty box in both hands. |
| 9 | Slope descent and ascent (10 m) | Walk up and down a slope (length 5 m; height 0.3 m). |
| “Easy”: normal walking. |
| “Moderate”: walking while holding a plastic cup of water. |
| “Difficult”: walking while holding an empty box. |
Study 2 assessed a second test version of an ADAPT test in terms of reproducibility. This second test version partly consisted of a selection of circuit stations from subset A that were modified based on the findings in study 1. Moreover, several newly developed circuit stations were added to the modified selection of subset A. All circuit stations together constitute subset B, as described in Table II.
| Table II. Description of subset B of the Assessment of Daily Activity Performance in Transfemoral amputees test circuit stations used in study 2 |
| Subset B | Circuit station | Task description |
| 10 | Slope descent and ascent (72 m) | Walk up and down a slope twice (length 18 m; height 2.2 m). |
| “Easy”: normal walking. |
| “Moderate”: walking combined with a cognitive dual task. |
| 11 | Theatre | Walk sideways between two rows of chairs while holding a cup of water. Sit down at the last chair, stand up and walk back to the start/finish line. |
| 12 | Slalom (32 m) | Slalom (approximately 32 m) while holding a serving tray with 10 tennis balls. |
| 13 | Bedroom | Sit down on the bed. Take off the prosthesis and lie down; When on the bed, put on the prosthesis and go to the toilet in the bathroom (distance: 15 m); Strip the bed (eiderdown cover, pillowcase and fitted sheet). |
| 14 | Hanging out laundry | Pick up the towels one by one (8 in total) from a tray on the ground together with two pins and hang them on the clothes line. The (adjustable) clothes line is set at wrist level when arms are fully extended and raised above the head. |
| 15 | Picking up objects from the floor | Different objects from varying sizes and weight have to be picked up and moved to their designated locations. |
| 16 | Obstacle avoidance | Walk across a living room and avoid all the obstacles (e.g. toys) on the ground. |
| 17 | Sitting down and standing up from the floor | Sit down on the floor and stand up again. |
| 18 | Dressing and changing clothes | Put on a pair of rain-proof trousers and a raincoat. |
As shown in Tables I and II, some circuit stations were sometimes subdivided into 2 or 3 categories of activities ranging in difficulty level. The degree of difficulty is determined by several factors, such as the weight of objects used, introduction of a cognitive dual task or the addition of more challenging actions.
Instructions concerning the nature of the tasks were given to the participants by the researcher prior to the start of each circuit station activity. It was stressed that the activities should be performed in the same way that the participant would do normally. A circuit station was repeated if a participant did not carry out the required tasks within a specific circuit station in the correct order. An exception was introduced for activity 12 (subset B) in the case of one or more of the tennis balls dropping from the tray. The balls were replaced on the tray by the researcher without interfering in the participant’s test performance. This was done to prevent participants from not being able to finish this circuit station.
All participants were selected from the patient database of the Amputation and Traumatology Department of Adelante Rehabilitation Centre. This included patients from the southern regions of the Netherlands and adjacent regions in Belgium and Germany. A total of more than 100 eligible persons were invited to participate in the studies. A group of 20 participants agreed to participate in study 1 and another 20 participants in study 2. All participants completed the tests according to the study protocol. The main reasons for not participating were that the travelling distance was too long, that individuals were not able to take a day off work, or that they had no interest in participating in the study.
Approval for both studies was obtained from the medical ethics committee of the Rehabilitation Foundation Limburg, Hoensbroek, The Netherlands. Written informed consent was obtained from all subjects prior to their participation.
Study 1
The aim of study 1 was to test the concept of an ADAPT test, using subset A, in terms of the ability to differentiate between the levels of functional performance of different groups of users of leg prostheses, i.e. people using a leg prosthesis featuring a knee joint with a microprocessor-controlled stance and swing phase and people using a leg prosthesis featuring a mechanically controlled knee joint. It does not aim to prove that a microprocessor-controlled knee joint is advantageous or detrimental compared with a mechanically controlled knee joint.
Participants. Inclusion criteria for study 1 were: age 18–75 years; use of upper leg prosthesis; completion of the rehabilitation programme; ability to walk at least 500 m. Exclusion criteria were: severe orthopaedic, rheumatological, neurological or cardiovascular disease that might impede performance; severe perceptual or cognitive disorders; and skin problems of the stump.
Twenty men and women with a unilateral transfemoral amputation participated. They were divided into 2 groups based on the prosthesis they were wearing. One group consisted of 10 persons wearing a prosthesis featuring a microprocessor stance and swing phase controlled knee joint (C-leg (Otto Bock, Vienna Austria)) (C-group).
The second group consisted of 10 persons wearing a prosthesis featuring a mechanically controlled knee joint (3R80, 3R72 (Otto Bock, Vienna, Austria), Safe Life (Proteval, Valenton, France), Ultimate (Ortho Europe, Oxfordshire, UK), Total Knee (Össur, Reykjavik, Iceland) and Graph-Lite (Teh Lin Prosthetics & Orthopaedics, Kuala Lumpur, Malaysia) (M-group).
Both groups had comparable functional performance levels and differed only as to the type of knee joint they were using.
Measurements. All participants completed circuit stations 1–9 (see Table I). For each of the different activities the performance time was recorded using a stopwatch.
Data analysis. The performance times on the different circuit stations were analysed using Mann-Whitney U tests. All statistical analyses were performed using SPSS 14 (SPSS Inc., Houston, Texas, USA).
Study 2
The aim of study 2 was to evaluate the concept of an ADAPT test in terms of its test-retest reliability, using the activities from subset B.
Participants. Twenty men and women (different from study 1) participated in study 2. The following inclusion criteria had to be met: unilateral transfemoral amputation; age 18–75 years; use of an upper leg prosthesis; completion of the rehabilitation programme; and the ability to walk at least 500 m. Exclusion criteria were: severe orthopaedic, rheumatological, neurological or cardiovascular diseases that might impede performance; perceptual or cognitive disorders; skin problems of the stump; and the use of a manual locking knee.
Measurements. Participants completed a subset of 9 circuit stations (subset B), i.e. stations 10 through 18 (Table II). After a 1 h resting period these circuit stations were repeated. Performance time was recorded for all activities of the different circuit stations using a stopwatch. All participants also completed the LCI questionnaire (8, 13).
Data analysis. Test-retest reliability was determined using Bland-Altman analyses (14) and by calculating Pearson’s correlation coefficients (r) between the performance time of the first and second measurement. Analyses were performed using SPSS 14 (SPSS Inc., Houston, Texas, USA).
RESULTS
Study 1
Participants. In total 20 participants with either a microprocessor-controlled knee joint (C-group) or a mechanically controlled knee joint (M-group) were included in study 1. All participants were experienced users of their leg prosthesis and had used the type of knee joint that was assessed for a long period of time. There was no significant difference between the two groups concerning age and post-amputation time. An overview of the composition of both groups is given in Table III.
| Table III. Composition of M-group and C-group in study 1 |
| Prosthesis type | Gender (n) | Age, years Mean (SD) | Post-amputation time, years Mean (SD) | Cause of amputation (n) |
| Male | Female | Trauma | Vascular | Cancer |
| M-group | 9 | 1 | 52.6 (14.3) | 14.0 (12.0) | 5 | 4 | 1 |
| C-group | 6 | 4 | 45.3 (14.8) | 18.8 (16.4) | 7 | 1 | 2 |
| M-group: mechanically controlled knee joint group; C-group: microprocessor-controlled knee joint group; SD: standard deviation. |
Performance times on the ADAPT test. An overview of the performance times for both the C-group and the M-group on circuit stations 1–9 is given in Table IV.
| Table IV. Mean performance time (in s), standard deviation (SD) and median values of 9 circuit stations (study 1) |
| Circuit station | Level of difficulty | M-group | C-group | p-value |
| Mean (SD) | Median | Mean (SD) | Median |
| 1 | Supermarket | “e” | 108.4 (29.4) | 99.5 | 79.7 (11.5) | 79.5 | 0.007* |
| “m” | 41.3 (14.2) | 37.0 | 30.3 (4.6) | 30.0 | 0.041* |
| “d” | 26.4 (5.5) | 26.0 | 24.1 (5.7) | 22.5 | 0.328 |
| 2 | Shopping bags | | 130.9 (45.7) | 123.5 | 91.7 (12.6) | 89.0 | 0.011* |
| 3 | Kitchen cabinets | “e” | 97.4 (46.6) | 95.0 | 70.1 (10.4) | 70.0 | 0.041* |
| “d” | 57.6 (4.5) | 58.5 | 39.4 (9.8) | 39.0 | 0.016* |
| 4 | Unloading low kitchen cabinets | “e” | 15.0 (5.2) | 14.5 | 12.1 (2.8) | 12.5 | 0.236 |
| “m” | 19.6 (6.7) | 18.0 | 16.1 (4.9) | 13.5 | 0.110 |
| “d” | 30.0 (13.4) | 28.0 | 24.5 (8.7) | 22.5 | 0.250 |
| 5 | Slalom (13 m) | | 36.9 (12.7) | 30.0 | 31.1 (7.5) | 30.0 | 0.385 |
| 6 | Get the remote control | “e” | 23.0 (11.9) | 18.5 | 15.3 (1.9) | 15.0 | 0.018* |
| “m” | 18.7 (5.8) | 16.0 | 14.1 (2.4) | 14.0 | 0.063 |
| “d” | 29.6 (23.6) | 20.5 | 17.9 (5.3) | 16.5 | 0.067 |
| 7 | Car | | 92.7 (45.3) | 77.0 | 58.8 (10.4) | 56.5 | 0.017* |
| 8 | Stairs decents | “e” | 31.3 (12.8) | 28.5 | 18.4 (5.9) | 16.5 | 0.012* |
| “m” | 32.6 (13.9) | 29.0 | 22.8 (7.0) | 23.5 | 0.086 |
| “d” | 36.5 (15.3) | 33.0 | 26.0 (2.6) | 25.5 | 0.201 |
| 9 | Slope descent and ascent (10 m) | “e” | 15.6 (5.2) | 13.5 | 13.1 (2.6) | 12.5 | 0.225 |
| “m” | 16.3 (5.2) | 14.5 | 13.7 (3.0) | 13.0 | 0.226 |
| “d” | 15.0 (2.3) | 14.5 | 13.9 (3.6) | 12.0 | 0.293 |
| ”e”: easy; ”m”: moderate; ”d”: difficult. *Statistically significant. |
All activities of the circuit stations 1–9 were performed faster by the C-group than the M-group. Filling a shopping trolley in the supermarket (activity 1: easy and moderate level), filling shopping bags (activity 2), putting items in the designated kitchen cabinets (activity 3), sitting down and rising from a low chair (activity 6: easy level), getting in and out of a car (activity 7) and walking down the stairs (activity 8: easy level) were performed significantly faster by the C-group in contrast to the M-group. The performance times on the other circuit stations were also shorter for the C-group compared with the M-group, but these differences did not attain statistical significance.
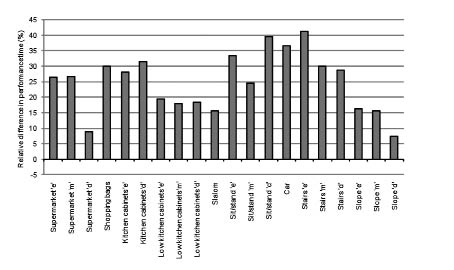
The mean differences in performance times of the C-group relative to the M-group on the different circuit stations are shown in Fig. 1. The mean performance times for all activities of the M-group are used as reference values (set at 0%). The vertical bars represent the relative differences in performance time between the C-group and the M-group (1-(PTMicroprocessor / PTMechanical)) × 100%). For example, the activity “Supermarket 1” is performed 26.5% faster by the C-group compared with the M-group. The C-group is faster on every activity of this test ranging from 7% to 41% compared with the M-group.
Fig. 1. Mean relative differences in performance time (%) of the group with a microprocessor-controlled knee joint (C-group) compared with the group with a mechanically controlled knee joint (M-group) (study 1). “e”: easy; “m”: moderate; “d”: difficult.
Study 2
Participants. Study 2 included 20 participants. An overview of the group composition is shown in Table V.
| Table V. Group composition in study 2 |
| Gender (n) | Age, years Mean (SD) | Post-amputation time, years Mean (SD) | Cause of amputation (n) |
| Male | Female | Trauma | Vascular | Cancer |
| 18 | 2 | 50.3 (10.7) | 15.6 (12.3) | 12 | 6 | 2 |
| SD: standard deviation. |
Test-retest reliability. Participants performed activities 10–18 twice. Mean performance times for both the first and second attempt on these activities are shown in Table VI. Mean differences in performance time between the first and second measurement (∆ PT) varied between +0.7 and +11.0 sec, depending on the total duration of the circuit station involved.
| Table VI. Mean performance times for all circuit stations for both measurements (study 2) |
| | Circuit station | Measurement 1 Mean PT (SD) | Measurement 2 Mean PT (SD) | ∆ PT Mean (SD) | Pearson’s r |
| 10 | Slope descent and ascent (72 m) | “Easy” | 91.1 (20.5) | 88.6 (21.4) | 2.5 (11.2) | 0.96 |
| “Moderate” | 92.3 (19.8) | 89.4 (18.8) | 2.9 (13.1) | 0.94 |
| 11 | Theatre | 47.1 (10.6) | 40.5 (8.1) | 6.5 (9.2) | 0.91 |
| 12 | Slalom (32 m) | 86.6 (16.7) | 80.6 (13.6) | 6.0 (15.0) | 0.90 |
| 13a | Bedroom – taking off prosthesis | 36.3 (10.3) | 33.2 (9.7) | 3.0 (10.0) | 0.88 |
| 13b | Bedroom – putting on prosthesis + going to toilet | 122.9 (38.4) | 116.4 (29.3) | 6.5 (29.0) | 0.94 |
| 13c | Bedroom – stripping the bed | 36.1 (11.8) | 31.1 (6.8) | 5.0 (17.3) | 0.69 |
| 14 | Hanging out laundry | 127.0 (23.2) | 116.0 (20.2) | 11.0 (18.9) | 0.91 |
| 15 | Picking up objects from the floor | 124.0 (20.1) | 117.7 (19.0) | 6.3 (23.7) | 0.82 |
| 16 | Obstacle avoidance | 84.2 (19.5) | 77.6 (16.3) | 6.6 (13.1) | 0.95 |
| 17 | Sitting down and standing up from the floor | 8.6 (3.3) | 7.9 (3.0) | 0.7 (2.0) | 0.95 |
| 18 | Dressing and changing clothes | 92.9 (38.0) | 90.7 (36.8) | 2.2 (26.1) | 0.94 |
| PT: performance time (s); ∆PT: difference in performance time between measurement 1 and measurement 2 (s); SD: standard deviation(s); Pearson’s r: correlation coefficient. |
All correlation coefficients (Pearson’s r) exceeded 0.80, except for activity 13c (r = 0.69). In 75% of all circuit stations Pearson’s r was ≥ 0.90.
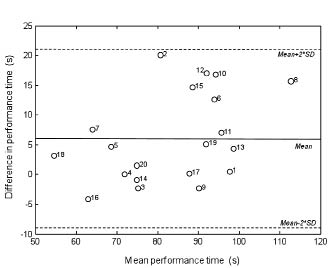
The mean difference in performance time between measurements 1 and 2 was assessed using the Bland-Altman procedure (14). Fig. 2 shows a typical example of a Bland-Altman plot. The mean performance times of measurements 1 and 2 for this specific circuit station activity are plotted against the differences in performance times of the two measurements for all participants.
Fig. 2. Typical example of a Bland-Altman plot for the activity slalom (32 m) (study 2). SD: standard deviation.
Results from the Bland-Altman analyses showed no specific trend between mean time scores on the one hand and test-retest differences in time scores on the other hand.
LCI vs ADAPT. The LCI values of all participants are represented in Table VII.
| Table VII. Frequency of Locomotor Capabilities Index (LCI) scores for all participants in study 2 |
| LCI score | < 36 | 36 | 37 | 38 | 39 | 40 | 41 | 42 |
| Frequency (#) | 0 | 3 | 0 | 0 | 1 | 1 | 1 | 14 |
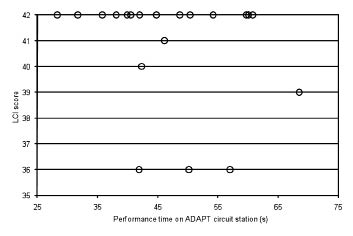
It should be noted that in 70% of all cases LCI values were maximal, indicating a ceiling effect. On the other hand, the scores on this second test version of ADAPT did not show such effects, i.e. between-subject variation was still observed in ADAPT scores of those 14 participants that scored maximal on the LCI. This is supported by the calculated Coefficient of Variation values (CV) of all ADAPT test circuit stations for the subgroup of these 14 participants. The CV is a normalized measure of dispersion, defined as the ratio of the standard deviation to the mean (σ/μ). The CV values range from 0.14 to 0.47 for ADAPT, whereas no variation was present in the LCI for those participants.
A typical example of the difference between the LCI scores and the scores on one circuit station is given in Fig. 3. The performance times (s) on circuit station “theatre” are plotted against the LCI scores for all participants.
Fig. 3. Typical example of circuit station (Theatre) scores vs Locomotor Capabilities Index (LCI) scores (study 2).
DISCUSSION
This study evaluated the feasibility of implementing a new concept into a measuring tool to objectively assess functional abilities of transfemoral amputees in daily life performance. The goal was to establish “proof of principle” of a measuring tool based on this new concept by using two separate consecutive studies in which two important requirements were evaluated, i.e. ability to differentiate between functional performance levels (sensitivity) and the level of reproducibility (test-retest reliability). In each of these two studies a different test version of the ADAPT test was evaluated.
Study 1 was performed to assess whether the ADAPT concept could detect differences in functional performance levels due to the use of different prosthetic components. The choice to compare mechanically controlled knee joints with microprocessor-controlled knee joints was made based on the findings of a study by Hafner et al. (1). They reported advantageous effects of microprocessor-controlled knee joints on functional performance levels during stairs descent, hill descent and obstacle course performance. Moreover, other studies show benefits from using a microprocessor-controlled knee joint at function level, e.g. positive influence on gait parameters (6, 7), energy consumption (15, 16), stability and balance-related aspects (6, 17) and cognitive load (18). The results of study 1 showed clear differences in functional performance levels between the group of microprocessor-controlled knee joint users (C-group) compared with the group of mechanically controlled knee joint users (M-group) in favour of the C-group. Statistical testing indicated no significant difference between both groups regarding age and post-amputation time. The ratio between men and women slightly differed between the M-group and the C-group. However, no studies have been found that indicate gender being a factor for performance differences in persons using a leg prosthesis.
The slightly higher number of amputees due to vascular causes in the M-group might also have led, to a certain extent, to the observed differences in performance level between both groups because of the decreased physical fitness of dysvascular patients. The test version of the ADAPT test, consisting of subset A circuit stations, was able to detect differences in functional performance between the two groups of prosthesis users.
Study 1 led to increased insight regarding the design of the circuit stations. Two main factors proved to be important in developing ADAPT test circuit stations. First, a circuit station activity should represent a real-life situation of adequate duration. Including circuit stations of short duration would inevitably lead to larger variances regarding performance time measurements when performing the test multiple times. Secondly, when developing a circuit station it should be taken into account that the number of different ways in which a participant can accomplish the activity is as small as possible. This reduces the level of variance and thus increases the quality of the test. Based on this knowledge some existing circuit stations from subset A were modified and were added to a new set of circuit stations to constitute subset B used in study 2.
In study 2 the aim was to assess the level of reproducibility of the ADAPT concept.
Strong correlations (Pearson’s r) in combination with high levels of agreement (Bland-Altman plots) between the first and second test results for all circuit stations were found. Furthermore, small differences in performance time were seen between the two attempts on this second test version of the ADAPT test. These differences are probably not the result of a definite training effect, since the circuit stations consist of common daily activities. Therefore, these activities have been “trained” many times before participating in the study. Performance is therefore not expected to improve after only 1 h. The observed differences will probably be the result of familiarization of the measuring protocol. This effect might be avoided by giving the participant more time to become acquainted with the circumstances of the test by, for instance, introducing a test run prior to the actual measurement.
In general, results indicate that the reliability of this version of the ADAPT test is very good.
Evaluation of functional abilities necessary to perform basic or advanced common daily activities is also the goal of the LCI (19). To place the ADAPT test results in a broader perspective, they were compared with the LCI scores. However, LCI scores were maximal in 70% of the participants, indicating a ceiling effect. In contrast, the ADAPT test results showed clear differences per circuit station, even in those patients in which the LCI score was maximal. The LCI ceiling effect has already been reported by Miller et al. (20). They stated that, because of the ceiling effect found for the LCI, no change can be observed in higher functioning prosthesis users. They suggest the LCI is more appropriate for a less active group of amputees with multiple co-morbidities. Franchignoni et al. imply that the LCI is suitable to detect differences in locomotor capabilities between persons of different amputation levels, e.g. between transfemoral and trans-tibial amputees (21). The findings of the studies of Miller et al. and Franchignoni et al. further emphasize the need for a test capable of better differentiating between different levels of functional performance. Our findings show that the ADAPT test, in contrast to the LCI, may be more sensitive to small differences and, furthermore, may detect differences within a particular performance domain.
The results of this study indicate that it is feasible to objectively measure functional abilities in daily life in transfemoral amputees using the concept of simulated daily life situations. It is now possible to develop a final version of the ADAPT test, knowing that the concept has proven to be reliable and sensitive to small changes. This final version should encompass a selection of circuit stations tested in this study, which indicated small levels of variance and a high capacity to distinguish between performance levels. Based on these characteristics, recommendations for circuit stations that should be included in the final ADAPT test are: supermarket shopping (activities 1 and 2), unloading of the shopping bags into the kitchen cabinets (activity 3), fetching the remote control (activity 6), getting into and out of a car (activity 7), negotiating stairs (activity 8) and the long slope (activity 10), going to the theatre (activity 11), picking up and hanging out laundry (activity 14) and avoiding obstacles in the living room (activity 16).
Further research is necessary to establish the psychometric properties of the final ADAPT test.
The practical aspects of using an ADAPT test are considered to be clinically feasible. Conducting the test took approximately 45 min, including resting periods and the time to explain the tasks. An area of approximately 150 m2 is necessary to set up all (indoor) circuit stations.
Currently, decision-making in prosthesis indication in the Netherlands is based mainly on the experience and empirical knowledge of the technical team, consisting of the prosthetist, the rehabilitation physician and the physical therapist (22). The ADAPT test may assist in this process by generating an individual patient profile showing the performance levels on a selected set of different daily life activities. Such an overview can consist of relative differences in performance level between, for instance, two (or more) trial prostheses (analogous to Fig. 1) used by a patient prior to final indication. Applying this “try-out” approach may provide valuable additional information as to the possible benefit (or, in some cases, detriment) of the use of different types of prosthetic knee joints during certain daily life activities. It may therefore be used, in conjunction with other clinical measures, to make a well-founded, client-specific decision about the choice for a prosthesis in upper leg amputees. Although the use of prosthetic components for trial purposes is not currently possible in many countries, the process of providing the most suitable prosthesis to a patient may further improve if trial fitting could become part of the prescription process.
In addition, results of the ADAPT concept provide objective data that may be used in the dialogue between healthcare providers, patients and health insurance companies in, for example, the reimbursement process for a prosthesis.
An important aspect of the ADAPT test is that it measures at a level that is relevant to the patient. The included activities are relevant to the subjects because they are performed on a daily basis. Often, patients report mainly being interested in what they eventually can do with the prosthesis in everyday life and that they are focused on returning to their former social roles.
The ADAPT test concept might also be used to evaluate different target populations, including, for example, stroke patients. For each target population, adaptations on the existing ADAPT test circuit stations should be considered, because every group of patients has its own specific functional problems (e.g. walking, arm/hand skills or balance). Further research is necessary to expand the number and type of daily activities in the test in order to best suit each target population. Furthermore, a future goal is to create a set of validated circuit stations from which those activities can be chosen that best fit the individual needs of a patient in their home environment. Consequently, a unique test can be created for each individual that focuses on aspects of daily functioning that are perceived to be most important to that patient. It is this concept that has been tested in the current study.
ACKNOWLEDGEMENTS
The authors would like to thank Peter Schraven and Sven Balk of Adelante Rehabilitation Centre, and Frans Rings of Livit Orthopedie, Hoensbroek, The Netherlands for their valuable contribution to this study.
The corresponding author can provide more detailed information on both versions of the ADAPT test.
REFERENCES