OBJECTIVE: To assess the cost-utility of an exercise programme vs usual care after functional multidisciplinary rehabilitation in patients with chronic low back pain.
DESIGN: Cost-utility analysis alongside a randomized controlled trial.
SUBJECTS/PATIENTS: A total of 105 patients with chronic low back pain.
METHODS: Chronic low back pain patients completing a 3-week functional multidisciplinary rehabilitation were randomized to either a 3-month exercise programme (n = 56) or usual care (n = 49). The exercise programme consisted of 24 training sessions during 12 weeks. At the end of functional multidisciplinary rehabilitation and at 1-year follow-up quality of life was measured with the SF-36 questionnaire, converted into utilities and transformed into quality-adjusted life years. Direct and indirect monthly costs were measured using cost diaries. The incremental cost-effectiveness ratio was calculated as the incremental cost of the exercise programme divided by the difference in quality-adjusted life years between both groups.
RESULTS: Quality of life improved significantly at 1-year follow-up in both groups. Similarly, both groups significantly reduced total monthly costs over time. No significant difference was observed between groups. The incremental cost-effectiveness ratio was 79,270 euros.
CONCLUSION: Adding an exercise programme after functional multidisciplinary rehabilitation compared with usual care does not offer significant long-term benefits in quality of life and direct and indirect costs.
Key words: chronic low back pain; multidisciplinary rehabilitation; exercise; economic analysis; cost-utility analysis.
J Rehabil Med 2010; 42: 846–852
Correspondence address: Yves Henchoz, University of Lausanne, Institute of Sport Sciences of the University of Lausanne, Bâtiment Vidy, CH-1015 Lausanne. Switzerland. E-mail: yves.henchoz@unil.ch
Submitted December 12, 2009; accepted July 14, 2010
INTRODUCTION
Chronic low back pain is one of the most common complaints in the working-age population. From the patient’s perspective it leads to reduced income and quality of life. From a societal perspective it is responsible for a major economic burden on the healthcare system. Musculoskeletal pain accounts for a loss of 1–2% of the gross national product in western countries (1). In Switzerland, musculoskeletal disorders are the second most common reason for visits to the general practitioner (2). Disabling cases of low back pain represent only 10% of all cases, but account for 85% of total costs (3, 4).
In order to reduce costs, the most important strategy consists in preventing acute cases (< 6 weeks) becoming chronic (> 3 months), and in reducing disability and absenteeism from work. Therefore, functional restoration was developed in the 1980s in the USA (5). In a recent systematic review on the long-term effect of multidisciplinary back training for people with chronic low back pain, van Geen et al. (6) found a positive effect on work participation and a possible positive effect on quality of life. Economic aspects were addressed by a few studies. In the USA, Gatchel et al. (7) clearly demonstrated cost-effectiveness of an early multidisciplinary intervention in acute low back pain patients who were identified as being at high risk for developing chronicity. In Europe, Goossens et al. (8) showed that adding a cognitive component to an operant treatment did not lead to significant differences in costs when compared with the operant treatment alone. Both interventions were found to be cost-saving compared with a control group. In contrast, Schweikert et al. (9) found that the costs associated with the addition of cognitive-behavioural treatment to standard therapy were largely compensated for by lower indirect costs. Skouen et al. (10) found evidence of cost-effectiveness of a light multidisciplinary treatment compared with usual care for men, but not for women. van der Roer et al. (11) found no significant difference in cost-effectiveness between an intensive group training protocol and usual care.
Exercise has a potential role in maintaining long-term improvements after guided active treatment (12). It is well established that adherence to exercise is improved if supervision is provided (13, 14), but it is not known whether the benefits of an additional exercise programme after guided active treatment are worth the costs.
The present study aimed to compare the impact of an exercise programme (EP) vs usual care (UC) after functional multidisciplinary rehabilitation (FMR) on long-term costs and quality of life.
METHODS
Study design
A prospective economic evaluation was conducted alongside a randomized controlled trial (15) and was approved by the local ethics committee of the Faculty of Biology and Medicine, University of Lausanne, Switzerland.
Patients
Patients with subacute or chronic low back pain were referred by their primary care physician to physicians of the spine and rehabilitation unit, where the appropriateness of FMR was assessed by an interview and a physical evaluation. Criteria for inclusion to FMR were subacute or chronic low back pain without irritative neurological deficit, Krause classification phases 2–6 (16) (see explanation below), and age range 18–60 years. Criteria for exclusion of FMR were: phases 7 and 8 of the Krause classification, acute neurological deficit in progress, sciatica, acute inflammatory rheumatic disease, non-osteoarticular thoracic pain, tumour, spinal fracture within the last 3 months, osteoporosis, severe heart or respiratory failure, active psychiatric disorder, active drug addiction, pregnancy, entitlement to a total disability pension and current involvement in litigation related to low back pain. The Krause classification is organized into 8 consecutive phases determined by the presence and duration of work disability (16). Phase 2 begins with the first formal report of low back pain. Phases 7 and 8 are defined as not being able to perform pre-injury employment at regular pre-injury working hours for more than 6 months and 18 months, respectively. Criteria for inclusion to EP or UC groups matched those for inclusion in FMR. In addition, patients had to be available to attend exercise classes twice a week for a period of 12 weeks. This criterion was selected to limit the drop-out rate in the EP group.
After giving written informed consent on completion of FMR, patients were randomly allocated in blocks of 1–5 to either EP or UC. The random allocation of patients was performed by sequentially numbered envelopes prepared in advance by a person who was not involved in the study.
Interventions
FMR consisted of a 3-week outpatient multidisciplinary rehabilitation. Groups of 5 patients were treated from Monday to Friday for 5–7 h per day. Individually tailored pharmacotherapy and regular follow-up was provided to each patient by a physician. FMR included exercises (muscle strengthening, cardiovascular endurance and stretching), ergonomics, one-to-one and group psychosocial interventions, relaxation group therapy, and information.
Patients allocated to EP attended 24 group training sessions during 12 weeks. EP consisted of group (5–10 patients), submaximal exercises supervised by a sports therapist. Each session was 90 min long, including warm-up, muscle strengthening, aerobic exercise and passive stretching. More details are given in a previous publication (15).
Patients allocated to UC were advised to exercise regularly. They were given a written description of the exercises practised during FMR and recommended to continue at home.
Health-related quality of life
Quality of life was measured at the end of FMR and one year after the end of EP/UC, using the MOS 36-item Short-Form Health Survey (SF-36). The SF-36 is a self-administered questionnaire and was shown to be a sensitive measure of treatment success in patients with low back pain (17). It contains 36 items grouped into 8 subscales: physical functioning, physical role, bodily pain, general health, vitality, social functioning, emotional role, and mental health. Each subscale ranges from 0 (worst health state) to 100 (best health state). A physical component score and a mental component score can be derived from the 8 subscales. The French version of the SF-36 questionnaire, used in the present study, has been validated (18, 19).
Resource use
The economic analysis was performed from a societal perspective, with all relevant costs and effects being measured, regardless of who pays the costs and who benefits from the effects (20). Data on resource use were collected by prospective cost diaries (21), which were completed by patients for a period of 4 consecutive weeks before FMR and one year after the end of EP/UC. Included categories were medication use (defined as having consumed one or more drugs during the period covered by the diary), days off work because of low back pain, as well as visits to general practitioners, specialists, physiotherapists and other therapists (e.g. acupuncture, massage, manipulative therapy). Days off work were handled as reported by patients, regardless of work status. Patients who did not return the SF-36 questionnaire or the cost diary were sent a reminder by a research assistant and then contacted by telephone.
Costs
General practitioner, specialists and visits to other therapies were translated into costs using the official Swiss medical tariff system (TARMED, Version 01.05.03) (22), taking into account local particularities. Physiotherapy visits were computed as a fixed rate according to the Swiss physiotherapy association (23). Medication costs were not taken into account, but have been reported elsewhere to represent only approximately 1% of direct costs in the chronic low back pain population (9, 11). Days off work were converted into costs according to the age- and sex-adjusted mean gross monthly salary (24) and by taking into account 20 working days per month. The cost of EP was evaluated and expressed as cost per patient. Included cost categories were sport therapists fees, place rental and transport charges. All costs are expressed in euros according to an exchange rate of €0.6757 for 1 Swiss Franc.
Economic analyses
The SF-36 values were converted into health state utilities according to the method developed by Brazier et al. (25), using a set of non-parametric Bayesian preference weights (26). Health state utilities were transformed into quality adjusted life years (QALYs) by using the area-under-the-curve method (27), assuming a linear evolution over time as commonly suggested (28). The incremental cost-effectiveness ratio (ICER) was calculated as the incremental cost of EP divided by the difference in QALYs between the EP group and the UC group.
Sensitivity analyses
Missing data may introduce bias and reduce the power of the analysis. To explore the robustness of the results, a first sensitivity analysis was performed in which missing data were imputed using the Expectation Maximization algorithm (SPSS 16.0.1). This was done only for cases with some follow-up data available. Secondly, the estimation of the cost of EP was based on several assumptions. The effect of a 25% increase and a 25% decrease in sport therapists’ fees and transport charges on the results was investigated. Thirdly, to account for a possible difference in total costs between EP and UC during the period covered by the study (∆costs), a sensitivity analysis was carried out with the numerator of the ICER as the sum of the cost of EP and ∆costs. A linear evolution of EP and UC total costs from baseline to one-year follow-up was assumed to compute ∆costs using the area under the curve method, and correcting values for baseline data.
Statistical analysis
All variables were checked for normal distribution by Kolmogorov-Smirnov one-sample test. Parametric and non-parametric methods were used for the SF-36 and costs variables respectively. Between-groups comparisons were carried out by independent samples t-test or Mann-Whitney U test for unpaired data, except for categorical variables for which Goodman and Kruskal tau test was used. Within-groups changes were assessed by paired samples t-test or Wilcoxon signed-rank test, except for the variable “Medication use”, for which McNemar test was used. According to the “intention-to-treat” (ITT) principle, analyses were performed using all randomized participants who provided any follow-up data. Statistical analyses were carried out with SPSS 16.0.1 (Chicago, USA) with statistical significance assumed for p ≤ 0.05.
RESULTS
Patients
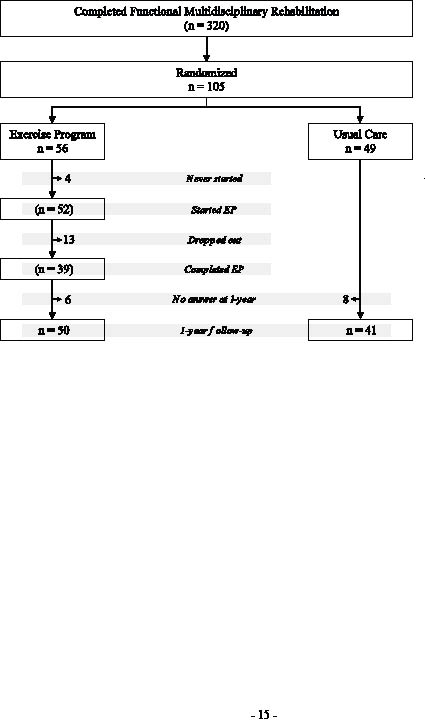
Fig. 1 shows the study flow-chart. A total of 105 patients who had completed FMR were randomized to either EP (n = 56) or UC (n = 49). Baseline characteristics are displayed in Table I. No significant difference was found between groups.
Fig. 1. Patient flow-chart for the study. EP: exercise programme.
| Table I. Baseline characteristics of subjects |
| | Exercise programme | Usual care | p-value* |
| Age, years, mean (SD) | 41.1 (10.6) | 39.3 (9.1) | 0.349 |
| Gender, % | | | |
| Males | 66.1 | 55.1 | 0.253 |
| Females | 33.9 | 44.9 | |
| Back pain, VAS (%) | 53.2 (18.3) | 50.9 (22.5) | 0.567 |
| Employment category, % | | | |
| Heavy manual work | 7.1 | 6.1 | 0.817 |
| Manual work | 48.2 | 55.1 | |
| Sedentary work | 41.1 | 36.7 | |
| Unemployed | 3.6 | 2.0 | |
| Work status, % | | | |
| Not working | 12.8 | 7.5 | 0.202 |
| Working part time | 23.4 | 35.0 | |
| Working full time | 63.8 | 57.5 | |
| Medication use, %Yes | 84.2 | 80.0 | 0.345 |
| *Based on independent samples t-test/Goodman and Kruskal tau test. SD: standard deviation; VAS: visual analogue scale. |
Health-related quality of life
At one-year follow-up, 89% of patients from the EP group and 84% of patients from the UC group returned the SF-36 questionnaire. Those who did not were significantly younger (p = 0.006) and more often separated (p = 0.008) at baseline. All other baseline variables were not significantly different. Table II shows that quality of life significantly improved at one-year follow-up in both groups, but that none of the 8 scales scores of the SF-36 was significantly different between EP and UC groups.
| Table II. SF-36 scores at the end of functional multidisciplinary rehabilitation (FMR) and at one-year follow-up |
| SF-36 components* | Exercise programme Mean (SD) | Usual care Mean (SD) | p-value** |
| Physical functioning |
| End of FMR | 64.4 (17.3) | 62.1 (21.8) | |
| 1-year follow-up | 71.7 (21.1) | 66.4 (25.5) | |
| Difference | +7.3 (21.2) | +4.3 (22.8) | 0.520 |
| ***p | 0.021 | 0.244 | |
| Role-physical | | | |
| End of FMR | 14.8 (30.6) | 13.6 (25.7) | |
| 1-year follow-up | 49.1 (44.3) | 47.9 (43.9) | |
| Difference | +34.7 (48.1) | +34.3 (49.2) | 0.973 |
| ***p | < 0.001 | < 0.001 | |
| Bodily pain | | | |
| End of FMR | 35.6 (15.2) | 36.6 (16.8) | |
| 1-year follow-up | 49.7 (22.8) | 49.1 (24.0) | |
| Difference | +14.1 (24.7) | +12.5 (23.1) | 0.759 |
| ***p | < 0.001 | 0.001 | |
| General health perception | | |
| End of FMR | 55.5 (19.5) | 49.7 (17.7) | |
| 1-year follow-up | 55.3 (24.0) | 52.7 (25.1) | |
| Difference | –0.3 (20.7) | +4.2 (20.5) | 0.312 |
| ***p | 0.925 | 0.202 | |
| Vitality | | | |
| End of FMR | 48.2 (17.0) | 44.4 (15.8) | |
| 1-year follow-up | 53.6 (21.3) | 50.6 (21.4) | |
| Difference | +5.4 (20.4) | +6.3 (21.2) | 0.846 |
| ***p | 0.073 | 0.069 | |
| Social functioning | | | |
| End of FMR | 56.0 (22.5) | 55.9 (23.0) | |
| 1-year follow-up | 68.5 (25.3) | 65.4 (28.7) | |
| Difference | +12.5 (26.9) | +9.4 (28.4) | 0.605 |
| ***p | 0.002 | 0.042 | |
| Role-emotional | | | |
| End of FMR | 50.5 (42.0) | 37.7 (40.7) | |
| 1-year follow-up | 67.6 (41.6) | 64.7 (43.3) | |
| Difference | +17.8 (39.9) | +25.3 (53.0) | 0.448 |
| ***p | 0.003 | 0.004 | |
| Mental health | | | |
| End of FMR | 60.4 (20.2) | 60.8 (18.6) | |
| 1-year follow-up | 65.9 (20.6) | 68.0 (22.0) | |
| Difference | +5.5 (21.0) | +7.3 (20.5) | 0.687 |
| ***p | 0.077 | 0.031 | |
| Physical Component Score | | |
| End of FMR | 36.1 (7.1) | 35.3 (7.5) | |
| 1-year follow-up | 41.3 (9.3) | 40.0 (10.0) | |
| Difference | +5.1 (9.5) | +4.7 (9.7) | 0.854 |
| ***p | 0.001 | 0.005 | |
| Mental Component Score | | |
| End of FMR | 43.1 (12.6) | 41.8 (10.2) | |
| 1-year follow-up | 46.8 (12.4) | 46.4 (13.2) | |
| Difference | +3.7 (11.5) | +4.6 (13.5) | 0.735 |
| ***p | 0.033 | 0.043 | |
| *All SF-36 scales range from 0 to 100. **Based on independent samples t-test. ***Based on paired samples t-test. SD: standard deviation; SF-36: Short-Form 36. |
Costs
At one-year follow-up, 73% of patients from the EP group and 57% of patients from the UC group returned the cost diary. Patients who did not return the cost diary at one-year were significantly younger (p = 0.038) and more often heavy manual workers (p = 0.018) than those who did. All other baseline variables, including total costs, were not significantly different. Resource use and corresponding monthly costs were not different between EP and UC groups at baseline (Table III).
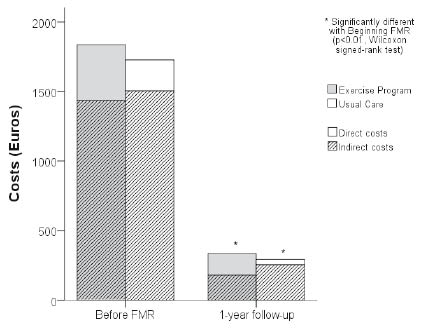
Fig. 2 shows that both EP (p < 0.001) and UC (p = 0.004) groups significantly reduced total monthly costs over time. A decrease of 82% and 83% was found for EP and UC groups, respectively. No significant difference was observed between EP and UC for direct and indirect monthly costs, as shown in Table IV. Although medication prevalence at one-year was not significantly different between the two groups, the McNemar test resulted in a significant reduction compared with baseline for the EP group (p = 0.013), but not for the UC group (p = 0.227). The cost of EP was €705 per patient.
| Table III. Resource use and corresponding monthly costs at baseline |
| | Exercise programme | Usual care | p-value* |
| Number of visits or days off work† Mean (SD) | Monthly costs (euros) Mean (SD) | Number of visits or days off work† Mean (SD) | Monthly costs (euros) Mean (SD) |
| Direct costs |
| General practitioner visits | 0.6 (0.8) | 41.0 (54.7) | 0.5 (0.9) | 31.7 (57.5) | 0.969 |
| Specialist visits | 0.8 (1.0) | 79.9 (95.2) | 1.1 (1.3) | 106.4 (123.6) | 0.997 |
| Physiotherapist visits | 4.0 (5.3) | 126.8 (165.7) | 2.3 (3.1) | 73.1 (96.5) | 0.974 |
| Other therapist visits | 1.5 (5.9) | 151.6 (598.5) | 0.1 (0.4) | 12.2 (44.8) | 0.269 |
| Indirect costs |
| Days off work | 6.9 (9.0) | 1435.1 (1903.9) | 8.2 (9.9) | 1504.2 (1882.0) | 0.700 |
| Total costs | | 1834.4 (2058.0) | | 1727.5 (1920.2) | 0.927 |
| †Days off work range from 0 to 20. *Based on Mann-Whitney U test. SD: standard deviation. |
Fig. 2. Direct and indirect monthly costs at baseline and at 1-year follow-up. FMR: functional multidisciplinary rehabilitation.
| Table IV. Resource use with corresponding monthly costs at 1-year follow-up and difference from baseline |
| | Exercise programme | Usual care | p-value* |
| Number of visits or days off work† | Monthly costs (euros) | Number of visits or days off work† | Monthly costs (euros) |
| At 1-year follow-up |
| Medication use, %Yes | 52.6 | | 60.0 | | 0.697 |
| Direct costs, mean (SD) |
| General practitioner visits | 0.3 (0.8) | 21.4 (54.0) | 0.2 (0.5) | 13.2 (33.0) | 0.617 |
| Specialist visits | 0.3 (0.8) | 26.6 (82.5) | 0.1 (0.4) | 11.8 (43.3) | 0.594 |
| Physiotherapist visits | 0.4 (1.3) | 11.1 (40.1) | 0.0 (0.2) | 1.3 (6.3) | 0.172 |
| Other therapist visits | 0.9 (3.5) | 96.5 (358.2) | 0.1 (0.4) | 12.2 (44.9) | 0.184 |
| Indirect costs, mean (SD) | | | | | |
| Days off work | 0.8 (2.5) | 179.3 (536.4) | 1.2 (4.2) | 255.0 (755.1) | 0.868 |
| Total costs, mean (SD) | | 334.8 (878.2) | | 293.5 (815.7) | 0.194 |
| Difference from baseline |
| Direct costs, mean (SD) |
| General practitioner visits | –0.3 (0.9) | –19.6 (60.0) | –0.3 (0.7) | –18.5 (48.6) | 0.553 |
| Specialist visits | –0.5 (1.1) | –53.2 (112.8) | –1.0 (1.3) | –94.5 (125.5) | 0.241 |
| Physiotherapist visits | –3.7 (5.1) | –115.7 (160.9) | –2.3 (3.0) | –71.8 (95.1) | 0.472 |
| Other therapist visits | –0.5 (7.0) | –55.1 (713.9) | 0.0 (0.6) | 0.0 (58.9) | 0.801 |
| Indirect costs, mean (SD) |
| Days off work | –6.1 (8.6) | –1255.9 (1763.1) | –7.0 (9.5) | –1249.2 (1835.5) | 0.857 |
| Total costs, mean (SD) | | –1499.6 (1887.2) | | –1434.0 (1704.6) | 0.829 |
| †Days off work range from 0 to 20. *Based on Mann-Whitney U test/Goodman and Kruskal tau test. SD: standard deviation. |
Economic analyses
The conversion of the SF-36 results in health state utilities led, respectively at the end of FMR and one year after the end of EP/UC, to 0.584 (95% confidence interval (CI), 0.564–0.605) and 0.629 (95% CI, 0.606–0.653) for the EP group and 0.593 (95% CI, 0.566–0.619) and 0.623 (95% CI, 0.585–0.662) for the UC group. One year after the end of EP/UC, QALYs gained by EP and UC groups were 0.028 (95% CI, 0.013–0.044) and 0.019 (95% CI, –0.004–0.042), respectively. This difference resulted in an ICER of EP vs UC of €79,270/QALY.
Sensitivity analyses
The Expectation Maximization algorithm was applied to all subjects with missing data, except 2 patients from the EP group and 1 patient from the UC group who did not return the SF-36 questionnaire, either at the end of FMR or 1 year after the end of EP/UC. Imputation of missing data led to QALYs gained by EP and UC groups of 0.027 (95% CI, 0.014–0.040) and 0.020 (95% CI, 0.003–0.037), respectively, with a resulting ICER of €101,080/QALY. The 25% increase or 25% decrease in sport therapists’ fees and transport charges led to an ICER of €96,354/QALY or €62,186/QALY, respectively. Imputation of missing direct and indirect monthly cost categories also resulted in a significant decrease over time and no significant difference between EP and UC direct and indirect monthly costs. The sensitivity analysis investigating the effect of the difference in total costs between EP and UC during the period covered by the study led to a ∆costs value of €492 in favour of EP, leading to an ICER of €24,026/QALY.
DISCUSSION
After FMR, an exercise programme, compared with usual care, is not cost-effective by usual standards (ICER < $50,000/QALY) (29).
The present study is, to our knowledge, the first cost-effectiveness analysis of an EP as a modality to maintain treatment improvements over time. Patients who completed FMR and were allocated to EP could attend the programme without delay, which was useful to reinforce immediately the benefits of FMR and help patients in including exercise in their everyday lives. In our original randomized controlled trial (15), this advantage was shown to improve disability and trunk muscle endurance at one-year follow-up. However, these functional improvements did not translate into a significant economic benefit. The results may have been influenced by the fact that patients enrolled in the study were potentially more motivated to continue exercising after FMR than the others. From Fig. 1, it appears that 105 out of the 320 patients who completed FMR were included in the study. The main reasons for not being willing to participate were living too far from EP location or professional constraints. Further investigations could determine if an EP specifically adapted to patients who are not likely to continue exercising on their own after FMR would be cost-effective compared with usual care. One strength of the study is that it used a validated questionnaire of quality of life that permitted the conversion into utilities using validated algorithms. In both EP and UC groups, the values of each SF-36 subscale at the end of FMR were in the range of the values obtained by Gatchel et al. (30) at the end of a similar functional restoration programme. The improvements obtained at one-year follow-up are in line with another study including a similar FMR programme (31). The values of the 8 subscales, as well as the physical and mental component scores, are also comparable to the present study. It is worth noting that a large proportion of the results in SF-36 seem to be related to the two “role” scales. The changes in the 6 other scales tend to be smaller and perhaps not clinically relevant. The large variability is in the range of values obtained in other studies, whose role scales’ SDs are also larger than the other scales’ SDs (31–33).
Goossens et al. (21) showed that there was no significant difference in costs between data collected over a whole year and the extrapolation from a limited period, either from two weeks every two months or from 3 months a year. In the present study, patients were asked to complete a diary during two 4-week periods (e.g. before FMR and at one-year follow-up). This choice was made in order to reduce the burden for patients. Direct monthly costs at one-year follow-up appear to be higher for the EP group compared with the UC group. Due to large inter-individual variations this difference was, however, not significant. The EP group may have been encouraged to use healthcare services, or better informed, throughout the discussions they had before and after each session of EP.
The large decrease in monthly costs over time and the quality of life improvements found in both groups denote improvements after FMR alone, though this must be interpreted with caution because of the absence of a control group that did not receive FMR. This reinforces the positive effects on return-to-work status at one-year follow-up obtained in a non-randomized open prospective study in Switzerland with a similar FMR (34). In a randomized controlled trial, another Swiss group obtained a significantly increased number of days at work at one-year follow-up for a function-centred compared with a pain-centred 3-week inpatient programme (35). At 3-year follow-up total costs of both study groups were similar (36). In contrast, the randomized controlled trial of van der Roer et al. (11) did not provide evidence of cost-effectiveness of an intensive group training protocol compared with usual care physiotherapy. However, substantial dissimilarities exist between the content of this protocol, which was considered by the authors to be mono-disciplinary and had a total duration of 30 weeks, and the FMR content usually described in the literature.
There are limitations in the present study. First, the absence of a power calculation could have weakened the results. This is often encountered in cost-effectiveness studies because an appropriately powered trial requires a much larger sample size than in a clinical effectiveness trial (20). Although a sample size calculation for a cost-effectiveness study is technically possible, its usefulness is open to controversy (37). A second limitation of the study is the high number of missing diaries at one-year follow-up (27% in patients from the EP group and 43% in patients from the UC group), despite the substantial effort put on collecting complete cost diaries. A possible explanation could be a lack of motivation in completing and sending back the diary, especially for patients in the UC group. This was reinforced, qualitatively, by the observation that most of patients allocated to the UC group would have preferred the EP group, although patients’ preference was not systematically measured. Unfortunately the one-year follow-up made a cross-over design impossible. Hypothesizing that patients lost to follow-up are associated with poor outcomes compared with responders, the larger proportion of missing data in the UC group compared with the EP group may have lowered their measured improvements. Although non-responders were significantly younger and more often heavy manual workers than responders, the sensitivity analysis showed that the imputation of missing cost diaries did not change the results.
In conclusion, adding an exercise programme after FMR compared with usual care does not offer significant long-term benefits in terms of quality of life and direct and indirect costs. Chronic low back pain patients completing FMR should therefore not be routinely referred to an exercise programme afterwards. A future area of research may be to identify subgroups of patients for which an exercise programme after FMR could be cost-effective. Patients’ preferences, as well as the rate of improvement after FMR, are likely to play a role.
ACKNOWLEDGEMENT
The authors thank Jean-Edouard Dousse for his help in managing the economic data.
REFERENCES