OBJECTIVE: To investigate the occurrence of semantic, phonological and syntactic deficits in acute aphasia with the ScreeLing after the establishment of its psychometric properties. To examine the relationship between these deficits and: (i) overall aphasia severity; and (ii) quality of Spontaneous Speech.
METHODS: The reliability and validity of the ScreeLing was established by investigating 141 subjects with acute aphasia (2 weeks after stroke), 23 with chronic aphasia, and 138 healthy controls. In addition, the acute patients were assessed with the Token Test and a Spontaneous Speech rating (Aphasia Severity Rating Scale).
RESULTS: The ScreeLing was found to be valid and reliable for assessing the presence and severity of aphasia and linguistic deficits at 12 days after stroke. In 22.4% of the patients deficits were found in only 1 of the 3 linguistic levels; phonology was most frequently disturbed (16.3%), compared with semantics (2.7%), and syntax (3.4%). The number of impaired linguistic levels was related to aphasia severity: patients with a 3-level disorder had the lowest Token Test scores; patients with a selective phonological disorder had the highest Spontaneous Speech ratings. Phonology alone explained 54.6% of the variance in the Spontaneous Speech rating.
CONCLUSION: In the acute stage, linguistic-level deficits are already present independently of each other, with phonology affected most frequently.
Key words: aphasia; language disorders; diagnosis; cerebrovascular accident; screening test; semantics; phonetics.
J Rehabil Med 2012; 00: 00–00
Correspondence address: Hanane El Hachioui, Erasmus MC University Medical Center, Department of Neurology, Room EE 2291, PO Box 2040, 3000 CA Rotterdam, The Netherlands. E-mail: h.hachiouiel@erasmusmc.nl
Submitted September 30, 2011; accepted December 13, 2011
INTRODUCTION
The prognosis of aphasia after stroke depends largely on its initial severity (1–3), but other factors may also play an important role (2, 4). Regression models have so far explained only part of the variance of the outcome of aphasia (2, 5), indicating that other prognostic factors have not yet been discovered. For example, the nature of the linguistic disorder may be an important prognostic factor for aphasia outcome.
The only data available are about the frequencies of aphasia subtypes in acute stroke, and these are inconsistent. For instance, the reported incidence of Broca’s aphasia varies from 11% to 22% (5–7), probably due to the fact that classification of aphasia is difficult in the acute stage. Many patients are not classifiable according to classic aphasia syndromes (6) and during the first weeks after stroke these syndromes tend to change.
It has been reported that domain-specific cognitive functions are good predictors for long-term cognitive outcome (8). In addition, the prevalence of domain-specific cognitive deficits in the acute stage after stroke has been established (9). For aphasia, this information is unknown. In order to explore whether the core linguistic components of language production and comprehension, i.e. semantics, phonology and syntax, are relevant prognostic factors, detailed information is first needed on the nature and occurrence of linguistic-level deficits. This information is lacking in the acute stage because of the lack of tests providing a specific linguistic-level diagnosis suitable for administration in the early stages after stroke when time-consuming tests are too much of a burden. The existing screening tools for acute aphasia usually reflect the approach taken in traditional aphasia test batteries that assess language modalities such as comprehension and reading (10, 11), and are not aimed at the linguistic-level deficits.
To the best of our knowledge, the only linguistic screening test designed to assess the presence of aphasia and to differentiate linguistic-level disorders in the acute stage is the ScreeLing. In a small group study (n = 17) 30% of the patients showed selective linguistic disorders on a research version of this test (12). The test has been refined; less accurate subtests have been replaced and, based on item analysis, further adjustments have been made in order to enhance its clinical value (see Appendix I for further details) (13).
Information on the occurrence of linguistic-level disorders may be important for several reasons. Establishing the occurrence of linguistic deficits in the acute stage will provide more insight into early recovery patterns. Discovering which linguistic deficits are persistent and which may recover spontaneously provides a basis for the selection of additional, more comprehensive assessment, which may result in a better guidance during the treatment course. Furthermore, insight into the occurrence of linguistic-level deficits in the acute stage may be used to examine the impact of early linguistic profiles on final outcome.
The aims of this study were: (i) to report on the psychometric properties of the revised ScreeLing; (ii) to investigate the occurrence of linguistic-level deficits in a large group of patients with aphasia at 2 weeks after stroke; and (iii) to determine the relationship between linguistic-level deficits and overall aphasia severity, as well as the verbal abilities in spontaneous speech.
METHODS
Participants
Acute aphasia patients. Patients were recruited from the stroke units of 17 hospitals in the Netherlands, and screened by the local neurologist (based on clinical examination) and speech-language therapist (SLT) (based on an interview). Inclusion criteria were: adult Dutch native/near-native speaker (i.e. education in Dutch started from early childhood and primary use of the Dutch language in everyday life); aphasia after a first-ever intracerebral haemorrhage or infarction; and testable with the ScreeLing (13) between 2 days and 2 weeks after stroke (i.e. alert during the administration of the test and not too ill to tolerate at least 15 min of the ScreeLing assessment; it was also allowed to administer the 3 linguistic components in a maximum of 3 test sessions if completed within 2 consecutive days). Exclusion criteria were: pre-stroke dementia (suspected or confirmed); severe dysarthria; developmental dyslexia; severe impairment of vision and hearing (based on the medical history and standard clinical examination by the attending physician); illiteracy; and psychiatric disorder.
Chronic aphasia patients. Adult Dutch native/near-native speakers (i.e. education in Dutch started from early childhood and primary use of the Dutch language in everyday life) with aphasia after intracerebral haemorrhage or infarction of at least 6 months who were testable with the ScreeLing (13), were recruited from 10 treatment centres by their SLT. Exclusion criteria were: dementia (suspected or confirmed); severe dysarthria; developmental dyslexia; severe impairment of vision and hearing (based on the medical history and standard clinical examination by the attending physician); illiteracy; and psychiatric disorder.
Healthy control group. Native/near-native speakers of Dutch (i.e. education in Dutch started from early childhood and primary use of the Dutch language in everyday life) older than 18 years were recruited by speech-language therapy Masters students from their family and friends. Exclusion criteria were: cerebral disease; dementia (suspected or confirmed); developmental dyslexia; severe impairment of vision and hearing (based on an interview); illiteracy; and psychiatric disorder.
This study was approved by the central medical ethics committee of Erasmus MC University Medical Center and by the local ethics committees of the participating centres. Informed written consent was obtained from the participants and/or their close relatives prior to their inclusion in the study.
Assessment
1. The ScreeLing investigates 3 linguistic levels (i.e. semantics, phonology, syntax) with a maximum score for each level of 24, and a maximum overall score of 72 (13) (see Appendix I). The ScreeLing and the 3 linguistic levels were handled as continuous variables (i.e. mean values and standard deviations (SD’s) are reported) in line with the previous report on the research version of this test (12).
2. Spontaneous Speech was elicited in a 10-min semi-standardized interview according to the Aachen Aphasia Test procedure (14) with 4 topics: the beginning and course of the disease; occupation; family and housing conditions; and hobbies. This interview was evaluated with the Aphasia Severity Rating Scale of the Boston Diagnostic Aphasia Examination (15). This categorical variable is a 6-point scale varying from 0 “no usable speech or auditory comprehension” to 5 “minimal discernible speech handicap”.
3. The Token Test (36 items) is a well-known and well-validated test to measure the presence and the severity of aphasia (16). The Token Test score was handled as a continuous variable (i.e. mean values and SD’s are reported) in line with the report on the 36 item-version we used (16).
For the acute patients, the assessment comprised the complete set of tests. The healthy control group was assessed with the ScreeLing and the Token Test; the chronic patients were tested twice with the ScreeLing with an interval of minimally 1 and maximally 2 weeks to investigate the test re-test reliability.
Statistical analyses
First, we established the psychometric properties of the ScreeLing by conducting reliability and validity analyses. We calculated the internal consistency with Cronbach’s α in the acute patients and healthy controls combined. The test-retest reliability was determined in the chronic patient group using Bland-Altman plots. For the construct validity, we compared the ScreeLing performance of the acute patients with that of the healthy controls with independent samples t-tests. The diagnostic accuracy of the ScreeLing and each of its 3 linguistic levels was determined by means of receiver operating characteristic (ROC) analysis. The sensitivity and specificity were set at the optimal cut-off point. In order to provide information on concurrent validity, correlation analyses were conducted between the ScreeLing and the Token Test, and between the ScreeLing and the Spontaneous Speech rating.
Secondly, differences in mean scores between the 3 linguistic levels were examined separately for the acute patients and healthy controls with paired samples t-tests, in order to establish whether the subtests were equally complex for healthy speakers, and to investigate whether the linguistic levels were equally impaired in aphasia. To obtain the occurrence of the linguistic-level disorders in the acute patients frequency analyses were used. For establishing possible differences in aphasia severity between subgroups of the acute patients (i.e. with a selective linguistic-level disorder, a combined disorder, or a 3-level disorder), we performed one-way ANOVA analysis and Kruskal-Wallis analysis. To identify pairwise differences we conducted post-hoc multiple comparisons tests with Bonferroni correction and Mann-Whitney tests. Finally, to determine the impact of the linguistic-level disorders in the acute patients on Spontaneous Speech we used ordinal regression analysis.
All analyses were carried out with SPSS 15.0 (SPSS Inc., Chicago, USA).
RESULTS
Between June 2007 and June 2009, 147 acute stroke patients with aphasia were included. The complete assessment was administered at 11.66 days (SD 2.10 days) after stroke. We excluded 6 patients whose assessments could not be completed within the time limits because no SLT was available for testing. An additional 23 chronic patients (mean time after stroke 49.96 months, SD 95.62 months) were included between November and December 2009. We included 138 healthy controls from April to May 2007. Participants’ characteristics are shown in Table I.
| Table I. Baseline characteristics of the participants |
| | Acute patients
(n = 141) | Healthy controls
(n = 138) | Chronic patients (n = 23) |
| Age, years, mean (SD) [range] | 66.61 (14.90) [19–96] | 55.74 (20.83) [18–88] | 67.96 (14.76) [29–89] |
| Gender, n (%) | | | |
| Female | 75 (53.2) | 73 (52.9) | 10 (43.5) |
| Male | 66 (46.8) | 65 (47.1) | 13 (56.5) |
| Handedness (EHI), n (%) | | | |
| Right-handed | 123 (87.2) | 120 (87.0) | 21 (91.3) |
| Left-handed | 15 (10.7) | 11 (8.0) | 2 (8.7) |
| Ambidextrous | 2 (1.4) | 7 (5.1) | 0 (0) |
| Unknown | 1 (0.7) | 0 (0) | 0 (0) |
| Level of education, n (%) | | | |
| Unfinished elementary school | 3 (2.1) | 0 (0) | 0 (0) |
| Elementary school | 20 (14.2) | 11 (8.0) | 3 (13) |
| (Unfinished) Middle school | 5 (3.6) | 12 (8.7) | 0 (0) |
| Sophomore high school or lower vocational education | 44 (29.1) | 15 (10.9) | 9 (39.1) |
| Junior high school or middle vocational education | 38 (27) | 46 (33.3) | 9 (39.1) |
| Senior high school or higher vocational education | 26 (18.4) | 31 (22.4) | 1 (4.4) |
| University | 5 (3.5) | 23 (16.7) | 0 (0) |
| Unknown | 3 (2.1) | 0 (0) | 1 (4.4) |
| Type of stroke, n (%) | | – | |
| Infarction | 121 (85.8) | | 20 (87) |
| Haemorrhage | 20 (14.2) | | 2 (8.7) |
| Both (infarction and haemorrhage) | 0 (0) | | 1 (4.3) |
| Clinical localization of stroke, n (%) | | – | |
| Left hemisphere | 139 (98.6) | | 22 (95.7) |
| Right hemisphere | 2 (1.4) | | 1 (4.3) |
| SD: standard deviation; EHI: Edinburgh Handedness Inventory. |
The 3 groups were compared with Mann-Whitney tests. The acute and chronic patients did not differ significantly for age or education level. The healthy controls were younger than the acute patients (Z = –4.46, p < 0.001) and the chronic patients (Z = –2.64, p = 0.008). Their education level was higher than of the acute patients (Z = –3.51, p < 0.001) and the chronic patients (Z = –2.95, p = 0.003).
Psychometric properties of the ScreeLing
The Cronbach’s α of the total ScreeLing and phonology was 0.95; of semantics and syntax was 0.93. These results show high internal consistency for the total ScreeLing and for its linguistic levels.
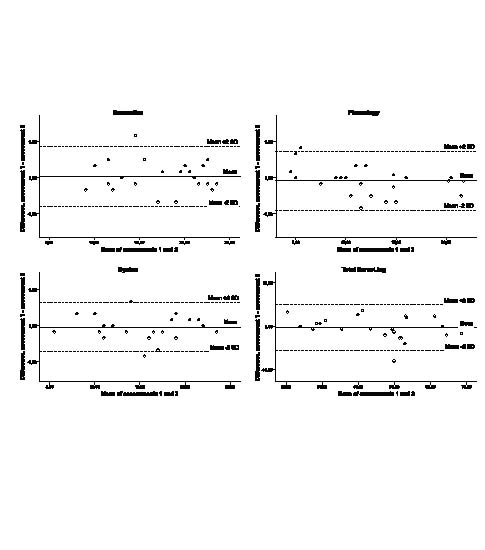
Test-retest reliability of the ScreeLing was examined in the chronic group. Each patient was assessed at a mean interval of 10 days (SD 3.16). The Bland-Altman plots illustrate high agreement between the two assessments, indicating a high stability of the ScreeLing over time (Fig. 1).
Fig. 1. Bland-Altman plots (n = 23). SD: standard deviation.
The comparison of the performances on the ScreeLing of the acute patients and the healthy controls revealed an overall significant difference on the total ScreeLing and its linguistic levels (Table II).
| Table II. Construct validity: mean total ScreeLing and linguistic-level scores for the acute patients and healthy controls |
| | Acute patients (n = 141) Mean (SD) [SE] | Healthy controls (n = 138) Mean (SD) [SE] | Difference Mean (95% CI) | p (independent samples t-tests) |
| Semantics | 19.22 (5.6) [0.47] | 23.63 (0.63) [0.05] | 4.41 (3.47–5.35) | < 0.001 |
| Phonology | 16.98 (6.06) [0.51] | 23.69 (0.63) [0.05] | 6.71 (5.70–7.73) | < 0.001 |
| Syntax | 17.96 (5.76) [0.49] | 23.53 (0.77) [0.07] | 5.57 (4.60–6.54) | < 0.001 |
| Total ScreeLing | 54.16 (16.14) [1.36] | 70.85 (1.38) [0.12] | 16.70 (14.0–19.39) | < 0.001 |
| SD: standard deviation; SE: standard error of the mean; CI: confidence interval. |
A ROC analysis showed that the ScreeLing discriminates accurately (0.94) between aphasic patients and healthy controls (Table III). The optimal cut-off score for the total ScreeLing was 68, i.e. patients scoring less than 68 were classified as aphasic. This led to a sensitivity of 0.94 and a specificity of 0.81 with an overall correct classification of 0.88.
| Table III. ScreeLing and its linguistic levels: accuracy, sensitivity, and specificity (n = 279) |
| | Accuracy | Optimal
cut-off point | Sensitivity | Specificity |
| Semantics | 0.79 | 22 | 0.94 | 0.56 |
| Phonology | 0.94 | 22 | 0.93 | 0.83 |
| Syntax | 0.87 | 22 | 0.91 | 0.74 |
| Total ScreeLing | 0.94 | 68 | 0.94 | 0.81 |
The ScreeLing and its linguistic levels correlated significantly with the Token Test and the Spontaneous Speech rating in the acute aphasic patients (Table IV). The Token Test showed the strongest correlation with the overall ScreeLing score. The Spontaneous Speech rating was most related to phonology, as this is the only part of the ScreeLing that incorporates language production. The high similarity and the significant relationships between the ScreeLing and the other two aphasia tests suggested a good concurrent validity.
| Table IV. Concurrent validity: comparing ScreeLing with Token Test and Spontaneous Speech rating (n = 141) |
| | Token Test (Pearson) | Spontaneous Speech rating (Spearman’s) | p |
| Semantics | 0.79 | 0.58 | < 0.001 |
| Phonology | 0.80 | 0.73 | < 0.001 |
| Syntax | 0.85 | 0.67 | < 0.001 |
| Total ScreeLing | 0.88 | 0.73 | < 0.001 |
Selective linguistic disorders
We examined possible differences in mean scores between the 3 linguistic levels with paired samples t-tests (Table II). In the healthy control group there was one small significant difference between phonology and syntax (p = 0.038, 95% confidence interval (CI) = 0.0 to 0.32), in favour of phonology. In the acute group there was a significant difference between all 3 levels, i.e. between semantics and phonology (p < 0.001, 95% CI = 1.49 to 2.99), between semantics and syntax (p < 0.001, 95% CI = 0.71 to 1.81), and between phonology and syntax (p = 0.001, 95% CI = –1.56 to –0.40). The phonological level showed the lowest scores; semantics scored the highest.
To ascertain the occurrence of linguistic-level deficits in the first 2 weeks after stroke, we conducted frequency analyses (Table V). Selective linguistic-level disorders occurred in 22.4% of the patients; they scored lower than 22 on one particular level, whereas their score on the other two linguistic levels was normal, i.e. > 22. A selective phonological disorder occurred most frequently (16.3%). These patients had a mean phonology score of 19.71 (SD 1.99), a mean Token Test-score of 27.20 (SD 5.41), and 79.2% of them had a high Spontaneous Speech rating (score 4 or 5). Among the combined disorders of two linguistic levels, the most frequent was the combination of a phonological and syntactic deficit (13.6%). Patients with this combination had a mean phonology score of 17.60 (SD 3.46), a mean syntax score of 18.50 (SD 2.8), a mean Token Test-score of 23.55 (SD 5.52), and 30% of the patients had a high Spontaneous Speech rating. A 3-level disorder was found in approximately 39% of the patients; these patients had a mean score for semantics of 13.88 (SD 5.08), for phonology 11.60 (SD 5.33), and for syntax 12.58 (SD 4.86). This group of patients had a mean Token Test score of 10.06 (SD 6.89) and only 26.3% had a high Spontaneous Speech rating.
| Table V. Frequency of linguistic disorders (n = 141) |
| | n (%) |
| Selective semantic deficit | 4 (2.7) |
| Selective phonological deficit | 24 (16.3) |
| Selective syntactic deficit | 5 (3.4) |
| Semantic and phonological deficit | 2 (1.4) |
| Semantic and syntactic deficit | 4 (2.7) |
| Phonological and syntactic deficit | 20 (13.6) |
| Semantic, phonological and syntactic deficit | 57 (38.8) |
Twenty-five patients did not have a disorder on any of the linguistic levels. All had been judged as aphasic by their neurologist and speech-language therapist. The Token Test classified 8 of these patients as aphasic; according to the Spontaneous-Speech rating 17 were aphasic, whereas according to the overall score of the ScreeLing one patient was aphasic. Four did not have aphasia according to any of these measures.
Relationship between linguistic-level deficits and aphasia severity
There was an overall significant difference (p < 0.001) in aphasia severity, measured by the Token Test, between the subgroups of patients with a selective phonological deficit, a combined phonological and syntactic deficit, and a 3-level deficit (one-way ANOVA analysis). Patients with a 3-level disorder were the most severe (p < 0.001). Their mean Token Test score was significantly lower than the mean Token Test score of the patients with a selective phonological disorder (mean difference = –17.13, 95% CI = –20.94 to –13.33) and of the patients with a combined phonological and syntactic disorder (mean difference = –13.49, 95% CI = –17.50 to –9.48). There was no difference in mean Token Test score between the patients with a selective phonological disorder and a combined disorder.
The subgroups of patients with a selective phonological deficit, a combined phonological and syntactic deficit, and a 3-level deficit, showed an overall significant difference in the Spontaneous Speech rating with the Kruskal-Wallis test (χ2 = 30.50, degrees of freedom = 2, p < 0.001). The selective phonological disorder group showed that more patients had high Spontaneous Speech ratings than in the group with a combined phonological and syntactic disorder (Mann-Whitney tests, Z = –3.30, p = 0.001), and the 3-level disorder group (Z = –5.39, p < 0.001). There was no difference in Spontaneous Speech ratings between the patients with a combined disorder and a 3-level disorder.
Semantic, phonological and syntactic scores explained 56.3% of the variance of Spontaneous Speech in ordinal regression analysis. Semantics and syntax did not contribute significantly to this effect: phonology alone explained 54.6% of the variance.
DISCUSSION
The ScreeLing proved to be a valid and reliable measure for assessing semantic, phonological, and syntactic deficits in acute aphasia after stroke. Selective linguistic-level disorders occurred in 22.4% of the aphasic patients with phonology as most frequently affected. The importance of assessing the 3 linguistic levels separately was further underlined by the finding that they had a different impact on spontaneous speech. In addition, patients with a selective phonological disorder had the highest Spontaneous Speech ratings. The number of linguistic-level disorders was related to the severity of aphasia, measured with the Token Test; patients with impairments on all 3 linguistic levels had the lowest Token Test scores.
Our study is the first report on the occurrence of linguistic-level deficits in the acute stage in a large cohort of aphasic stroke patients. In addition, the ScreeLing is the first thoroughly evaluated linguistic-level screening test suitable for assessing the presence and severity of the main linguistic-level deficits in early aphasia. It even exceeds the overall sensitivity and specificity of the well-known Frenchay Aphasia Screening Test (FAST), which was reported to be the best out of 6 aphasia screening tests (17).
Some aspects of the ScreeLing deserve mention. In the acute stage patients are often too ill to be tested extensively, therefore the ScreeLing has to be short and easy to administer at the bedside in a hospital as well as in a rehabilitation setting. Another crucial aspect regards the decreasing time of hospitalization: sufficient linguistic information should be available as soon as possible to enable additional targeted assessment for an adequate referral. For each linguistic level, we selected various tasks that optimally capture each linguistic level, as it is not clear which linguistic task best represents language processing at the 3 linguistic levels. Not all well-known linguistic tasks appeared to be suitable for the acute stage. For example, we decided not to use non-word repetition even though this is known to represent phonological processing (18). This task appeared too much of a burden for acute patients.
An earlier version of the ScreeLing proved to have a high sensitivity (86%) and specificity (96%) in discriminating aphasic and non-aphasic acute stroke patients (12) (see Appendix I for the modifications). A limitation of the present study is that we did not examine the discriminative power of the ScreeLing in stroke patients with and without aphasia, as our norm group was restricted to healthy controls. Even though this is standard procedure in neuropsychological tests, we will try to incorporate this aspect in our future research. Another limitation is that our healthy controls were not age-matched and education-matched with the acute and chronic patient groups. In our future research, we will try to include norm groups of healthy speakers and stroke patients without aphasia who are age- and education-matched with the aphasic patients. A final limitation with respect to the psychometric properties of the ScreeLing is the rather low specificity of semantics and syntax. In clinical practice, this would result in a patient being incorrectly classified as having a semantic/syntactic disorder. It is almost impossible for screening tests to be both highly specific and highly sensitive. We preferred optimal sensitivity in order to avoid misdiagnosing patients with an actual semantic/syntactic disorder.
Our results demonstrate that differential assessment of linguistic-level deficits is feasible at 2 weeks after stroke and that the occurrence of selective linguistic disorders is not rare. A selective semantic disorder was the least frequent and also rarely occurred in combination with just one other linguistic-level deficit. This means that if a patient has a deficit at the semantic level, the phonological and/or syntactical levels will also be affected. These findings support the notion that the semantic level is the central level of language processing and is involved in nearly all aspects of language (19). Damage to this component is said to affect performance on any task requiring comprehension or production of words (20).
Interestingly, we found that approximately 50% of the variance in the Spontaneous Speech rating was explained by the phonological level alone. This is not in line with previous findings that semantic function contributes more to the variance of verbal communication than phonology (21, 22). These results were obtained in more chronic stages, i.e. 3–5 months (21) and 1–338 weeks after stroke (22). Verbal communication might be heavily influenced by phonological deficits in the acute stage and more by semantic deficits in the chronic stage. So far, data about the occurrence of linguistic deficits are presently available only for the acute stage.
In a previous pilot study we found that phonology took significantly longer to improve than semantics and syntax, i.e. up to 4 months after stroke (23). The present study shows that in acute patients the phonological level is affected most severely and most frequently. Further insight into the recovery course of the 3 linguistic levels is needed to evaluate the relevance of our findings for treatment. In a current follow-up study we are investigating the recovery of semantics, phonology and syntax in the first year after stroke. We will address the occurrence of the linguistic deficits at various time-points and their relation to functional outcome. Furthermore, their additional prognostic value will be investigated.
ACKNOWLEDGEMENTS
Financial support: This research was supported by the Netherlands Organization for Scientific Research (NWO) (grant number 017.002.083).
We thank the speech-language therapists who included and/or tested the patients of the following centres:
Hospitals: Bronovo; Canisius-Wilhelmina; Deventer; Gelre Zutphen; HagaZiekenhuis; Kennemer Gasthuis; Clara; MCH; St Elisabeth; Tergooiziekenhuizen; TweeSteden Tilburg; UMC St. Radboud; Bernhoven; Rijnstate; Zevenaar; Diaconessenhuis Meppel.
Rehabilitation centres: Trappenberg; Waarden Gorinchem; Leijpark; Tolbrug; Rijndam; RMC Groot Klimmendaal; Sint Maartenskliniek; Sophia Den Haag; Sutfene Warnsveld.
Nursing homes: Afasie Trainingscentrum; Amaris Gooizicht; Regina Pacis and Gelders Hof; Watersteeg Veghel; Zevenaar; Den Ooiman; Hazelaar, Tilburg; Sint Jacob, Boerhaave; Cortenbergh; Zuiderhout; Reggersoord; Sint Jozef, Deventer; Waelwick; Bieslandhof; Irene Dekkerswald and Margriet.
Private practices and others: Bonnier-Baars; Mantelers-Nijssen;
Annika van Hemert; Linda Thiadens.
The authors are also grateful to Siri Siepel for scoring the Spontaneous Speech samples.
Conflicts of interest: E. G. Visch-Brink, W. M. E. van de Sandt-Koenderman
and H. El Hachioui receive royalties from the publication of the test ScreeLing. The publisher has had no influence on the data collection, methods, the interpretation of data, and the final conclusions.
REFERENCES