Michael W. O’Dell, MD1,3, Grace Kim, MS, OTR/L3, Lisa Rivera, MS, OTR/L3, Robert Fieo, PhD4, Paul Christos, DrPH2, Caitlin Polistena, BA3, Kerri Fitzgerald, MA, OTR/L3 and Delia Gorga, PhD3
From the 1Division of Rehabilitation Medicine and 2Department of Public Health, Weill Cornell Medical College, 3Department of Rehabilitation Medicine, NewYork-Presbyterian Hospital/Weill Cornell Medical Center and 4Division of Cognitive Neuroscience, Taub Institute, Columbia University, USA
OBJECTIVE: To further examine the psychometric properties of a 9-item version of the Arm Motor Ability Test (AMAT-9) in persons with stroke.
SUBJECTS: Thirty-two community-dwelling persons > 6 months post-stroke undergoing robotics treatment (mean age = 56.0 years, time post-stroke = 4.1 years, National Institutes of Health Stroke Scale score = 4.1, and AMAT-9 score = 1.22).
METHODS: Construct validity (including Rasch analyses) used baseline data prior to treatment (n = 32). Standardized response mean was calculated for subjects completing the protocol (n = 29). The Wolf Motor Function Test (WMFT), Fugl-Meyer Assessment (FMA), Action Research Arm Test (ARAT), and Stroke Impact Scale (SIS) were also administered.
RESULTS: Spearman-rank correlation coefficients between AMAT-9 and the WMFT, FMA, and ARAT were strong (0.78–0.79, all p < 0.001). The correlation between the AMAT-9 and SIS Hand Function sub-score was stronger than that between the AMAT-9 and the Communication sub-score (0.40, p = 0.025 and –0.16, p = 0.39, respectively). Rasch analyses provided evidence for an appropriate hierarchical structure of item difficulties, unidimensionality, and good reliability. The AMAT demonstrated a comparable standardized response mean of 0.98.
CONCLUSIONS: The AMAT-9 is valid and responsive among subjects scoring in the lower range of the scale. It has the advantage of assessing function and by eliminating the standing item from the previous iteration, it may be more easily used with severely impaired patients.
Key words: stroke; quality of life; validity; responsiveness; Rasch analysis; Arm Motor Ability Test.
J Rehabil Med 2013; 45: 00–00
Correspondence address: Michael W. O’Dell, M.D., Department of Rehabilitation Medicine, Weill Cornell Medical Center, 525 East 68th Street, Box #142, Room F1600, New York 10065, USA. E-mail: mio2005@med.cornell.edu
Accepted Jan 14, 2013; Epub ahead of print Mar 26, 2013

*This data was presented in part at the American Congress of Rehabilitation Medicine meetings in Montreal, Canada (October 2010) and Atlanta Georgia (October 2011).
Introduction
Stroke is a significant source of disability, affecting approximately 795,000 persons annually in the United States (1). Over the past decade, there has been a surge of research exploring the potential effectiveness of several novel interventions such as constraint induced movement therapy (CIMT) (2) and robotics treatment (3). While researchers debate which outcome measures best demonstrate efficacy of these new treatments (4), clinicians are seeing a growing emphasis on evidence-based practice in stroke rehabilitation (5). Both are contingent upon identifying reliable, valid, and responsive outcome measures (4). It is helpful to classify target outcome measures according to the International Classification of Function Disability and Health (ICF) (6) which define outcomes by impairment (i.e., structure and function, clinically viewed as signs and symptoms), activity limitation (i.e., performance), or participation limitation (i.e., social integration). A given outcome measure might capture information at one or more of these three levels but it is unlikely that a single measure will capture every clinically important construct for every patient/subject in every setting. Selection of the “ideal” outcome measure will depend on the clinical setting, severity of injury, research design, and type of intervention. That said, several authors have recently pointed out the need for clinical trials in stroke rehabilitation to demonstrate benefit at the levels of activity or performance (4, 7).
The Arm Motor Ability Test (AMAT, see Table I) is a standardized, laboratory-based measure of selected activities of daily living (ADL) created by McCulloch et al. and associates (8) at the University of Alabama for use in CIMT research (9, 10). Within the context of the ICF, the AMAT measures primarily activity limitation via the performance of standardized, simulated ADL tasks such as utensil and phone use and donning/doffing a sweater, among others. This focus on activity limitation rather than impairment is an important distinction between the AMAT and other commonly used upper extremity assessments such as the Wolf Motor Function Test (WMFT) (11), Fugl-Meyer Assessment (FMA) (12), and Action Research Arm Test (ARAT) (13). The AMAT has been used over the past two decades mostly in high functioning stroke survivors (8–10, 14–16). Several iterations of the scale have been used over the years with a total number of items ranging from 10 (10, 16) to 17 (8). All items save one (“light switch/doorknob” item, see Table I) are assessed in the seated position. Interrater and test-retest reliability have been demonstrated (8, 10) and AMAT scores have been found to correlate well with the Motricity Index – Arm (10), distal subscales of the FMA (16), Functional Independence Measure (FIM) self care items (15) and selected physiological parameters (17, 18). Kopp and colleagues (10) found the scale more responsive to gains during a 2 versus 1 week time period in inpatient rehabilitation. Details of these studies have been recently reviewed by our group (19).
|
Table I. Arm Motor Ability Test (AMAT): 9 and 10 items versions |
|
|
Item |
Tasks assessed |
|
Cut meat |
A. pick up knife and fork B. cut meat C. fork to mouth |
|
Foam sandwich |
A. pick up foam sandwich B. sandwich to mouth |
|
Eat with spoon |
A. pick up spoon B. pick up bean w/ spoon C. spoon to mouth |
|
Comb hair |
A. pick up comb B. comb hair |
|
Open Jar |
A. grasp jar top B. screw jar top open |
|
Tie shoelace |
A. tie shoelace |
|
Use telephone |
A. phone receiver to ear B. press phone number |
|
Put on cardigan |
A. affected arm in sleeve B. button two lower buttons |
|
Put on T-shirt |
A. arms in T-shirt sleeve B. head through hole C. pull down and straighten shirt |
|
Light switch/doora |
A. pincer grasp of light switch and flip down B. grasp door handle, rotate handle, open door C. close door |
|
Tasks and sub-tasks included in the AMAT. 5: movement appears normal; 4: movement is close to normal, but slightly slower; may lack precision, fine coordination, or fluidity; 3: movement is influenced to some degree by synergy or is performed very slowly and/or with effort; 2: uninvolved arm is used for minor readjustments or change of position, or requires more than two attempts, or does very slowly. In bilateral tasks, involved arm is used only as a helper or stabilizer; 1: involved arm does not participate functionally, however attempt is made to use involved arm. For unilateral tasks, the uninvolved arm may be used to move the involved arm; 0: Does not attempt to use the involved arm. aThe 9-item version consists of the 10 items version without the “light switch/door. |
|
A greater understanding of the psychometric properties of the AMAT is warranted given its unique position as a standardized measure of ADL activity limitation. The aim of this study is to explore selected psychometric properties of a 9 item version of the AMAT (AMAT-9, 10 item version with the one standing item eliminated) in persons with stroke scoring in the lower range of the scale. Properties examined include validity, reliability and responsiveness using traditional and item response theory (Rasch) analyses of the scale (20). We hypothesized that 1) the AMAT-9 will hold significant relationships with the WMFT, FMA and ARAT, with the WMFT holding the greatest association (convergent validity), and 2) the AMAT-9 will hold a stronger relationship with the Hand Function rather than the Communication sub-score of the Stroke Impact Scale (SIS, divergent validity) (21). Since there are few data regarding the responsiveness of the AMAT in any iteration, we provide a descriptive comparison with other upper extremity assessments using standardized response means (SRM).
METHODS
Subjects
Subjects for this study were 32 community dwelling stroke survivors who volunteered to participate in a 12 week, upper extremity robotics study in the Department of Rehabilitation Medicine at Weill Cornell Medical Center (WCMC) in New York, New York. The robotics study, which was approved by the WCMC Institutional Review Board, was implemented in conjunction with Burke Rehabilitation Hospital in White Plains, NY and Campus Biomedico in Rome; however, only data from WCMC was included in this analysis. All subjects provided informed consent prior to assessment and participation.
Inclusion criteria for the robotic study were as follows: (1) diagnosis of a single stroke ≥6 months prior to study entry confirmed by neuroimaging reports; (2) sufficient cognitive and language abilities to understand and follow multiple-step instructions; (3) adequate vision to track a computer screen for 60–120 min; (4) naive to any type of robotics therapy; (5) adequate passive range of motion in the paretic upper extremity joints to participate in robotics therapy; (6) muscle strength of 1–4/5 for all upper extremity joints on manual muscle testing; and (7) ≥ 3 months from completion of all rehabilitation therapies and/or and botulinum toxin injections. Subjects were recruited from a variety of sources including flyers, outpatient clinics at WCMC, and outreach to stroke support groups.
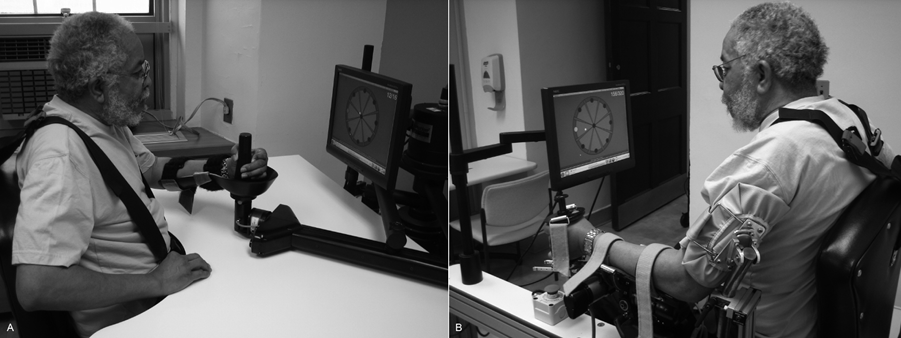
Upper extremity robotic treatment used the InMotion™ shoulder and wrist units from Interactive Motion Technologies (Watertown, USA). These devices have been used in a number of previous studies (22, 23). Training uses video-like games consisting of 16 point-to-point movements in various directions for proximal (shoulder and elbow) and distal (wrist and forearm) muscles (Figs 1A and 1B). The robot provides active assistance to complete movements if the subject is unable to complete the task on his/her own. At the start and at the end of each session, the subject completes a 16 point-to-point game without robot assistance. Focusing on the impaired arm, a typical treatment session consists of 3 practice blocks each lasting 10 to 15 min. Subjects engage in approximately 1,000 repetitions during a typical session. The main study addressed two different robotics treatment approaches. The first group completed training of proximal and distal muscle groups on alternating days while the second group completed training of proximal and distal muscle groups within the same session. Sixteen subjects completed each group at WCMC for a total of 32 subjects. Given that psychometrics of the AMAT, not efficacy of the robot treatment, was the aim of this study, we analyzed both groups together.
Fig. 1. The two InMotion® (Interactive Motion Technologies, Waterown, USA) upper extremity robotic units used in this study. (A) The proximal unit providing repetitive movements to the shoulder and elbow joints. (B) The wrist unit focusing on the wrist joint.
The main study required assessments with the WMFT, ARAT, and FMA at baseline and after 12 weeks of robotics treatment. We added the AMAT-9 to this battery specifically for the current analyses. Validity (including Rasch) analyses included data from 32 baseline assessments prior to treatment while responsiveness analyses utilized change scores between the baseline and 12 week follow-up assessments for the 29 subjects completing the study. Three subjects did not complete the follow-up assessment; one fell sustaining an injury not allowing him to continue, one relocated to another city and a third did not feel the treatment was helpful and declined to continue.
Assessment and outcome measures
All upper extremity outcome measures were administered in a quiet room with a single assessor (GK) during a single session. The SIS is a subjective, disease specific measure of activity and participation limitation and was completed by subjects at home under the family supervision or in the clinic under research staff supervision in order to clarify questions. The original guidelines were used to guide administration of the AMAT1 and WMFT (24). The ARAT (25) and FMA (26, 27) were scored according to recent guidelines. For all tests, subjects were seated at a table and received standardized verbal instructions and a physical demonstration for each task. Rest breaks were provided as needed and occasionally required. The entire battery required approximately 2 h to administer. A description of the various assessments follows:
FMA. The upper-extremity portion of the FMA evaluates impairments in the paretic arm including voluntary movement, reflex activity, grasp, and coordination. Reliability, validity and responsiveness are well-established (12, 26, 27). The maximum total score of 66 is the sum of 33 items each rated 0, 1 or 2. The FMA may also be divided into shoulder/elbow and wrist/hand sub-scores consisting of 18 and 15 tasks, with a maximum score of 36 and 30, respectively. Higher scores indicate less impairment.

1Taub E, Crago JE, McCulloch KL. Arm Motor Ability Test (AMAT). [Manual, unpublished]. 1987. Available from: E. Taub, Ph.D. Psychology Department, University of Alabama-Birmingham, CH415, 1300, 8th Avenue South, Birmingham, AL 35294.
AMAT. In the most recent iteration (10, 16), the AMAT contains 10 compound ADL tasks and is primarily a measure of activity limitation (performance) in the ICF model (6). Psychometric properties are discussed above. For this study, we used the 10 item version without the “light switch/doorknob” item, yielding the AMAT-9. The rationale for dropping the tenth item was enhanced ease of use with persons with severe impairment and a limited ability to stand. Without the light switch/door knob item, all remaining items on the AMAT-9 are assessed in a seated position. Some ADL tasks have 2 or 3 steps, but are meant to be “performed continuously” (10) so as to accurately reflect real-life performance. Items include both unilateral and bilateral tasks with a one or two minute time limit, depending on difficulty. Each task is timed and scored according to functional ability (FA), a 6-point Likert scale ranging from 0 (no hand use) to 5 (normal use, see Table I). It is important to note that the FA scale considers the actual motor performance of the affected arm during unimanual and bilateral functional tasks. Previous iterations assessed quality of movement and performance time, but subsequent research has determined the former to be redundant with FA (10) and the latter to suffer from unacceptable floor and ceiling effects (16). The total AMAT-9 score is calculated as the mean of the all component scores and ranges between 0 and 5, with higher scores indicating less activity limitation. The AMAT attempts to account for the use of compensatory strategies, a significant issue when measuring limitations in activities (19). The subject is penalized when observed to use the unaffected extremity or when proximal trunk or arm compensation is noted in completing the standardized tasks.
WMFT. The WMFT is a widely-used, laboratory-based assessment reflecting impairment and, to a much lesser extent, activity limitation for 15 upper extremity tasks. Reliability and validity have been delineated (28, 29). Examples of tasks include placing the forearm to table, extending the elbow, flipping cards, and folding a towel. The total score is the mean functional ability score for the 15 upper extremity tasks and ranges from 0 to 5, with higher scores indicating less impairment or activity limitation.
ARAT. The ARAT assesses upper extremity impairment. Reliability, validity and responsiveness are established (13, 28, 30). It contains 19 items grouped into 4 subscales: grasp, grip, pinch and gross motor. In the first 3 subscales, the scale assessed the ability to grasp, move, and release objects of differing size, weight, and shapes. The last subtest evaluates 3 gross movements (place hand behind head, place hand on top of head, and move hand to mouth). Each item is graded on an ordinal scale from 0–3, all of which are summed to yield a score of 0 to 57. Higher scores indicate less impairment.
SIS 3.0. The SIS 3.0 is a subjective questionnaire measuring various dimensions of activity and participation limitation within the ICF model (6, 21). Reliability, validity and responsiveness have been well-described (21, 31). The scale consists of 59 questions divided into 8 domains: strength, hand function, mobility, activities of daily living, emotion, memory, communication and social participation. The SIS uses the same scoring algorithm as the Short-Form 36 (32), a widely used generic measure of quality of life, and transformed scores are generated for each domain by the following formula:
Transformed scale = [(Actual raw score–lowest possible raw score)] × 100
Possible raw score range
Domain scores range from 0 to 100 with higher scores indicating a greater level of participation.
Data analysis
Descriptive statistics (frequency distribution, mean, median, range and standard deviation (SD)) were used to evaluate categorical and selected continuous variables. Given the ordinal nature of the scales used, hypothesis testing for convergent and divergent validity (33) utilized the nonparametric Spearman rank correlation coefficient. Normalized scores (raw score/total possible score × 100) of all upper extremity assessment measures were calculated and plotted for visual inspection of floor effects in this sample of subjects with severe functional limitations. Normalized AMAT scores were grouped into low, middle and high impairment groups as defined by normalized FMA scores. Differences among these groups were examined using the non-parametric Kruskal-Wallis test and pair-wise comparisons using the Wilcoxon rank sum test. A p-value of < 0.05 was considered statistically significant for all analysis.
For the 29 subjects completing the main robotics study, standardized responsive means (34, 35) were calculated for all upper extremity measures as the difference between the baseline (pre-robotic treatment) and 12 week (post-robotic treatment) scores divided by the standard deviation of that change score. The SRM was chosen as it is a variation of the well-known effect size, is best applied to single groups (34), is not dependent on sample size (34, 35), and has been recommended by Husted et al. (35). All statistical analyses above were performed in SPSS version 19.0.
Finally, RUMM 2030 software was used to complete a series of Rasch model analysis of the AMAT-9 using the baseline data from our 32 subjects. To avoid the chance of “empty” category responses and because of our small sample size, we collapsed AMAT-9 scores into to a dichotomous variable - 0 (AMAT-9 scores 0 or 1 indicating severe activity limitation of the paretic arm) or 1 (AMAT-9 scores 2, 3, 4 and 5 indicating at least some involvement of the paretic arm in the task). It has been suggested that Rasch analyses can be performed with as few as 30 subjects (36, 37) albeit with subsequently higher standard errors for individuals (36)2. The overall fit of the Rasch model was evaluated using 3 approaches. An item-trait interaction chi-square value was calculated. When non-significant, it indicates there is no substantial deviation from the Rasch model and supports a hierarchical ordering of the items and construct validity (38). In addition, we assessed person and item fit residual statistics which reflect content validity (39). When a scale fits the Rasch model, these fit residuals follow a normal distribution (mean value of 0 and a SD of 1). Fit residuals are available at the individual item and person level. Residuals (a summation of individual person and item deviations) between ± 2.5 are considered an adequate model fit with values lower than –2.5 indicating an item not measuring the targeted construct and those above + 2.5 indicating item redundancy (40). Unidimensionality was assessed using a principal component analysis (PCA) of the residuals to demonstrate there is no further pattern in the data, after extracting the ‘Rasch factor.’ (37) The proportion of t values falling outside of the ± 1.96 range are significant at < 0.05 and support unidimensionality. A Cronbach’s alpha reliability estimate was calculated to assess precision (41) and a Person Separation Index (PSI) to estimate internal consistency (42).

2Smith RM. Personal Communication, May 19, 2012.
RESULTS
Sample characteristics
The demographic characteristics of the 32 subjects are listed in Table II. Broadly, the sample is 72% male and 69% having a non-hemorrhagic stroke with an mean age of 56 years (SD 12.4), mean time from stroke of 4.1 years (SD 4.5) and mean National Institutes of Health Stroke Scale (NIHSS) score of 4.1 (SD 2.1). Eighty-eight percent were right-handed prior to the stroke with 50% having the right side affected and 60% a cortical stroke (n = 30).
|
Table II. The baseline demographic and outcome measures for the 32 subjects prior to upper extremity robotic treatment. |
|
|
Variables |
|
|
Gender, male, % |
72 |
|
Age, year, mean (SD) [median] (range) |
56.0 (12.4) [57] (35–85) |
|
Ethnicity, % |
|
|
White |
56 |
|
Black |
28 |
|
Other |
16 |
|
Handedness, right, % |
88 |
|
Time post-stroke, years, mean (SD) [median] (range) |
4.1 (4.5) [2.5] (0.8–25.2) |
|
Side of hemiparesis, right, % |
50 |
|
Type of stroke, non-hemorrhagic, % |
69 |
|
Lesion location, cortical (n = 30), % |
60 |
|
Scales, mean (SD) [median] (range) |
|
|
NIHSS |
4.1 (2.1) [4.0] (1–10) |
|
BDI |
11.8 (6.9) [11.5] (1–31) |
|
AMAT-9 |
1.22 (0.54) [1.13] (0.5–2.35) |
|
ARAT |
11.3 (10.3) [7.5] (0–38) |
|
FMA (upper extremity) |
22.0 (10.8) [20.0] (9–44) |
|
WMFT |
1.72 (0.74) [1.60] (0.4–3.13) |
|
SIS – Hand |
15.3 (21.6) [5.0] (0–80) |
|
SIS – Comm |
85.6 (15.8) [92.9] (54–100) |
|
NIHSS: National Institutes of Health Stroke Scale score; BDI: Beck’s Depression Inventory; AMAT-9: Arm Motor Ability Test (9 item version); ARAT: Arm Research Action Test; FMA: Fugl Meyer Assessment - upper extremity; WMFT: Wolf Motor Function Test; SIS-Hand: Stroke Impact Scale Hand Function subscore; SIS-Comm: Stroke Impact Scale – communication subscore. |
|
Rasch analysis
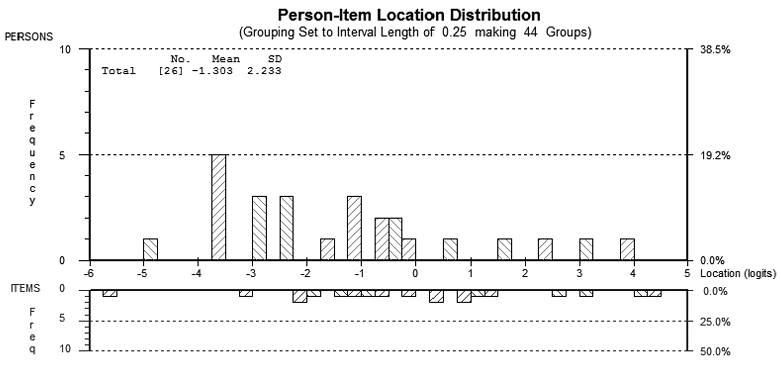
The total chi-square probability was non-significant indicating that the items in the AMAT-9 conform to a hierarchy of difficulty (Table III). Overall the 3 most difficult items in the AMAT were head through hole-bilateral (4.44 logits), pull down and straighten-bilateral (4.08 logits), and button two lower buttons-bilateral (3.05 logits). Conversely, the 3 least difficult items were ‘sandwich’ to mouth (–5.74 logits, grasp component not included), fork to mouth (–3.14 logits, grasp component not included), and grasp jar top (–2.22 logits). After removal of extreme values, the item-person interactions statistic revealed that the mean location of persons was –1.3, which is lower than the centralized mean of 0 for the items (Fig. 2). This indicates the group presented with an ability level lower than the difficulty level of the AMAT and is consistent with the severe function deficits in our sample. Finally, item-person interaction fit residuals presented with means for items and persons close to 0 (–0.28 and –0.22, respectively) and SD below 1. Individual item and person fit residuals ranged from –1.133 to 0.179 with none exceeding the ± 2.5 threshold and consistent with a good fit with the Rasch model. As expected, the SE for individuals was relatively high. After excluding extreme person values (n = 6), however, the SE values generally approached one (0.90–0.92).
The first principal components analysis resulted in two item subtests formed by the 5 most positive loading items (item 8: loading of 0.619; item 12: 0.596; item 10: 0.384; item 11: 0.312; item 07:0.234) vs. the 5 most negative loading items (item 16: loading of –0.604; item 9:–0.542; item 18:–0.516; item 13: –0.488; item 05: –0.399). Comparing the subtests through an independent t-test demonstrated 6.25% of that number fell outside the ± 1.96 range (lower bound 95% Confidence Interval of 1%) which supports the unidimensionality of the AMAT-9.
|
Table III. Fit indices of the AMAT-9 |
||||||
|
Item |
Location |
Standard error |
Item Fit residuals |
Degrees of freedom |
χ2 |
Probability |
|
5) ‘Sandwich’ to mouth |
–5.747 |
1.012 |
–0.123 |
23.75 |
0.178 |
0.914 |
|
3) Fork to mouth |
–3.145 |
0.534 |
–0.229 |
23.75 |
0.339 |
0.844 |
|
11) Grasp jar top |
–2.228 |
0.513 |
–0.007 |
23.75 |
1.190 |
0.551 |
|
8) Spoon to mouth |
–2.027 |
0.513 |
–0.153 |
23.75 |
0.830 |
0.660 |
|
12) Unscrew jar top |
–1.951 |
0.513 |
–0.372 |
23.75 |
1.171 |
0.556 |
|
10) Comb hair |
–1.448 |
0.518 |
–0.243 |
23.75 |
0.198 |
0.905 |
|
4) Pick up foam ‘sandwich’ |
–1.151 |
0.525 |
–0.458 |
23.75 |
0.375 |
0.828 |
|
14) Phone receive to ear |
–0.997 |
0.530 |
–0.921 |
23.75 |
1.047 |
0.592 |
|
13) Tie shoelace |
–0.610 |
0.547 |
–0.428 |
23.75 |
0.727 |
0.695 |
|
6) Pick up spoon |
–0.234 |
0.569 |
–0.410 |
23.75 |
0.420 |
0.810 |
|
7) Pick up bean w spoon |
0.402 |
0.623 |
–1.133 |
23.75 |
4.498 |
0.105 |
|
18) Dress affected arm in t–shirt |
0.421 |
0.625 |
0.179 |
23.75 |
1.633 |
0.441 |
|
16) Dress affected arm in sweater |
0.885 |
0.675 |
0.165 |
23.75 |
0.357 |
0.836 |
|
2) Cut meat |
0.987 |
0.686 |
–0.058 |
23.75 |
0.288 |
0.865 |
|
15) Dial phone number |
1.186 |
0.709 |
–0.560 |
23.75 |
0.286 |
0.866 |
|
9) Pick up comb |
1.441 |
0.739 |
–0.022 |
23.75 |
1.033 |
0.596 |
|
1) Pick up knife and fork |
2.631 |
0.876 |
–0.407 |
23.75 |
0.543 |
0.762 |
|
17) Button two lower buttons |
3.055 |
0.932 |
–0.156 |
23.75 |
0.135 |
0.934 |
|
20) Pull down and straighten |
4.086 |
1.143 |
–0.205 |
23.75 |
0.046 |
0.977 |
|
19) Head through hole |
4.443 |
1.260 |
–0.210 |
23.75 |
0.113 |
0.944 |
|
All items showed Fit residual values < 2.5 and Bonferroni adjusted probability scores > 0.001. |
||||||
Fig. 2. With reference to the AMAT-9, the figure depicts the person-item locations with the distribution of persons in the top half of the graph and items in the bottom half. The two distributions are separated by the logit scale. The distribution was calculated for 20 items and 32 persons, with 6 subjects excluded due to extreme scores (all positioned to the far left of the distribution). SD: standard deviation.
Reliability of the AMAT-9 was good, even with the inclusion of extreme scores Cronbach’s alpha was 0.93 and the PSI was 0.86. These values indicate that the AMAT is suitable for group as well as individual level analysis. Additionally, when extreme scores were removed from the analysis the PSI increased to 0.88. Examining the Test Information Function revealed that the statistical information peaked between the logit range of –1 to 1.
Correlations between measures and AMAT
Spearman rank correlation coefficients between the AMAT-9 and the scales of interest are presented in Table IV. Correlation coefficients between the AMAT-9 and WMFT, FMA, and ARAT were identical at 0.78–0.79 (p < 0.001). Correlation with the FMA wrist/hand subscore was higher than for the shoulder/elbow subscore at 0.74 and 0.66 (both p < 0.001), respectively. The correlation coefficient between the AMAT-9 and Hand subscore of the SIS was 0.40 (p = 0.025) and with the Communication subscore was –0.16 (p = 0.39).
|
Table IV. Correlations with the AMAT-9 |
||
|
Spearman rank correlation coefficient (r) |
p-value |
|
|
Hypothesis #1 |
||
|
ARAT |
0.79 |
0.001 |
|
FMA – total |
0.79 |
0.001 |
|
FMA – W/H |
0.74 |
0.001 |
|
FMA – S/E |
0.66 |
0.001 |
|
WMFT |
0.78 |
0.001 |
|
Hypothesis #2 |
||
|
SIS – Hand |
0.40 |
0.025 |
|
SIS – Comm* |
–0.16 |
0.39 |
|
Spearman rank order correlation coefficient (r) between the AMAT-9 and various upper extremity assessments for the 32 baseline assessments. Hypothesis #1 (see text) is partially supported in that there are strong correlations between the AMAT-9 and the other measures, but the WMFT was not the strongest, as hypothesized. The data fully supports hypothesis #2 (see text) regarding the divergent construct validity of the AMAT-9. AMAT-9: Arm Motor Ability Test (9 item version); ARAT: Arm Research Action Test; FMA: Fugl Meyer Assessment; W/H: wrist/hand subscore; S/E: shoulder/elbow subscore; SIS: Stroke Impact Scale; Hand: Hand Function subscore; Comm: Communication subscore. |
||
Visual inspection for floor effects
Fig. 3 presents normalized scores for all four upper extremity measures. Visual inspection reveals a remarkably similar distribution between normalized FMA and WMFT scores. The variability of scores appears slightly less with the AMAT-9 compared to the other measures as borne out by the smaller standard deviation. Normalized ARAT scores tended to group in the lower range of the scale in this sample with severe functional limitations.
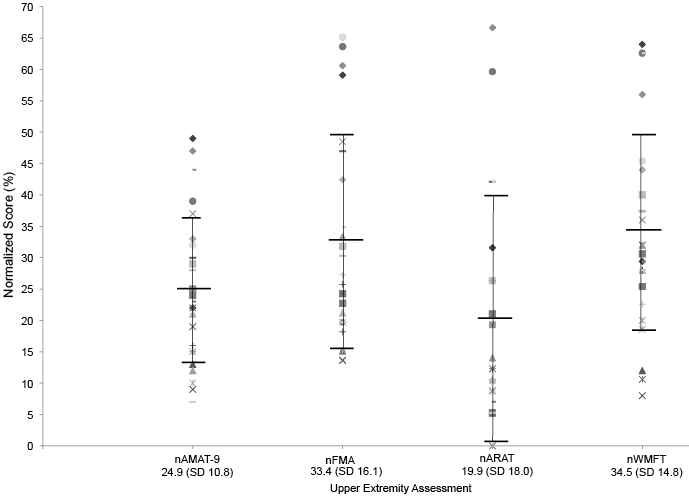
Fig. 3. A scatter plot of normalized scores (raw score/total score × 100) for the 4 upper extremity assessment scales used in this study. All scores range from 0–100. The mean normalized score with standard deviation (SD) in parentheses appears below the scale name at the bottom of the figure. Normalized AMAT-9 scores are grouped somewhat more tightly than other measures, with ARAT scores grouping in the lower range of the scale. Similar distributions are noted between normalized WMFT and FMA scores. %: percent of total score; nAMAT-9: normalized Arm Motor Ability Test (9 item version): nFMA: normalized Fugl-Meyer Assessment; nARAT: normalized Arm Research Action Test; nWMFT: normalized Wolf Motor Function Test.
Comparison of normalized AMAT-9 and FMA scores
We examined normalized FMA and AMAT-9 scores replicating the approach used by Chae and associates (16), as depicted in Fig. 4. On the basis of FMA scores, the 32 subjects were divided into three impairment groups – low impairment (n = 10, median normalized FMA = 54.6), middle impairment (n = 8, median normalized FMA = 31.1) and high impairment (n = 14, median normalized FMA = 19.7). The high impairment group represents the most disabled individuals. Cut-off scores were chosen on the basis of natural breaks in the distribution of the data and an attempt to keep the 3 cells at similar sizes. Differences in normalized AMAT scores were statistically significant among all three groups (Kruskal–Wallis test, p < 0.0001). Normalized AMAT-9 scores were significantly different between the high and medium impairment groups (Wilcox rank-sum test, p = 0.012) and between the high and low impairment groups (Wilcox rank-sum test, p = 0.0001), with a trend toward significance between the low and medium impairment groups (Wilcox rank-sum test, p = 0.06).
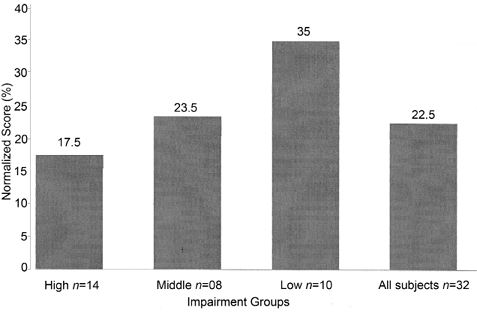
Fig. 4. Normalized, median AMAT scores for all subjects (far right) and grouped by low, middle and high impairment groups based on normalized FMA scores. Normalized AMAT-9 scores are statistically different among the three impairment groups (Kruskal-Wallis test, p < 0.0001.) Pair-wise comparisons are significant between the low and high impairment groups (p < 0.0001) and the middle and high groups (p = 0.012) with a trend toward significance between the low and middle groups (p = 0.06), using Wilcoxon rank-sum test. %: percent total score; nAMAT-9: Arm Motor Ability Test (9 item version); FMA: Fugl-Meyer Assessment.
Relative responsiveness
The AMAT demonstrated an intermediate responsiveness among the measures at 0.98, with the FMA the highest at 1.26 and the WMFT lowest at 0.81. The ARAT SRM was 0.89.
DISCUSSION
The establishment of reliability, validity, and responsiveness is critical to the confident use of any scale (34). A valid scale is one that actually measures what it purports to measure. There are several types of validity including content validity (i.e., the extent to which the measure subjectively appears to represent the topic under consideration) and criterion validity in which a scale is compared to a “gold standard”. The latter rarely occurs in the setting of clinical medicine given the dearth of “gold standards” for comparison. Construct validity, which we address in this study at several levels, is determined gradually over time by the confirmation of a number of “mini-theories” about how the scale of interest will be more related to similar and less related to different scales (34). The former is termed convergent validity and the latter as divergent validity. The intrinsic characteristics of a scale – i.e., whether the items consistently reflect a single construct – also reflect construct validity. The construct that we are exploring is the ability of the AMAT-9 to reflect upper extremity ADL activity limitation following stroke.
We examined the degree to which the AMAT-9 conforms to Rasch modeling and possesses a consistent, internal hierarchy of item difficulty. This is the first published such analysis. Using a variety of “fit statistics”, Rasch analysis is a powerful tool in establishing content validity and supporting construct validity. In contrast to more traditional correlation-based descriptive analyses, Rasch analysis uses a mathematical model to evaluate the correctness of summing items together to reflect some latent trait – in this case upper extremity ADL activity limitation (20). We were able to demonstrate that the AMAT-9, in this small sample, displays measurement characteristics consistent with the Rasch model expectations. Thus, we can be more confident that the scale is undimensional and that summed scores of the AMAT-9 are a reflection of upper extremity activity limitation. Fitting the Rasch model also increases the interpretive power of the AMAT-9. For instance, information pertaining to construct under-representation, increased precision through the use of information functions, and finally, the use of difficulty parameters that reflect interval level measurement.
Using a traditional approach, we hypothesized that the AMAT-9 would demonstrate a hierarchical, convergent validity with 3 other commonly used upper extremity scales: WMFT, FMA, and ARAT, in that order. We felt the WMFT would hold the strongest relationship with AMAT-9 because it contains a combination of impairment and functional tasks more reminiscent of activity limitation (i.e folding towel, flipping over cards, stacking coins, turning key). The ARAT and FMA both appear to be primarily measures of impairment. We also hypothesized the AMAT-9 would demonstrate divergent validity between the Communication and Hand Function sub-scores of the SIS. With so few data on the responsiveness of any version of the AMAT, we were unable to formulate a sound hypothesis and used this opportunity to simply provide a description of SRM of the AMAT-9 compared to other upper extremity measures following a 12 week, upper extremity robotics intervention. Moreover, both validity and responsiveness were explored for a 9-item version of the AMAT for which standing is not required in a sample of subjects scoring in the lower ranges of the scale.
The data partially supports our first hypothesis. There were strong, statistically significant, and nearly identical associations between the AMAT-9 and all 3 upper extremity measures. Our findings are strengthened by the “homotrait/heteromethod” characteristics of the upper extremity measures we examined (34). That is to say, objective measures of impairment (ARAT and FMA) and semi-activity limitation (WMFT) and a purely subjective measure of activity limitation (SIS hand subscore) of the upper extremity all held significant relationships with the AMAT-9. Absent in our study is a comparison of the AMAT-9 to another objective activity limitation scale, such as the FIM (43) or the Barthel Index (BI) (44). Among these three measures, the AMAT-9 has the great advantage of being a standardized ADL assessment of functional ability as opposed to an estimate of assistance required. All 3 measures suffer from an inability to neatly distinguish enhanced performance as a result of recovery as opposed to implementation of compensatory strategies. That said, the AMAT-9 does attempt to account for compensation in that the use of the unaffected arm or other compensatory strategies are taken into account in the scoring system. A subject utilizing compensatory movements or synergistic patterns cannot score above a 3. Use of the unaffected arm to assist the affected arm for unimanual tasks will limit subjects to a score of 2. A subject must demonstrate improved performance of the affected arm in order to advance in scoring. Neither the FIM nor the BI contains any mechanism to account for compensation.
Our results need to be interpreted within the context of previous research on AMAT validity. In the first published abstract on the AMAT, McCollough and colleagues (8) took the “extreme groups” approach (34), reporting that AMAT scores were significantly different among groups of persons with and without stroke. This finding is not unexpected given the nature of the items on the AMAT but no specific data was provided. Kopp and associates (10) reported a statistically significant relationship between the AMAT and the impairment measure Motricity Index – Arm (MIA) with Spearman’s correlation coefficient of 0.61 using the functional ability score. Although statistically significant, the authors felt that a low internal consistency for the MIA may have precluded a stronger relationship. It was in this study that the authors pointed out that reliability and validity were not undermined by dropping the number of items from 13 to 10.
To our knowledge our data is the first comparing the AMAT (in any iteration) with the WMFT and ARAT, therefore, we have little basis for comparison. Inspection of the normalized scores would suggest that this sample of subjects with severe functional deficits group in lower range of the scale of the AMAT-9, although not meeting the threshold for floor affect (45). Normalized scores for the both the WMFT and the ARAT appear to be more variable than the AMAT-9 on comparison of standard deviations. These observations require confirmation, however. With regard to other AMAT validity studies, Daly and colleagues (15) reported convergent and divergent validity of AMAT-13. They utilized the sum of performance time for all items. Spearman’s correlations between AMAT-13 and FIM self care and SIS hand subscales (convergent validity) ranged from 0.57 to 0.69 (all significant at p < 0.003 or better) and with FIM communication score no better than 0.10 (not significant). This data may be less applicable given that performance time is no longer recommended as an AMAT domain (16, 19). Finally, with regard to the FMA, Chae et al. (16) reported a Spearman’s coefficient of 0.94 (p < 0.001) between the AMAT and total FMA score, with weaker associations to the shoulder/elbow, wrist, and hand subscores at 0.82, 0.83 and 0.90 (all p < 0.001,) respectively. Our correlations are not as robust as Chae for total FMA and the subscores, but still statistically significant, in this more functionally impaired sample. When Chae et al. (16) and our data are taken together, it suggests a strong relationship between the AMAT and FMA over a broad range of post-stroke impairment. When grouped by relatively narrow impairment levels, normalized AMAT-9 scores were significantly different in two of the three pairwise comparisons. This suggests a rather impressive ability for the AMAT-9 to differentiate activity limitation in persons with severely impacted hand function. Again, further study is needed in this area.
The ability to detect change is among the most important, and least studied, psychometric properties of scales. Streiner & Norman (34) discuss the distinction between a scale’s sensitivity (the ability to detect any change) and its responsiveness (the ability to detect clinically meaningful changes). A SRM is the ratio of mean change of a scale over time to the standard deviation of that mean change and provides a useful method to compare relative responsiveness among scales. As with effect size, a SRM ≥ 0.8 is considered “large” (34). All scales addressed in this report fared quite well on this analysis. The AMAT-9 held an intermediate position in its ability to detect changes in activity limitation after a 12 week course of upper extremity robotic treatment. Detecting changes in performance is generally considered more difficult than detecting changes in impairment (7). Although further work is needed, it appears that the AMAT-9 compares favorably to the FMA, ARAT and WMFT is detecting change over time but with the advantage of measuring primarily activity limitation (4, 7).
Among the limitations to our data is the fact that our sample was not randomly selected from community nor chosen to represent a wide range of scoring on the AMAT. Rather, it was a relatively young group of highly motivated persons with stroke seeking participation in clinical trial after exhausting other traditional treatment options. The inclusion criteria would have allowed higher level subjects, yet, the sample demonstrated moderate to severe levels of upper extremity activity limitation. None of the subjects had complete hemiplegia, however. The sample size was modest at 32 for the validity and 29 for the SRM determinations. However, even in subgroup analyses where cell sizes were small, differences in normalized AMAT-9 scores between cells were significant or nearly significant suggesting reasonable power. The collapse of the 6 AMAT-9 items into a dichotomous score for Rasch analyses could lead to the loss of precision – but did not appear to detrimentally impact the reliability analyses. Standard errors are large in this small sample and may affect our ability to detect anything other than the most severe misfit with the model. Because the robotics protocol stipulated several, specific upper extremity assessment, we were unable to include other objective measures of activity limitation, such as the FIM or BI. The burden of assessments would have been too great for the participants. Finally, the assessor was not blinded to the study design or hypotheses and the upper extremity measures were not administered in a random order.
In summary, we use classical test and item response theory to support the reliability, construct and content validity and relative responsiveness of a 9 item version of the AMAT in persons with stroke. Our observations are made among a sample with substantially lower scores than previous studies, indicating the AMAT is valid through a wide range of impairment. The scale has a strong ability to distinguish activity limitation among narrow subgroups subjects with severe functional limitations and detect changes over time as a result of treatment. This 9 item version of the AMAT may be particularly useful when evaluating persons with stroke who have severe mobility or balance issues impacting their ability to stand independently. Further study is warranted regarding a minimally clinically important difference in AMAT-9 scores, a better understanding of its ability to differentiate remediation and compensation, exploration of its use in other populations (i.e., traumatic brain injury) and Rasch analyses using larger sample sizes.
ACKNOWLEDGEMENTS
The authors are indebted to Joan Toglia, Ph.D. of Mercy College, Dobbs Ferry, New York for her input in the study design and completion.
This research was funded in part by the Orentreich Family Foundation and the Peter Jay Sharp Foundation, both based in New York, New York.
Dr. Paul Christos was partially supported by the following grant: Clinical Translational Science Center (CTSC) (2UL1TR000457-06).
REFERENCES

