Petteri Koho, PT, MSc1, Katja Borodulin, PhD2, Hannu Kautiainen, BA3,4, Urho Kujala, MD, PhD5, Timo Pohjolainen, MD, PhD1 and Heikki Hurri, MD, PhD1
From the 1ORTON Ltd, ORTON Foundation, 2Chronic Disease Prevention Department, National Institute for Health and Welfare, 3Department of General Practice, Unit of Primary Health Care and University of Helsinki, Helsinki University Central Hospital, 4Unit of Primary Health Care, Kuopio University Hospital and 5Department of Health Sciences, University of Jyväskylä, Jyväskylä, Finland
OBJECTIVES: To create reference values for the general Finnish population using the Tampa Scale of Kinesiophobia (TSK-FIN), to study gender differences in the TSK-FIN, to assess the internal consistency of the TSK-FIN, to estimate the prevalence of high levels of kinesiophobia in Finnish men and women, and to examine the association between kinesiophobia and leisure-time physical activity and the impact of co-morbidities on kinesiophobia.
METHODS: The study population comprised 455 men and 579 women. Participants completed a self-administered questionnaire about their socio-demographic factors, leisure-time physical activity, co-morbidities and kinesiophobia.
RESULTS: The mean TSK-FIN score was significantly higher for men (mean 34.2, standard deviation (SD) 6.9) compared with women (mean 32.9, SD 6.5), with an age-adjusted p = 0.004 for the difference between men and women. Cronbach’s alpha was 0.72, indicating substantial internal consistency. Men over 55 years of age and women over 65 years of age had a higher (p < 0.001) TSK score compared with younger people. There was a significant (p < 0.001) inverse association between kinesiophobia and leisure-time physical activity among both sexes. The presence of cardiovascular disease, musculoskeletal disease or a mental disorder was associated with a higher TSK-FIN score compared with the absence of the aforementioned disorders.
CONCLUSION: We present here the reference values for the TSK-FIN. The reference values and prevalence among the general population may help clinicians to define the level of kinesiophobia among patients. Disorders other than musculoskeletal diseases were associated with kinesiophobia, which should be noted in daily practice.
Key words: pain-related fear; reference values; physical activity; co-morbidities.
J Rehabil Med 2015; 47: 00–00
Correspondence address: Petteri Koho, ORTON Ltd, ORTON Foundation, Tenholantie 10, FI-00280 Helsinki Finland. E-mail: petteri.koho@orton.fi
Accepted Oct 9, 2014; Epub ahead of print Dec 2, 2014
Introduction
Psychological factors are implicated in the transition to chronic low back pain (1) as well as in predicting return to work (2). Research shows that pain-related fear can be more disabling than pain itself. Earlier studies have demonstrated that fear of movement and fear of (re)injury are better predictors of functional limitations than biomedical parameters (3). Crombez et al. (4) demonstrated that pain-related fear was the best predictor of behavioural performance in trunk extension, flexion and weight-lifting tasks when separating out the effects of pain intensity. High levels of fear avoidance beliefs are related to increased levels of disability (5, 6). Pain-related fear is also associated with increased muscular reactivity, which may change the biomechanics of the spine and lead to an overload of the intervertebral discs (7, 8). In particular, fear of movement is significantly associated with disability in chronic low back pain (9, 10). Decreasing the fear of movement is a goal of pain management and rehabilitation activities. Reducing pain-related anxiety seems to predict an improvement in functioning, affective distress, pain and pain-related interference with activity (11).
The Tampa Scale of Kinesiophobia (TSK) has become one of the most frequently employed measures for assessing pain-related fear in patients with chronic pain. However, few data are available for TSK values among the general population. Houben et al. (12) have reported TSK values for the general population and for patients with low back pain. However, they used a rephrased version of the TSK, and the effect of age or sex on the TSK values was not reported.
The main aim of this study was to investigate kinesiophobia among the general population and to create reference values in the Finnish general population using the Tampa Scale of Kinesiophobia (TSK-FIN). The secondary aims were: (i) to study differences in each item of the TSK-FIN between men and women; (ii) to assess the internal consistency of the TSK-FIN; (iii) to estimate the prevalence of high kinesiophobia in Finnish men and women; and (iv) to examine the association between kinesiophobia and leisure-time physical activity and the impact of co-morbidities on kinesiophobia.
Methods
Subjects
The present study was part of the National FINRISK 2007 survey (13). The kinesiophobia study was carried out in the Turku and Loimaa area. The random sample taken from the Finnish population register comprised 1,714 participants, of whom 1,054 (61%) completed the TSK-FIN questionnaire. After excluding 10 subjects with no TSK data and 10 with incomplete TSK data, the final study population comprised 455 men and 579 women. The coordinating ethics committee of the Hospital District of Helsinki and Uusimaa approved the study protocol, and each participant gave their written informed consent.
Measures
The participants received a self-administered questionnaire asking about their socio-demographic factors, leisure-time physical activity, co-morbidities and kinesiophobia. They completed the questionnaire at home and returned it to the study site, where anthropometric measurements, blood pressure measurements, blood sampling and a balance test were carried out.
Kinesiophobia
The Finnish version of the TSK (14) (TSK-FIN) was used to assess fear of movement/(re-)injury. The TSK-FIN is a 17-item questionnaire. Each item is assessed using a 4-point Likert scale: strongly disagree, disagree, agree or strongly agree. A total score is calculated after first inverting items 4, 8, 12 and 16. The scores range from 17 to 68; a higher score indicates a greater fear of movement. TSK value greater than 37 as a cut-off point for high kinesiophobia was originally proposed by Vlaeyen et al. (15). Later Lundberg et al. (16) concluded that the TSK value greater than about 40 is an indication of high kinesiophobia. The original questionnaire in English has demonstrated good internal consistency, test-retest stability and validity (17, 18). The Dutch and Swedish (15, 16, 19, 20) versions of the questionnaire have also shown an acceptable level of internal consistency, test-retest reliability and validity. The TSK-FIN has also shown acceptable test-retest reliability and internal consistency (21).
Physical activity
The level of leisure-time physical activity was measured with the question: “How much do you exercise and strain yourself physically in your leisure time?” The response options were as follows: (1) In my leisure time, I read, watch TV and do other activities where I do not move much and do not strain myself physically; (2) In my leisure time, I walk, cycle and move in other ways at least 4 h per week; (3) In my leisure time, I exercise at least 3 h per week, and; (4) In my leisure time, I practice regularly several times per week for competition. Response option (1) was considered the “low” category, response option, (2) was considered the “medium” category, and response options (3) and (4) were merged into the “high” category. This instrument has shown good internal validity for measuring all-cause and cardiovascular mortality (22).
Co-morbidities
Participants were asked if during the last 12 months they have had any co-morbidities that were identified or treated by a medical doctor. The answers were coded as “yes” or “no” in the analyses and classified as cardiovascular disease, musculoskeletal disease and mental disorder. In addition, participants were asked if they have had a road traffic accident, an accident at work or at home, a sports-related accident or an accident during their leisure time that required medical treatment.
Statistical analysis
The results are presented as the mean with standard deviation (SD) or as counts with percentages. The 95% confidence intervals (95% CI) are given for the most important outcomes. Statistical comparisons between groups were performed using the t-test or a bootstrap-type t-test (5,000 replications) for continuous data and the χ2 test for categorical variables. The association between kinesiophobia and age was investigated using the Pearson correlation coefficient. All analyses adjusted for background factors were performed using bootstrap-type analysis (23) 5,000 replications) of co-variance (ANCOVA) with an appropriate contrast. Internal consistency was estimated by calculating Cronbach’s alpha with 95% confidence intervals. Item-by-item differences between men and women were compared using a t-test, and adjustment for multiple comparisons was made using the Bonferroni correction. We calculated the cumulative distribution to estimate the prevalence of high kinesiophobia. The α-level was set at 0.05 for statistical significance. The STATA 11.1, StataCorp LP (College Station, Texas, USA) statistical package was used for the analyses.
Results
Baseline characteristics
Those who participated in the study were older than non-participants (mean age 50.2 years, vs 46.9 years, p < 0.001). There were more men among those who did not participate (57% vs 43%, p < 0.001). Men had a higher body mass index (BMI). Men were more often married than women, and they also had been in more accidents in the last 12 months. Women had a higher level of education and more mental disorders than men. Men reported high leisure-time physical activity more often than women. Otherwise, there were no differences between the sexes. The participants’ demographic and clinical characteristics are shown in Table I.
|
Table I. Demographics and clinical characteristics for men and women |
|||
|
Variable |
Men n = 455 |
Women n = 579 |
p-value |
|
Age, years, mean (SD) |
51 (14) |
49 (14) |
0.19 |
|
Body mass index, mean (SD) |
27.5 (4.2) |
26.5 (5.4) |
0.001 |
|
Marriage or cohabitation, n (%) |
337 (73) |
366 (63) |
< 0.001 |
|
Education years, mean (SD) |
13 (4) |
14 (4) |
0.001 |
|
Educational status, n (%) |
0.073 |
||
|
Basic education only |
92 (20) |
88 (15) |
|
|
Upper secondary school |
64 (14) |
83 (14) |
|
|
Vocational education |
119 (26) |
132 (23) |
|
|
Upper secondary school and vocational education |
106 (23) |
160 (27) |
|
|
Higher education |
79 (17) |
123 (21) |
|
|
Employment status, n (%) |
0.35 |
||
|
Employed |
282 (61) |
368 (63) |
|
|
Unemployed |
36 (8) |
45 (8) |
|
|
Student |
16 (3) |
31 (5) |
|
|
Pension |
126 (27) |
140 (24) |
|
|
Leisure-time physical activity, n (%) |
0.011 |
||
|
Low |
111 (25) |
121 (21) |
|
|
Moderate |
212 (47) |
324 (56) |
|
|
High |
131 (29) |
133 (23) |
|
|
Co-morbidity, n (%) |
|||
|
Cardiovascular disease |
127 (28) |
132 (23) |
0.061 |
|
Musculoskeletal disease |
110 (24) |
121 (21) |
0.23 |
|
Mental disorder |
24 (5) |
67 (11) |
< 0.001 |
|
Accident during last 12 months, n (%) |
87 (19) |
79 (14) |
0.021 |
|
SD: standard deviation. |
|||
Gender differences
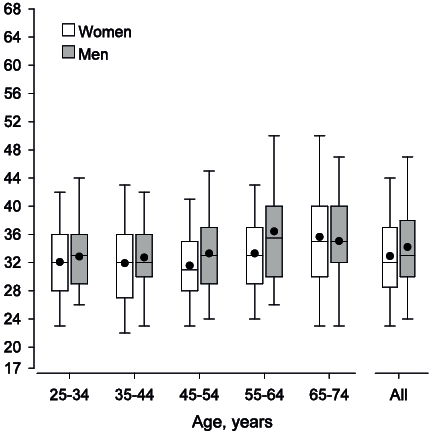
The mean TSK-FIN score was significantly higher for men. The mean TSK-FIN for men was 34.2 (SD 6.9, range 17–61), whereas for women it was 32.9 (SD 6.5, range 18–58) (p = 0.004 for mean difference after adjusting for age). The TSK-FIN score and age were associated in both sexes (men: r = 0.173, p < 0.01; women: r = 0.192, p < 0.001). Men over 55 years of age and women over 65 years of age had significantly higher (p < 0.001 for men and women) TSK scores than younger persons (Fig. 1). For the age group 55–64 years, men had a higher TSK-FIN score (36.6, SD 7.9) than women (33.3, SD 6.1), p = 0.001).
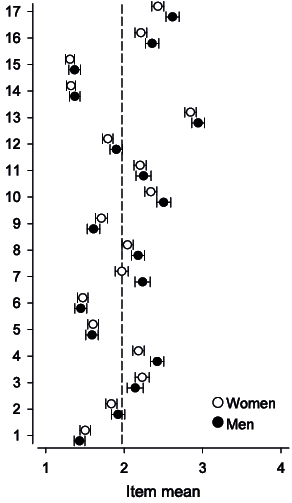
We also explored the differences between men and women for each item of the TSK-FIN (Fig. 2). Men had a significantly higher mean for items 4 (p < 0.001), 7 (p < 0.001), 8 (p = 0.015), 10 (p = 0.006), 12 (p = 0.042), 16 (p = 0.013) and 17 (p = 0.001). After adjustment for multiple comparisons only items 4 (p < 0.001), 7 (p < 0.001) and 17 (p = 0.022) reached statistical significance (Table II). Items 15, 14, 6 and 1 had the smallest impact on the total TSK-FIN score, whereas items 13, 17 and 10 had the highest impact on the total score. Cronbach’s alpha was 0.72 (95% CI 0.68–0.76), indicating substantial internal consistency.
|
Table II. Results of each item of Tampa Scale of Kinesiophobia (TSK-FIN) for men and women with crude and adjusted p-values for mean difference |
||||||||||||||
|
TSK-FIN item |
Median |
Range |
IQR |
Mean |
p-value |
|||||||||
|
Men |
Women |
Men |
Women |
Men |
Women |
Men |
Women |
Crude |
Adjusteda |
|||||
|
1 |
1 |
1 |
1–4 |
1–4 |
1 |
1 |
1.4 |
1.5 |
0.14 |
0.62 |
||||
|
2 |
2 |
2 |
1–4 |
1–4 |
1 |
1 |
1.9 |
1.8 |
0.12 |
0.61 |
||||
|
3 |
2 |
2 |
1–4 |
1–4 |
2 |
2 |
2.1 |
2.2 |
0.20 |
0.70 |
||||
|
4 |
2 |
2 |
1–4 |
1–4 |
1 |
1 |
2.4 |
2.2 |
< 0.001 |
< 0.001 |
||||
|
5 |
1 |
1 |
1–4 |
1–4 |
1 |
1 |
1.6 |
1.6 |
0.79 |
0.86 |
||||
|
6 |
1 |
1 |
1–4 |
1–4 |
1 |
1 |
1.4 |
1.5 |
0.61 |
0.86 |
||||
|
7 |
2 |
2 |
1–4 |
1–4 |
2 |
2 |
2.2 |
2.0 |
< 0.001 |
< 0.001 |
||||
|
8 |
2 |
2 |
1–4 |
1–4 |
1 |
1 |
2.2 |
2.0 |
0.015 |
0.15 |
||||
|
9 |
1 |
1 |
1–4 |
1–4 |
1 |
1 |
1.6 |
1.7 |
0.079 |
0.52 |
||||
|
10 |
3 |
2 |
1–4 |
1–4 |
1 |
1 |
2.5 |
2.3 |
0.006 |
0.078 |
||||
|
11 |
2 |
1 |
1–4 |
1–4 |
2 |
1 |
2.2 |
2.2 |
0.49 |
0.86 |
||||
|
12 |
2 |
2 |
1–4 |
1–4 |
1 |
1 |
1.9 |
1.8 |
0.039 |
0.33 |
||||
|
13 |
3 |
3 |
1–4 |
1–4 |
2 |
1 |
2.9 |
2.8 |
0.083 |
0.52 |
||||
|
14 |
1 |
1 |
1–4 |
1–4 |
0 |
0 |
1.4 |
1.3 |
0.28 |
0.72 |
||||
|
15 |
1 |
1 |
1–4 |
1–4 |
0 |
0 |
1.4 |
1.3 |
0.21 |
0.70 |
||||
|
16 |
2 |
2 |
1–4 |
1–4 |
1 |
1 |
2.3 |
2.1 |
0.013 |
0.14 |
||||
|
17 |
3 |
2 |
1–4 |
1–4 |
1 |
1 |
2.6 |
2.4 |
0.001 |
0.022 |
||||
|
aAdjusted for multiple comparisons. IQR: interquartile range. |
||||||||||||||
Cumulative distribution
We calculated the cumulative distribution of the TSK-FIN for men and women separately in order to estimate the prevalence of high kinesiophobia within the general population. Of all the subjects, 16.1% received 40 points or more. There were no significant differences between men (17.6%) and women (14.9%). If the cut-off point for high kinesiophobia is set at greater than 37 points, then 24.5% of the subjects are considered as kinesiophobic (Fig. 3).
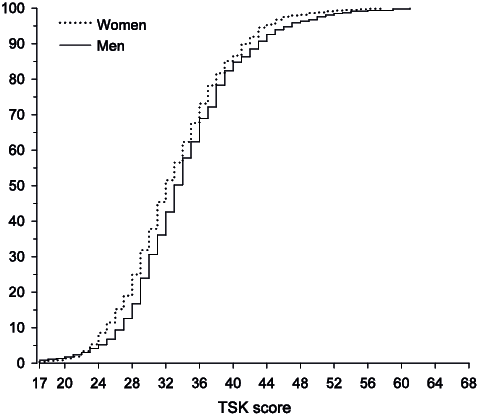
Fig. 3. Cumulative distribution of the Tampa Scale of Kinesiophobia-FIN (TSK-FIN) scores for men and women.
Association between kinesiophobia and physical activity
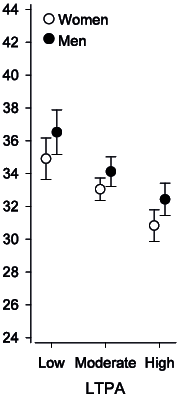
When considering the whole study population, there was a significant (p < 0.001) inverse association between kinesiophobia and leisure-time physical activity in both sexes after adjusting for age (Fig. 4). In the subgroup analyses of participants with “only musculoskeletal disease”, “only one accident during the last 12 months” or the “presence of 2 or more diseases”, the kinesiophobia score was inversely associated with physical activity (Table III). This association was not observed in the apparently healthy subgroup or in the only cardiovascular or only mental disorder subgroups.
|
Table III. Values of Tampa Scale of Kinesiophobia-FIN (TSK-FIN) among leisure-time physical activity (LTPA) groups in apparently healthy, only cardiovascular, only musculoskeletal, only mental disorder, only accident and 2 or more co-morbidities subgroups |
||||||
|
LTPA |
p-value |
|||||
|
Low Mean (SD) [n] |
Medium Mean (SD) [n] |
High Mean (SD) [n] |
Crude |
Adjusteda |
||
|
Apparently healthy |
33.8 (6.3) [85] |
32.9 (6.1) [266] |
31.9 (6) [161] |
0.056 |
0.11 |
|
|
Only cardiovascular disease |
35.4 (6.8) [38] |
34.6 (6.6) [71] |
33 (6.1) [27] |
0.34 |
0.40 |
|
|
Only musculoskeletal disease |
36 (6.9) [17] |
34.2 (6.1) [58] |
30.6 (5.2) [19] |
0.027 |
0.03 |
|
|
Only mental disorder |
35.3 (7.2) [14] |
31.9 (4.8) [16] |
34.4 (4.4) [5] |
0.28 |
0.23 |
|
|
Only accident during last 12 months |
35.2 (4.3) [19] |
32.3 (6.1) [36] |
29.8 (3.8) [25] |
0.003 |
0.005 |
|
|
Two or more diseasesb |
39.1 (8.5) [60] |
34.8 (7.5) [91] |
31.6 (4.7) [28] |
< 0.001 |
< 0.001 |
|
|
aAdjusted for sex and age. bIncluding accidents. SD: standard deviation. |
||||||
The presence of cardiovascular disease, musculoskeletal disease or mental disorder was significantly associated with a higher TSK-FIN score compared with an absence of the aforementioned disorders. Whether or not the participant had been in an accident during the last 12 months was not associated with the TSK-FIN score. The crude and adjusted p-values are shown in Table IV.
|
Table IV. Values of Tampa Scale of Kinesiophobia-FIN (TSK-FIN) in cardiovascular, musculoskeletal, mental disorder and accident subgroups when disease is absent or present |
||||
|
Absent Mean (SD) [n] |
Present Mean (SD) [n] |
p-value |
||
|
Crude |
Adjusteda |
|||
|
Cardiovascular disease |
33.1 (6.2) [778] |
35.0 (7.5) [261] |
< 0.001 |
0.039 |
|
Musculoskeletal disease |
33.2 (6.3) [806] |
35.0 (7.3) [233] |
< 0.001 |
0.018 |
|
Mental disorder |
33.4 (6.6) [947] |
34.8 (6.9) [92] |
0.053 |
0.015 |
|
Accident during last 12 months |
33.4 (6.5) [873] |
34.3 (7.3) [166] |
0.31 |
0.16 |
|
aAdjusted for sex and age. SD: standard deviation. |
||||
Discussion
The present study reports the reference values of the TSK-FIN. Men had significantly higher values in the total TSK-FIN score compared with women. Age and the TSK-FIN score were associated with one another in both sexes, with older people having higher mean values than the younger age groups. The presence of cardiovascular disease, musculoskeletal disease or mental disorders was significantly associated with a higher score in the TSK-FIN compared with an absence of the aforementioned disorders. Whether or not the participant had been in an accident in the last 12 months did not have an impact on the TSK-FIN score. There was a significant inverse association between kinesiophobia score and leisure-time physical activity in both sexes. The internal consistency for the total scale was good.
The sample represents one of the largest population-based studies for TSK reference values that the authors know of, and it is the very first study in the Finnish population. The TSK scores found in the present study are in line with those from earlier studies. Houben et al. (12) reported mean TSK scores among the general population of 32.9 without back complaints (n = 517) and 33.6 for those with back complaints (n = 609). However, they used re-phrased questions, which might have affected the results. In addition, comparing the results more deeply is difficult because they did not report separately the TSK scores for men and women or the association between kinesiophobia and age. Lundberg et al. (24) reported a median value of 30 among the aerobics group and 44 for the patient group with respect to the TSK scores.
Roelofs et al. (25) previously compiled data on the norms for the TSK in various countries. They used data from Dutch, Canadian and Swedish pain patient samples (n = 3082). They found that, in the Dutch patient sample (n = 2236), sex and age were predictive of the TSK score, with men having somewhat higher scores than women, and older patients having higher scores than younger patients. In the Canadian (n = 510) and Swedish (n = 336) patient samples, sex was predictive of the TSK scale, with men having higher scores than women. Bränström et al. (26) found that men reported higher TSK scores, but age and the TSK score were not associated among the Swedish patient sample. Damsgård et al. (27) reported that the Norwegian translation of the TSK has acceptable internal consistency and criterion validity, but found that the scale is quite robust across age and sex as well as for patients with low back pain and widespread pain. The link between sex and kinesiophobia remains controversial. The observed differences between this study and earlier studies in terms of sex and kinesiophobia may be due to the fact that the present study is based on a population sample and not on a patient series.
Vlaeyen et al. (15) originally proposed using TSK values greater than 37 as a cut-off point between low and high kinesiophobia. A number of different cut-off values, ranging from greater than 35 to greater than 44, have been used later (16, 28, 29). This reflects the fact that distribution of the TSK might be sample specific. Many studies have used the mean or median as the cut-off point for high kinesiophobia. This makes sense from a statistical point of view. However, this may result in overestimating the number of patients with elevated or harmful kinesiophobia. Moreover, assessment of an individual patient’s level of kinesiophobia may be misleading if it is based on data drawn from a specific patient sample. Therefore, a cut-off point drawn from a large sample might give a more precise view.
An interesting note in the present study was that when looking at single items, significant differences between men and women were found in 7 of the items, including all of the reversed items. If the reversed items are removed, then the observed difference in the mean TSK between men and women no longer exists (data not shown). Lundberg et al. (24) have pointed out that in 8 out of 11 different factor solutions for the TSK the reversed items have been removed. This issue needs to be elaborated upon in more depth in the future.
There was a significant inverse association between kinesiophobia and leisure-time physical activity in both sexes after adjusting for age. This has been reported earlier by Elfving et al. (30). Our earlier observations also corroborate with the present result (29). However, this connection is not yet clear. The novel data presented by Demoulin et al. (31) about pain-related fear and physiological abilities addresses this issue further. Their study shows that neither the task-specific tool (fear visual analogue scale) nor the non-task-specific questionnaires (TSK and Photograph Series of Daily Activities, PHODA), correlated significantly with the physical spine tests for patients with chronic LBP. This is contrary to earlier evidence, according to which physical capacity is inversely related to the level of pain-related fear (4, 30). Demoulin et al. (31) conclude that one should not draw conclusions about physical capacity based on pain-related fear scores. Furthermore, the different assessment tools for pain-related fear were not correlated with each other in that particular study. Clearly, more studies are needed to assess this connection in more detail in various test situations and clinical settings and among the general population.
There are only a few studies that connect diseases other than musculoskeletal diseases to kinesiophobia. Back et al. (32) have reported a high level of kinesiophobia (over 37 points) in patients with coronary artery disease. They used a modified questionnaire (TSK-SV Heart), which makes it difficult to compare the results with those from other studies (33). HajGhanbari et al. (34) found that patients with chronic obstructive pulmonary disease have a higher level of kinesiophobia than healthy people. In addition to musculoskeletal disease, the presence of cardiovascular disease and mental disorders was significantly associated with a higher TSK-FIN score than the absence of the aforementioned disorders in our study. Hence, kinesiophobia may reflect even more generally our tendency to react to various health conditions beyond musculoskeletal disorders. Whether or not the participant had been in an accident in the last 12 months was not associated with the TSK-FIN score. The relevance of these observations remains obscure so far, and calls for further study.
Study limitations
This study has some limitations. The participants comprised a random sample from the Finnish population register in the Turku and Loimaa area. The response rate for the TSK-FIN was 61%. Harald et al. (35) have pointed out that younger men with a low socio-economic status in particular are over-represented among non-responders. This was also observed in the present study, and may have biased the results. If the non-participants were included, the associations studied could be even stronger, particularly for age-related increase in the score. There are limitations in using self-report questionnaires to assess physical activity. People have a tendency to overestimate their physical activity (36). Motion sensors, such as pedometers or accelerometers, would have yielded more objective data on physical activity. However, these devices have limitations. They tend to underestimate walking and overestimate jogging activity, and they fail to detect arm movements, resistance exercise and the performance of external work (37); furthermore, they are not suitable for physical activity in water.
Information on co-morbidities was also based on self-reports. The participants were asked if they have had any co-morbidities during the last 12 months that were identified or treated by a medical doctor. Respectively, the participants were asked if they had been in a road traffic accident, had had an accident at work or at home, a sports-related accident, or an accident during leisure time that had required medical treatment. Therefore, subgroup analyses regarding the association between kinesiophobia and leisure-time physical activity should be treated as preliminary; in addition, some of the group sizes were small.
Conclusion
We have presented reference values for the TSK-FIN. Age and the TSK-FIN score were associated with one another in both sexes; older age groups had higher scores than younger ones. Men had higher mean scores overall and there were also gender differences in an item-by-item comparison. Kinesiophobia and leisure-time physical activity were associated with one another; likewise, the presence of co-morbidities was associated with the TSK-FIN score. The relevance of kinesiophobia in daily practice among musculoskeletal patients is quite evident. Further studies are needed to study the validity of the TSK-FIN with all the 17 items and the 11-item version, which was originally introduced by Woby et al. (18). In addition, the impact of kinesiophobia on physical activity should be elaborated upon in larger subgroups for various diseases.
The authors declare no conflicts of interest.
References

