
From the 1Department of Kinesiology & Community Health, University of Illinois at Urbana-Champaign, Urbana, 2Department of Physical Therapy, University of Alabama at Birmingham, Birmingham, USA and 3Interdisciplinary School of Health Sciences, University of Ottawa, Ottawa, Canada
Objective: To further characterize the oxygen uptake efficiency slope (OUES) in persons with multiple sclerosis through a direct comparison with matched controls, and by examining differences across the multiple sclerosis disability spectrum. Also, to validate the OUES as an alternative method, which can be derived from submaximal exercise testing, for expressing cardiorespiratory fitness in persons with mild-to-severe multiple sclerosis.
Participants: A total of 62 participants (Expanded Disability Status Scale (EDSS) = 1.5–6.5) with MS and 21 non-multiple sclerosis controls completed a symptom-limited cardiopulmonary exercise test.
Results: The OUES was significantly lower in persons with multiple sclerosis (mean 1,708.5 (standard deviation (SD) 503.7)) compared with non-multiple sclerosis controls (mean 2074.2 (SD 823.2)). With regards to the multiple sclerosis sample, there was a significant difference in the OUES (F[2,59] = 8.9, p < 0.001, ηρ2 = 0.23) across the multiple sclerosis disability spectrum. The OUES was significantly correlated with both OUES50 (r = 0.86) and OUES75 (r = 0.91), and Bland-Altman plots demonstrated agreement between OUES and submaximal OUES values.
Conclusion: Overall, the OUES is a viable method for expressing cardiorespiratory fitness in individuals with multiple sclerosis, and submaximal OUES is an appropriate alternative when maximal exercise testing is not feasible.
Key words: multiple sclerosis; cardiorespiratory fitness; disability; oxygen uptake efficiency slope; submaximal.
Accepted Dec 19, 2016; Epub ahead of print Feb 24, 2017
J Rehabil Med 2017; 49: 234–240
Correspondence address: Lara A Pilutti, Interdisciplinary School of Health Sciences, University of Ottawa, 200 Lees Avenue E250G, Ottawa, ON K1N6N5, Canada. E-mail: lpilutti@uottawa.ca
Cardiorespiratory fitness (CRF) is considered an important indicator of health status across populations, and low CRF is associated with increased risk of morbidity and mortality (1). Persons with multiple sclerosis (MS) have significantly lower CRF levels compared with matched controls (2), presumably due to physical inactivity-induced deconditioning and processes associated with the disease itself. Importantly, CRF has been associated with neurological disability, brain structure, walking performance, cognitive function, body composition, symptoms, and quality of life in persons with MS (3–9). Therefore, the appropriate evaluation and expression of CRF in MS is critical for research and clinical practice.
The gold standard for evaluating CRF is the cardiopulmonary exercise test (CPET) performed to exhaustion. Peak oxygen uptake (VO2peak) is the commonly accepted method for expressing CRF (10). However, VO2peak may not be the most appropriate expression of CRF for persons with chronic disease, such as MS. Indeed, persons with MS experience impairment in gait, balance, sensation, autonomic function, muscle structure and function, and increased fatigue and pain (4). Such impairments may limit the capacity of persons with MS to attain maximal or peak exertion during exercise testing (11). Due to these limitations, submaximal expressions of CRF have been proposed. Baba (12) introduced an alternative, objective, and effort-independent method for expressing CRF in the oxygen uptake efficiency slope (OUES). The OUES was originally developed to describe CRF in paediatric patients with congenital heart disease, as a maximal CPET would not be viable due to the potentially dangerous nature of this testing. The OUES is derived from the curvilinear relationship between minute ventilation (VE) and oxygen consumption (VO2). Through log-transformation of the VE, a linear relationship between log VE and VO2 is established as follows:
VO2=α×log10VE+β
The slope (α) represents the OUES, a measure of the efficiency of oxygen uptake with increasing VE. A steeper slope, or higher OUES, therefore represents greater efficiency in the use of oxygen, indicating better CRF (12). Currently, there has been only one examination of the validity of the OUES in persons with MS (13).
The aims of this secondary analysis of data involving cardiorespiratory fitness testing using a recumbent stepper in persons with MS were: (i) to further characterize the OUES in persons with MS through a direct comparison with matched non-MS controls and by examining differences across the MS disability spectrum (i.e. mild-to-severe MS disability); and (ii) to validate the OUES as an alternative indicator of CRF, which can be derived from submaximal exercise testing, in persons with mild-to-severe MS.
A secondary analysis of data from a cross-sectional investigation of physical fitness testing modalities in persons with MS was conducted (7). That study included 62 participants with MS and 21 non-MS controls who completed a symptom-limited CPET. Participants were specifically recruited such that there was equal distribution across the disability spectrum (i.e. mild = EDSS 1.0–3.5; moderate = EDSS 4.0–5.5; severe = EDSS 6.0–6.5) (14). Inclusion criteria for all participants were: age 18–64 years; able to visit our laboratory on 2 test occasions; minimal risk when engaging in physical activity (i.e. reported “yes” to less than 2 questions on the Physical Activity Readiness Questionnaire (PAR-Q) (15); and physician approval for undertaking exercise testing. Additional criteria for those with MS were a physician-confirmed diagnosis of MS and an EDSS score < 7.0. Initial disability status was determined via telephone using the self-reported EDSS (16). A detailed description of participant recruitment and enrollment is published elsewhere (4, 7, 17).
Neurological disability. Disability status was determined through a clinically-administered EDSS (16) examination by a Neurostatus-certified assessor (www.neuroststus.net). Participants were grouped based on the clinically-determined EDSS score (i.e. mild = EDSS 1.0–3.5; moderate = EDSS 4.0–5.5; severe = EDSS 6.0–6.5) (14). Mild MS (EDSS = 1.0–3.5) describes individuals who are fully ambulatory. Moderate MS (EDSS = 4.0–5.5) describes individuals who are ambulatory without aid for approximately 500 m. Severe MS (EDSS = 6.0–7.0) describes individuals who require unilateral or bilateral assistance for ambulation. This disability categorization is consistent with previous studies in persons with MS (4, 11, 14).
Height and weight. Height and weight were measured in the laboratory to the nearest 0.1 cm or kg, respectively, using a scale with a stadiometer (Detecto, Webb City, MO, USA).
Cardiopulmonary exercise test. Cardiorespiratory capacity was assessed using a symptom-limited incremental exercise protocol performed on a recumbent stepper (Nustep T5XR recumbent stepper, Nustep Inc., Ann Arbor, MI, USA) (7). A recumbent stepper was chosen for this protocol as it allows for the use of both the upper and lower limbs, limiting premature termination of fitness testing due to peripheral fatigue. This modality is also physically accessible for individuals who experience severe mobility impairment and greatly reduces the risk of injury while transferring and/or using the equipment. The recumbent stepper further stabilizes the feet and lower limbs, providing greater body control and alignment during exercise. The exercise test began with a 1-min warm-up at 15 W. The exercise protocol began at 15 W and the resistance was gradually increased at a predetermined rate. For non-MS controls and participants with mild-to-moderate MS (EDSS 1.0–5.5), the workload was increased by 10 W/min. For participants with severe MS (≥ 6.0 EDSS) the workload was increased by 5 W/min (7). An incremental exercise protocol allows for a gradual physiological response to increases in workload, resulting in a linear relationship between VO2 and work rate. The protocol is suitable for people with low exercise tolerance and/or low fitness, such as MS (18) and similar incremental exercise protocols have been used in other MS samples (6). Expired gases were collected using a 2-way, non-rebreathable valve (Hans Rudolph Inc., Shawnee, KS, USA) connect with an open circuit spirometry system (TrueOne 2400, Parvo Medics, Sandy, UT, USA). This system continuously measured oxygen consumption (VO2), carbon dioxide production (VCO2), and minute ventilation (VE). In addition, heart rate (HR) (Polar Electro Oy, Kempele, Finland) and ratings of perceived exertion (RPE) were recorded every minute using the Borg Scale of Perceived Exertion (19). Time to exhaustion (TTE) (s) was recorded when the participant could no longer continue and the exercise test was ended. The highest recorded 20-s VO2 value was reported as VO2peak (ml/kg/min). The following criteria were used as indicators of attaining VO2peak: (i) respiratory exchange ratio (RER) > 1.10; (ii) peak HR within 90% of age-predicted maximum (i.e. 220 minus age); or (iii) RPE > 17. These criteria are consistent with a previous research article that examined the OUES in persons with MS (13).
Protocol. All procedures were approved by a University Institutional Review Board and participants provided written informed consent. A member of the research team reviewed the informed consent document with the participant to ensure that the participant fully understood any risks associated with participation in the study. All testing took place at a university research laboratory. At the testing session, participants first underwent the EDSS examination. Standing height and weight were then assessed with participants in footwear and clothing. Participants were then given instructions for the CPET and completed the testing protocol. Lastly, participants completed a questionnaire to obtain demographic and clinical information. The testing session took approximately 60 min to complete and participants received USD 75.
Oxygen uptake efficiency slope. A linear regression equation was fitted onto the VO2 (ml/min) and the log-transformed VE (logVE), both of which were derived from the CPET (12). The slope of this regression was determined as the OUES. In addition, the OUES50 and OUES75 were calculated using the same method with 50% and 75% of the exercise test data, respectively, based on the time of the exercise test.
Ventilatory threshold. Due to the continuous measurement of VO2, VCO2, and VE it was possible to calculate additional CPET variables. Ventilatory equivalents for oxygen (VE/VO2) and carbon dioxide (VE/VCO2) were calculated and used to determine the ventilatory threshold (VT). VT was defined as the level of oxygen uptake during exercise when one of the following occurred: (i) an increase in VE/VO2 without an increase in VE/VCO2; or (ii) the absence of a linear relationship between VCO2 and VO2 (determined with the V-slope method) (20). This method for defining VT has been used in other studies involving people with MS (13, 21).
Percentage of peak HR (%HRpeak). In addition to the CPET variables that were recorded during testing, peak HR as a percentage of the age-predicted maximum HR was calculated and expressed as %HRpeak.
Data analysis was performed using IBM SPSS Statistics (Version 22.0, IBM Corp., Armonk, NY, USA). Descriptive statistics were used to summarize demographic, clinical, and CPET variables for participants with MS overall and by disability level, and non-MS controls. Comparisons were first made between MS and non-MS controls, then across the MS disability spectrum. Previous studies examining the OUES in persons with MS have made these comparisons, and therefore, we applied the same approach to further characterize, compare, and establish the use of the OUES in MS (13). Descriptive and clinical characteristics were compared between MS and control groups, and across the disability spectrum using independent samples t-tests, χ2 tests, and one-way analysis of variance (ANOVA) with post-hoc Bonferroni corrections. Frequency statistics were used to summarize how many participants satisfied each VO2peak criterion. Independent samples t-tests were used to compare CPET variables between persons with MS and non-MS controls. To compare differences in CPET variables across the MS disability spectrum, a one-way ANOVA was performed with post-hoc Bonferroni corrections. The association between the OUES and demographic and CPET variables was examined using bivariate Pearson product moment (r) correlation coefficients for the MS sample overall. The statistical significance level was adjusted to p < 0.005 based on comparisons across multiple CPET variables (i.e. 0.05/10 CPET variables). The magnitude of the correlation coefficients was interpreted as small, moderate, and large using the criteria 0.1, 0.3 and 0.5, respectively (22). Bland-Altman (23) plots were generated to examine overall and systematic differences between the OUES and submaximal OUES values (i.e. OUES50 and OUES75).
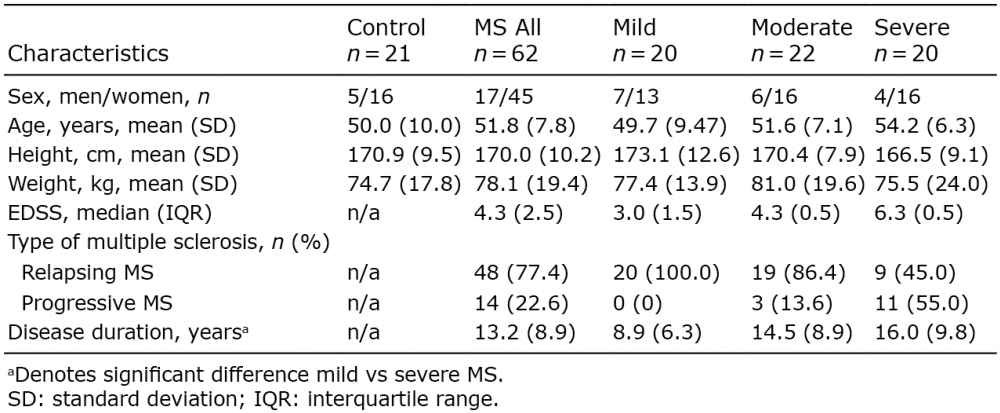
A total of 62 participants with MS and 21 non-MS controls completed the study. Table I presents the demographic and clinical characteristics for all participants. There were no significant differences between the MS sample and non-MS controls on any of the demographic variables (all p > 0.05).
Table I. Demographic and clinical characteristics for controls, persons with multiple sclerosis (MS) overall and by disability groups
There was a significant difference in disease duration by disability group, such that those with severe MS had a longer disease duration than those with mild MS (p = 0.03). There were no significant differences between disability groups on any of the other demographic variables (all p > 0.05).
As previously described, we applied 3 common criteria for determining VO2peak based on peak RER, HR, and RPE achieved during exercise testing. Using these criteria, 53 participants with MS (85.5%) and 18 controls (85.7%) met at least one criterion. With regards to the MS sample, 20 participants (32.3%) met only one criterion, 23 participants (37.1%) met 2 criteria, and 10 participants (16.1%) met all 3 criteria. With regards to the non-MS control sample, 2 participants (9.5%) met 1 criterion, 9 participants (42.9%) met 2 criteria, and 7 participants (33.3%) met all 3 criteria. Further examination of each specific criterion revealed that 38 participants (61.3%) from the MS group and 13 participants (61.9%) from the non-MS control group satisfied the RER criterion. With regards to the HR criterion, 21 (33.9%) participants from the MS group and 15 participants (71.4%) from the control group satisfied this criterion. With regards to the RPE criterion, 37 participants (59.7%) from the MS group and 13 participants (61.9%) from the control group satisfied this criterion. Furthermore, none of the participants experienced symptoms of exacerbation or increased disability in response to exercise testing.
Table II presents the CPET variables for non-MS controls and persons with MS (overall and by disability groups). There were significant differences in the OUES (t = 2.42, p = 0.02), OUES50 (t = 2.02, p = 0.046), OUES75 (t = 2.24, p = 0.03), VO2peak (t = 3.95, p = 0.001), VEpeak(t = 2.59, p = 0.01), VT (t = 3.55, p = 0.001), WRpeak (t = 3.94, p < 0.001), TTE (t = 3.32, p = 0.001), HRpeak (t = 3.45, p = 0.001) and %HRpeak (t = 3.45, p = 0.001) between persons with MS and non-MS controls, such that peak values were lower in persons with MS compared with non-MS controls. There was no significant difference in RERpeak (t = 1.03, p = 0.31) or RPEpeak (t = –0.12, p = 0.91) between MS and non-MS control groups.
Table II. Cardiopulmonary exercise test (CPET) variables for controls, persons with multiple sclerosis (MS) overall, and by disability groups
When comparing CPET values across the disability spectrum, there was a significant difference in the OUES (F[2,59] = 8.9, p < 0.001, ηρ2 = 0.23), OUES50 (F[2,59] = 7.5, p = 0.001, ηρ2 = 0.20), and OUES75 (F[2,59] = 8.3, p = 0.001, ηρ2 = 0.22). Bonferroni post-hoc analyses revealed significant differences in the OUES (p < 0.001), OUES50 (p = 0.001), and OUES75 (p < 0.001) between the mild and severe MS groups specifically. There were no other significant differences in the OUES values by MS disability group (all p > 0.05). Regarding other CPET variables, there were significant differences in VO2peak (F[2,59] = 16.18, p < 0.001, ηρ2 = 0.35), VEpeak (F[2,59] = 10.8, p < 0.001, ηρ2 = 0.27), VT (F[2,59] = 11.16, p < 0.001, ηρ2 = 0.27), WRpeak (F[2,59] = 24.29, p < 0.001, ηρ2 = 0.45), TTE (F[2,59] = 6.21, p = 0.004, ηρ2 = 0.17), HRpeak(F[2,59] = 11.37, p < 0.001, ηρ2 = 0.28) and %HRpeak (F[2,59] = 10.28, p < 0.001, ηρ2 = 0.26) by disability level. Bonferroni post-hoc testing revealed significant differences in VO2peak (p = 0.003), VEpeak (p = 0.03), VT (p = 0.01), WRpeak (p = 0.003), TTE (p = 0.005), HRpeak (p = 0.006) and %HRpeak (p = 0.007) between mild and moderate disability groups. When comparing those with mild to severe MS, there were significant differences in VO2peak (p < 0.001), WRpeak (p < 0.001), VT (p < 0.001), TTE (p = 0.002), VEpeak (p < 0.001), HRpeak (p < 0.001) and %HRpeak (p < 0.001). There was a significant difference in WRpeak (p = 0.001) between those with moderate and severe MS. There were no significant differences in RERpeak or RPEpeak across the disability spectrum. Overall, these results suggest that peak and submaximal OUES, as well as other CPET values, are lower in people with MS compared with non-MS controls. In addition, both the OUES and CPET values decreased as disability level increased.
Table III presents Pearson’s correlation coefficients between the OUES, other CPET variables, and demographic characteristics for the MS sample overall.
Table III. Bivariate Pearson’s correlation coefficients between the oxygen uptake efficiency slope (OUES), other cardiopulmonary exercise test (CPET) variables, and demographic characteristic for the multiple sclerosis (MS) sample overall (n = 62)
There were significant, moderate-to-strong correlations between the OUES and VO2peak (r = 0.66, p < 0.001). The OUES further correlated significantly with WRpeak (r = 0.78, p < 0.001), VT (r = 0.71, p < 0.001), TTE (r = 0.74, p < 0.001), VEpeak (r = 0.72, p < 0.001) HRpeak (r = 0.57, p < 0.001), and %HRpeak (r = 0.57, p < 0.001).
To examine the validity of submaximal OUES values, a subsample of participants with MS (n = 21) who satisfied the criterion for HRpeak during exercise testing were examined. It is presumed that participants who attain 90% of age-predicted HRpeak have achieved an exercise intensity above submaximal levels, and this criterion is consistent with previous research validating submaximal OUES in people with MS (13). The selected subsample in this study included 12 participants with mild disability, 6 with moderate disability, and 3 with severe disability. Within this sample, the OUES was significantly correlated with both the OUES50 (r = 0.89, p < 0.001) and the OUES75 (r = 0.97, p < 0.001). In addition, both the OUES50 and the OUES75 were significantly correlated with other CPET variables, including VO2peak, WRpeak, VT, TTE, and VEpeak (r = 0.47–0.83, p = < 0.001–0.03). The agreement between the OUES and the OUES50 and OUES75 are shown in Fig. 1. The mean difference between OUES and OUES50 was 176.6 (SD 272.3) and all differences were within 2 SD. The mean difference between OUES and OUES75 was 90.18 (SD 157.2), and all but one individual fell within 2 SD.
Fig. 1. Bland-Altman plots assessing the agreement between the oxygen uptake efficiency slope (OUES) and submaximal OUES values of participants with multiple sclerosis (MS). (A) Represents the agreement between OUES and OUES50. (B) Represents the agreement between OUES and OUES75. Dashed lines represent 95% limits of agreement and the horizontal solid line represents the mean difference.
The goal of this secondary analysis was to further characterize and validate the OUES, an alternative, objective, and effort-independent method for expressing CRF, in persons with MS using a recumbent stepper. Overall, the OUES was significantly steeper (i.e. higher) in non-MS controls compared with those with MS, and the OUES decreased with increasing disability. This study demonstrated moderate-to-strong correlations between the OUES values and other CPET variables, which are regarded as gold standards for expressing CRF. In addition, this study determined the validity of submaximal OUES. This is important, as it demonstrates that the OUES is a viable method for expressing CRF in persons with MS of varying disability levels that can be derived from submaximal exercise testing.
Overall, we determined that the OUES was 21% steeper (i.e. higher) in non-MS controls than in persons with MS, which suggests a lower efficiency of oxygen uptake with increasing ventilation in persons with MS. This difference was primarily attributed to the lower OUES values observed in the moderate and severe MS subgroups. Overall, this is consistent with the limited research that has examined the OUES in persons with MS. One study similarly observed a significantly flatter slope (–13.4%, p < 0.05) in 162 individuals with MS (median PDSS = 2.0) compared with 80 controls using a cycle ergometer (21). However, that study included an MS sample with relatively low disability. Another study, which examined the OUES in 56 persons with mild–moderate disability (mean EDSS = 2.8) who completed a peak CPET on an upright cycle ergometer (13), reported a flatter slope (i.e. lower OUES) in persons with MS compared with a non-MS reference sample, but did not include a direct comparison with matched-controls using the same CPET protocol. Other limitations of this work include a sample with primarily low disability level and pre-selected for fatigue symptoms. The OUES relies on the combined effort of the cardiovascular, respiratory, and musculoskeletal systems. Indeed, individuals with MS have compromised cardiovascular regulation, respiratory muscle weakness, decreased muscular strength, and reduced muscle oxidative capacity compared with non-MS controls (11, 24–28). These physiological alterations likely contribute to a flatter (i.e. lower) OUES observed in individuals with MS compared with non-MS controls.
When examining the OUES across the disability spectrum, we determined that the OUES becomes flatter as EDSS score increases, indicating a decrease in the efficiency of oxygen uptake with increasing disability. A similar relationship between the OUES, derived from a cycle ergometer test, and disability was reported in a sample of 56 participants with MS (13). In that study, a significant difference in the OUES was observed between participants with low disability (EDSS < 2.0) compared with those with moderate disability (EDSS > 4.5). However, as described previously, that study involved a limited disability range. Similarly, a negative relationship has been reported between VO2peak and disability status in MS (7, 11), suggesting impaired CRF with increasing disease severity and MS disability. This relationship may be attributed to increased symptoms and lower physical activity levels in individuals with MS with higher disability (4, 29), as well as greater physiological deconditioning reflecting impairments in cardiovascular, respiratory, and musculoskeletal systems, as described previously. Mobility disability in severe MS might further contribute to biomechanical inefficiencies in movement during exercise testing (4, 7), which could limit VO2peak- achieved during testing.
We demonstrated that the OUES had a significant relationship with other CPET outcomes. The OUES had a significant relationship with relative VO2peak, VEpeak, VT, WRpeak, TTE, HRpeak, and %HRpeak. Similarly, other studies have reported significant, strong associations between the OUES and other CPET outcomes in healthy populations (30–32). One study reported that the OUES had a significant relationship between VO2peak and WRpeak in individuals with mild MS (13). These data support the notion that the OUES can be considered as an alternative method for expressing CRF in people with MS that reflects other commonly reported CRF variables. This has important implications for prescribing adequate exercise training interventions and evaluating the effectiveness of such interventions over time (33).
Indeed, individuals with MS struggle to attain maximal or peak exertion during CPET, and submaximal expressions of CRF may be used alternatively. We evaluated the validity of the OUES50 and OUES75 using a subsample of 21 participants with MS. Strong correlations were observed between the OUES and the OUES50 and OUES75. This is important because it indicates that the OUES50 and OUES75 could be used as indicators of CRF without achieving peak exertion. In addition, Bland-Altman plots demonstrated good agreement between the OUES and the OUES50 and OUES75 with a mean difference of 176.6 (SD 272.3) and 90.18 (SD 157.2), respectively. We further determined that the coefficient of variation (CV) for the OUES, OUES50, and OUES75 were 29.5%, 24.2% and 26.3%, respectively. This supports the use of submaximal OUES for individuals who may struggle to attain peak exercise effort, such as persons with MS, without the loss of test precision with less exercise data.
In addition to the OUES, other alternative submaximal expressions of CRF have been proposed, and the limitations of these approaches have been highlighted (13, 34–36). One alternative method is the ventilatory threshold (VT). Unfortunately, VT can be difficult to obtain in patients with physiological deconditioning (37), a prevalent symptom in persons with MS (9). Furthermore, VT is highly dependent on the exercise protocol and is subject to inter- and intra-observer variability (35). Another method for expressing CRF is the slope derived from VE/VCO2. However, the efficacy of a VE/VCO2 slope is diminished when submaximal exercise data is used (38). Another submaximal expression of CRF is the VO2/WR slope. While there is potential for the application of VO2/WR slope in clinical populations (39), including MS (21), it has been reported that VO2/WR slope strongly reflects O2 delivery in the periphery and is highly dependent on muscle fibre composition (40).
This cross-sectional investigation has several strengths, including the large sample size and disability range of participants with mild-to-severe MS. Another important strength of this study is the use of a recumbent stepper for completing the CPET. A recumbent stepper is an exercise test modality that is physically accessible for people with MS and can therefore be used with those with severe mobility impairment (7). It can further allow for the attainment of higher peak CPET values compared with other modalities (e.g. arm ergometer), proving a more accurate representation of CRF (7). A further strength of this study is the inclusion of a matched, non-MS control sample that completed the same CPET protocol, which allows for a direct comparison with persons with MS with similar demographic characteristics using the same testing modality.
One potential limitation of this study is that the results are generalizable only to patients with MS who are primarily female with a relapsing-remitting disease course. Another possible limitation is that participants had little to no experience with CPET. If an individual is unfamiliar with CPET or the specific testing modality then they may not be accustomed to exerting themselves maximally or could have a lower efficiency of movement. In addition, we used a single exercise modality (i.e. recumbent stepper) and protocol for the CPET, limiting direct comparisons with other research. A further potential limitation is the approximately equal distribution of MS disability groups, which might not be representative of the MS population. In addition, we did not control for medication or smoking, which could alter CPET and OUES variables.
This study determined that the OUES is flatter (i.e. lower) in persons with MS compared with non-MS controls and decreases as a function of increasing disability using a recumbent stepper. These findings are not surprising and are probably related to inactivity-induced deconditioning and the pathophysiology of MS, which impacts the cardiovascular, respiratory, and musculoskeletal systems, all of which contribute to the OUES. The OUES was significantly associated with other CPET variables, including VO2peak and WRpeak, and strong correlations were observed between the OUES and the OUES50 and OUES75. In addition, good agreement between the OUES and the OUES50 and OUES75 were observed. Since the OUES can be determined from submaximal exercise, it represents a promising alternative as an expression of CRF across the disability spectrum in MS. This has important implications for the evaluation and monitoring of CRF in persons with MS.
This study was supported, in part, by the National Multiple Sclerosis Society [IL 0003].
The authors declare no conflicts of interest.


 Click to show fullsize
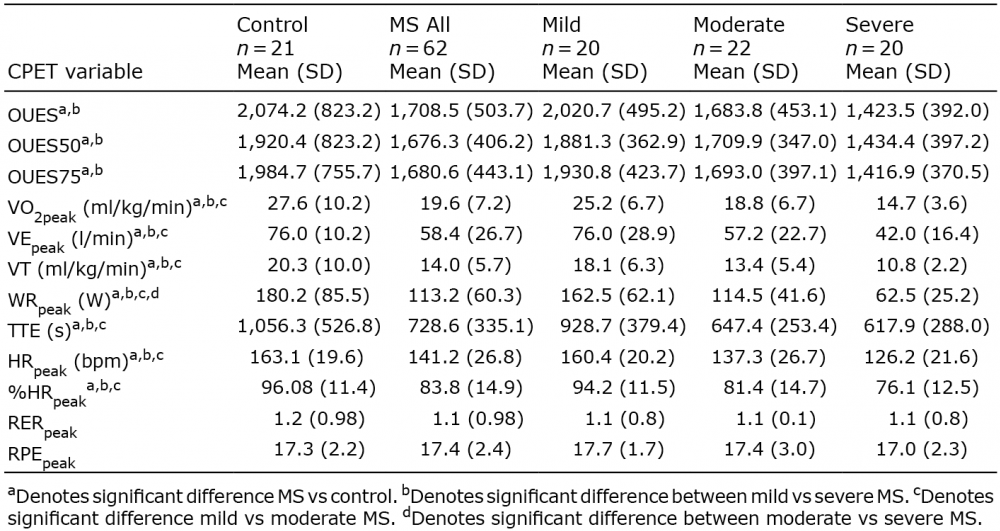 Click to show fullsize
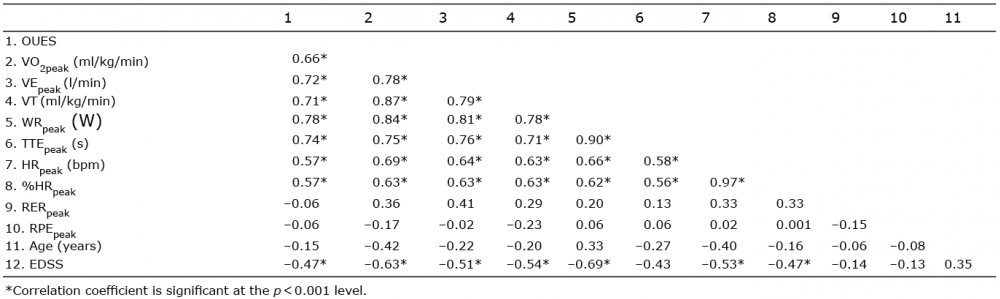 Click to show fullsize
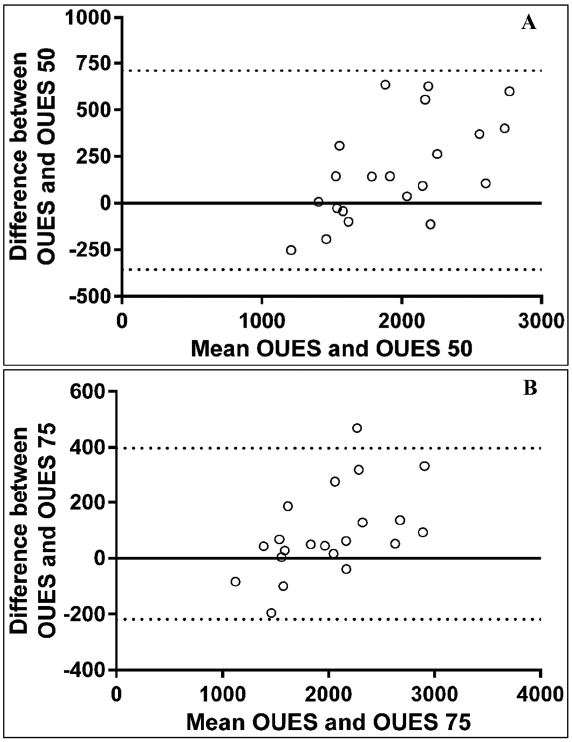 Click to show fullsize