
From the Inserm Unit 1179, Team 3: Technologies and Innovative Therapies Applied to Neuromuscular Diseases, UVSQ, CIC 805, Physiology–Functional Testing Ward, AP-HP, Raymond Poincaré Teaching Hospital, Garches, France
Objective: To assess temporal congruence (the difference in performance-time and time to imagine) between the sub-tasks of the Expanded Timed Up and Go (ETUG) and imagined ETUG (iETUG) tests in patients with hemiparesis following unilateral hemispheric stroke, and to compare the results with those for with healthy subjects.
Design: Case-controlled study.
Subject/patients: Twenty patients with chronic stroke and 20 healthy subjects.
Methods: TUG, ETUG and iETUG test performance times were recorded for all participants. Temporal congruence was calculated with the following formula: (ETUG-iETUG)/[(ETUG+iETUG)/2]*100.
Results: Patients’ performances were slower than those of healthy subjects for all 5 sub-tasks of the TUG, ETUG and iETUG tests. However, there was no significant difference in temporal congruence between healthy subjects and patients. Intragroup analysis showed significant differences between the executed and the imagined conditions for both groups for the “walking”, “turn around” and “sitting” phases (healthy subjects p = 0.01, p = 0.03, p = 0.03, and patients p = 0.01, p = 0.003, p = 0.003, respectively).
Conclusion: Temporal congruence was similar for healthy subjects and patients for all sub-tasks of the ETUG test. Moreover, temporal congruence was reduced for the same sub-tasks of the ETUG test in patients and healthy subjects. This suggests that the motor imagery involved the same cerebral structures in both groups, probably including the cerebellum, since it was intact in all patients.
Key words: stroke; motor imagery; performance time; expanded Timed Up and Go test; temporal congruence.
Accepted Dec 1, 2017; Epub ahead of print Feb 28, 2018
J Rehabil Med 2018; 50: 00–00
Correspondence address: Maxime Geiger, Inserm Unit 1179, Team 3: Technologies and Innovative Therapies Applied to Neuromuscular diseases, UVSQ, CIC 805, Physiology–Functional Testing Ward, AP-HP, Raymond Poincaré Teaching Hospital, Garches, France. E-mail: maxi
Motor imagery (MI) is a cognitive state corresponding to imitating or anticipating the effects or memory of an action (1). MI has been studied in healthy people, elderly people and patients with neurological disorders (2–8). MI is often used as part of stroke rehabilitation programmes (9), although relatively little is known about its mode of action.
The most common methods to explore MI, especially in patients with stroke, is by comparing the time taken to perform a given task with the time taken to imagine performing the same task (5, 6, 10, 11).
To date, studies in patients with stroke have focused more on the assessment of MI for voluntary and unilateral tasks showing alterations in performance (3, 5, 6, 10). One study assessed gait-related activities and found that the MI equivalence between imagined and real locomotion was greater during dynamic MI than during static MI (12). The Timed Up and Go (TUG) test (13) has been validated for use in patients with stroke (14). Comparison of the performance time of the TUG test and the imagined Timed Up and Go (iTUG) test provides a measure of MI capacity called temporal congruence (TC) (2). TC between the TUG and the iTUG tests has been evaluated in patients with chronic stroke, as well as those with multiple sclerosis, and elderly people (2, 11, 15). In all 3 groups, the TC was found to be altered compared with healthy subjects (2, 11, 15).
The Expanded TUG (ETUG) test involves recording the performance time of the individual sub-tasks of the TUG test (16). It has been found to be more detailed and reliable than the TUG test in older subjects with impaired mobility (16). The main advantage of the ETUG test is that its segmented approach permits detailed assessment of each sub-task of the TUG test, improving understanding of the patient’s impairments.
The ETUG test has been validated in patients with stroke (17), but its imagined version, the iETUG test, has never been evaluated. This aim of this pilot study was therefore to assess TC between the sub-tasks of the ETUG and the iETUG tests in patients with stroke-related hemiparesis and to compare it with that of control subjects. It is important to study the different sub-tasks of the TUG test to explore specific difficulties in MI that could be masked by the global score obtained from the iTUG test.
Our hypotheses were that: (i) the TC of the ETUG and iTUG tests would be weaker in patients with stroke than in the control group; (ii) the performance time of the TUG, ETUG and iETUG tests would be significantly longer in the group with stroke than in the control group (since iTUG test performance time is slower in patients with central nervous system lesions); and (iii) there would be no significant differences between the performance times of the ETUG and iETUG tests in the control group.
A total of 20 patients with chronic stroke-related hemiparesis were included in this study. Their characteristics are reported in Table I. Each patient was regularly followed in the Department of Rehabilitation Medicine of the Raymond Poincare Teaching Hospital, Garches. Inclusion criteria were: (i) patients over 18 years of age; (ii) hemiparesis due to a single unilateral stroke more than 6 months previously; and (iii) able to perform the TUG test (walking aids were permitted). Patients were excluded if they had one or more of the following conditions: (i) bilateral cortical lesions; (ii) cerebellar syndrome; (iii) severe comprehension deficit; (iv) motor apraxia; (v) musculoskeletal surgery within 6 months of inclusion; and (vii) severe aphasia.
The control group was composed of 20 age-matched healthy volunteers, i.e. without antecedents of neurological or orthopaedic pathology, who were recruited from the hospital staff. All subjects gave their written consent before participation. The study was performed in accordance with the ethical codes of the World Medical Association (Declaration of Helsinki) and was approved by the local ethics committee.
A sample size of 20 patients with stroke and 20 healthy subjects was determined based on the results of Beauchet et al. (2). The mean TC scores of the healthy (29.7% (standard deviation (SD) 20.3%)) and older adults (78.1% (SD 42.6)) from that study were used to calculate the sample size for the present study. We assumed that the patients with stroke would not perform better than the older subjects, so we used their values. The effect size calculated was 1.45, meaning that for a statistical power of 0.9, 20 subjects were required in each group.
All subjects were asked to perform 2 TUG tests (consecutively) and 2 ETUG tests (consecutively) followed by 2 iETUG tests (consecutively), as in the study design of Botolfsen et al. (16), Ayan et al. (18) and Faria et al. (19). There was a 30 s pause between each test. This method was used: (i) to determine the level of functional independence of patients (TUG test performance); (ii) to facilitate comparison with similar studies (2, 6, 11); (iii) because we believed it to be the simplest method to aid understanding of the potentially complex ETUG test instructions (detailed in the methods); and (iv) beginning with the actual movement ensured that patients correctly understood each iETUG test sub-task that they would have to imagine; nevertheless the possible implications of this choice are discussed later in this paper.
Subjects were also asked to complete a Movement Imagery Questionnaire. The patients with stroke performed the Movement Imagery Questionnaire – Revised Second Version (20) and the control group completed the Movement Imagery Questionnaire – Revised (21).
The French version of the Movement Imagery Questionnaire – Revised Second Version was used (22); it consists of 14 questions about MI for different types of movement, 7 related to kinesthetic imagery and 7 to visual imagery. Subjects were asked to rate the difficulty or ease with which they could use MI to imagine each movement on a scale from 1 to 7 (1 = very difficult, 7 = very easy). The maximum score was 98 (22).
The Movement Imagery Questionnaire – Revised was used for the control subjects (21). It is composed of 8 questions rated from 1 to 7 with a maximum score of 56. Because 1 movement imagery questionnaire test had been validated for patients with stroke and the other for control subjects, the results were expressed as a percentage of the maximum score for that test, to allow between-group comparison.
TC was calculated with the following formula (2):
(TUG–iTUG)/[(TUG+iTUG)/2]*100.
A TC percentage score of zero (0%) indicates that MI and actual performance time are identical. The further the TC score is from 0% (positively or negatively), the greater the incongruence. A negative sign indicates that iTUG test performance time is longer than TUG test performance time and a positive sign indicates the opposite. TC between the TUG and iTUG tests has been shown to be altered in people with cognitive impairment, such as older patients and those with multiple sclerosis (2, 11), as well as in patients with chronic stroke (15).
The procedure for the TUG test was based on the method used by Podsiadlo & Richardson (13). Subjects had to stand up from a chair, walk 3 m, turn around, and walk 3 m back to the chair and sit down, at their spontaneous gait speed. The time was recorded using a manual stopwatch and was triggered when the subject’s back left the backrest of the chair and stopped when the subject’s back touched the backrest on return to sitting. The test began with the instruction: “ready-go”.
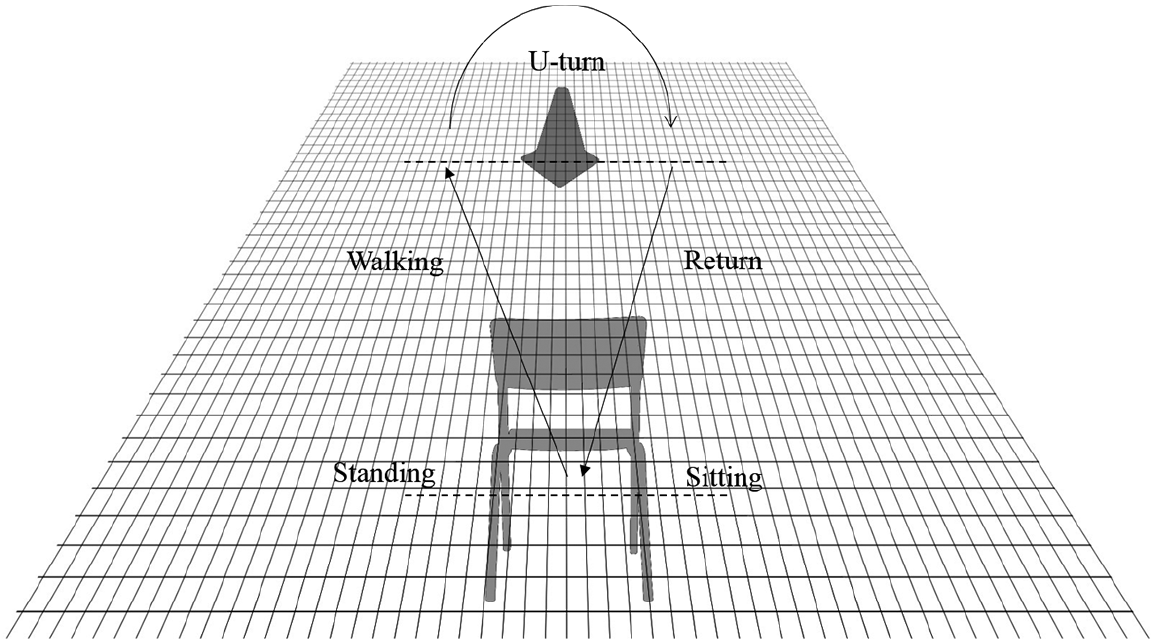
The procedure for the ETUG test was based on the method used by Faria et al. (17). Subjects were seated on a chair in front of a cone placed on a tiled floor and had to perform each one of the 5 sub-tasks of the TUG from an immobile position. Each sub-task was timed. The start signal was the following statement: “ready-go”, and was given before each task. The stopwatch was started on the word “go” and stopped at a pre-determined position for each sub-task. Subjects had to stop at the end of each sub-phase and to remain stationary before beginning the following sub-phase. The phase was considered as complete when the patient put his/her foot on the tile corresponding to the end of phase (see Fig. 1). The 5 different sub-tasks of the ETUG were defined (according to Faria et al. (17)) as:
1. Standing: Stand up and remain motionless.
2. Walking: Walk forwards 3 m until the first foot is level with the cone.
3. Turnaround: 180° turn around the cone until the first foot is level with the opposite side of the cone.
4. Return: Walk 3 m to face the chair again.
5. Sitting: Turn around and sit down (motionless) on the chair.
These descriptions were given to the subject before the ETUG test so that he/she knew exactly what to do and where to stop.
Fig. 1. The set-up for the Expanded Timed Up and Go test (ETUG).
The procedure for the sequence and number of the iETUG tests was the same as for the ETUG tests (described above), except that the subjects remained seated in the same chair, facing the same track on the floor as before, and had to imagine the actions. They received no instructions regarding whether to: (i) open or close their eyes; or (ii) use visual imagery or kinesthetic imagery to imagine their movements. The following instructions were given for each sub-task:
1. Standing: “Imagine yourself getting up. Say ‘Stop’ when you are standing upright and motionless.”
2. Walking: “Stay standing and imagine yourself walking to the cone on the floor. Tell me ‘Stop’ before you begin to turn around.”
3. Turnaround: “Imagine yourself turning around the cone and tell me ‘Stop’ before you start to walk back to the chair.”
4. Return: “Imagine yourself walking back to the chair. Tell me ‘Stop’ before you start to turn around to sit down again.”
5. Sitting: “Imagine yourself sitting down. Tell me ‘Stop’ when you are sitting still on the chair again.”
The subject had to begin to imagine when the experimenter said, “ready-go.” The stopwatch was started on the word “go” and stopped when the subject said “stop”, as instructed.
The performance times of each sub-task of both trials of the TUG, ETUG and iETUG tests were averaged for each subject and the mean and standard deviation were calculated for each group. TC between the ETUG and iETUG tests was also calculated for each subject using the formula
(ETUG–iETUG)/[(ETUG+iETUG)/2]*100 (2).
From the movement imagery questionnaire data, we were able to distinguish between kinesthetic imagery, visual imagery as well as global MI (kinesthetic+visual) and each subject’s score was expressed as a percentage of the maximum possible score.
Normal distribution and homogeneity of the data were tested using the Shapiro–Wilk test. The data were not normally distributed and so the non-parametric Mann–Whitney U test was used to compare the 2 groups’ results for age, movement imagery questionnaire score, performance time on the TUG test and the 5 sub-tasks of the ETUG and iETUG tests, and the TC values for each of the sub-tasks. The level of significance was set at p < 0.01 after a Bonferroni correction. The initial level of significance p < 0.05 was divided by 5 because 5 comparisons were involved (5 sub-tasks: Standing; Walking; Turnaround; Return; Sitting). A χ2 test was used for the sex comparison between the 2 groups, the level of significance was set at p < 0.05. A sign test was used to carry out intragroup comparisons between the real and the MI performances, and the level of significance was set at p < 0.01 after the Bonferroni correction.
To explore possible interactions between motor skills and MI, we used Spearman’s correlations and compared the mean TUG time (reflecting the level of functional independence) (23) with TC, the level of significance was set at p < 0.01 after the Bonferroni correction. All the statistical analyses were carried out using Statistica® version 7.1 software.
The characteristics of the patients with stroke and the healthy controls are shown in Table I.
Table I. Characteristics of the subjects (n = 20) who participated in the study
There were no significant differences between the 2 groups for age (stroke group: mean 51.6 (SD 13.56) years, control group: 49.7 (SD 11.7) years; p = 0.54), sex (χ2 test p = 0.1), kinesthetic imagery (stroke group: 79.95% (SD 15.46), control group: 81.42% (SD 18.7); p = 0.86), visual imagery (stroke group: 80.55% (SD 12.79), control group: 89.04% (SD 11.80) p = 0.056) or total MI (stroke group: 80.25% (SD 13.81), control group: 85.23% (SD 11.48); p = 0.75), indicating that the groups were sex- and age-matched, and had similar MI abilities.
The results indicated that the patients with stroke performed the TUG test, each sub-task of the ETUG test and the iETUG test significantly more slowly than did the controls (Table II) (p < 0.001).
Table II. Intergroup comparison of the mean times taken by the 2 groups to complete the Timed Up and Go (TUG) test and the 5 sub-tasks of the Expanded Timed Up and Go (ETUG) and imagined ETUG (iETUG) tests
There were no differences in TC between the control and patient groups; respectively Standing phase (%): mean 8.44 (SD 27.95) vs –1.28 (SD 37.56), p = 0.38; Walking (%): 21.76 (SD 23.7) vs 22.18 (SD 27.95), p = 0.90; Turnaround (%): 22.74 (SD 27.62) vs 28.87 (SD 30.29), p = 0.49; Return (%): 10.39 (SD 21.24) vs 13.20 (SD 38.47), p = 0.94; and Sitting (%): 32.36 (SD 24.76) vs 45.99 (SD 40.87), p = 0.30. The statistical power analysis performed retrospectively (since this was a pilot study) revealed that power was below the 0.8 threshold. We thus decided to focus the discussion of our results on the the raw data for which the statistical power was higher (see below).
Differences in raw time (in s) across the 5 sub-tasks were similar in the 2 groups. The analysis revealed that while TC was low for the “Walking”, “Turnaround” and “Sitting” sub-tasks in both the stroke and control groups (respectively: p = 0.01, p = 0.003, p = 0.003 in the stroke group and p = 0.001, p = 0.03, p = 0.03 in the control group), it was high for “Standing” and “Return” (respectively p = 0.99, p = 0.5 in the stroke group and p = 0.26, p = 0.11 in the control group). Retrospective analysis of the statistical power of these comparisons showed a range of 0.23–0.99 in the control group, with the lowest power for the standing phase. In the stroke group, the power ranged from 0.07 to 0.96, with the lowest power for the standing and return phases.
The results of the correlation between mean TUG time and TC are shown in Table III. Mean TUG time was not correlated with TC for any of the 5 sub-tasks.
Table III. Intragroup correlations between mean Timed Up and Go (TUG) and temporal congruence in patients with stroke
The results of this study showed that the time taken to complete the TUG and the ETUG tests by patients with stroke was significantly longer than the time taken by the control group, as hypothesized. This is in accordance with a previous study (17). In addition, the patients with stroke performed the sub-tasks of the iETUG test more slowly than the control subjects, as was previously found for the iTUG test in the same patients (15). However, in contrast with our hypotheses, TC between the ETUG and iETUG tests was similar in patients and healthy subjects. Nevertheless the TC was not consistent across the 5 tasks: TC was low for the “Walking”, “Turnaround” and “Sitting” sub-tasks in both groups. The fact that the TC and raw data of both patients and control subjects was similarly modified suggests that MI of the ETUG test is not impaired in patients with stroke.
The patients performed each sub-task of the iETUG and ETUG tests significantly more slowly than the control subjects, suggesting that the patients with stroke consciously adapted their iETUG test performances to match their ETUG test in order to maintain the same level of TC as the control subjects, but at a slower pace.
It was also interesting to note that the same patterns of TC were seen in both groups across the 5 sub-tasks. Bonnyaud et al. (24) assessed each subtask of the TUG test using a biomechanical approach and did not find any differences between a similar sample of patients and control subjects for the “Return” sub-task trajectory in the TUG test, suggesting that this task is simple for both patients with stroke and controls. Although they did not study the “Standing” or the “Sitting” sub-tasks of the TUG test specifically, we speculate that as the “Sitting” sub-task involves a turn, it might be more complex than the “Standing” sub-task that does not. These results thus show that TC is less good for the more complex tasks and is better for the easier sub-tasks of the TUG test, so that both control subjects and patients imagined the more complex tasks faster than they really carried them out.
It is not possible from the present study to determine which structures are involved in MI for gait-related activities. However, other studies have reported greater activity in the cerebellum and basal ganglia than cortical areas during MI of a complex sports task in healthy subjects (25). The cerebellum is involved in movement error-correction (25), and the basal ganglia are involved in motor learning processes and function as a relay with cerebellar pathways (26, 27), as well as being involved in the optimization of complex motor sequences. Basal ganglia lesions (putamen) have been found to adversely affect MI ability (28). Thus, it seems reasonable to suppose that these sub-cortical structures could be particularly responsible for the TC found in the present study. Moreover, qualitative analysis of our results showed that 7 patients had complete lesions of the middle cerebral artery territory, yet their results were similar to those who did not have complete lesions of this zone. This suggests the basal ganglia are not, or only slightly, involved in MI of the different subtasks of the TUG test. The results of the present study also suggest that other structures involved in the MI of iETUG test were intact. Neural plasticity following a sub-cortical stroke has previously been shown to favour reorganization of the connections between cortical and sub-cortical structures and so ensure sustainability of the motor system (29, 30). In addition, the gait-related task assessed in the present study was composed of voluntary and semi-automatic movements, which are known to be partly controlled at the sub-cortical level (31–34). Moreover, we recently found a significant difference in TC of the TUG test between patients with chronic stroke and healthy subjects (15). This means that TC is altered in patients for the continuously imagined TUG test, but not for the sequenced ETUG test, probably because of stroke-related attention deficits. Thus, attention or executive processes may be less engaged during the ETUG test or, as advanced previously, the MI mostly involved subcortical processes. Also, the duration of the task to be imagined is shorter for the iETUG than the iTUG test, perhaps reducing the complexity of the MI. Guillot & Collet. (35) found a relationship between the complexity of a task and the duration of the corresponding MI. This is also in accordance with the hypothesis that MI is influenced by attention deficits, since a longer task leads to a greater attentional demand.
We propose 2 hypotheses to explain the difference in TC and thus raw data between the sub-tasks of the ETUG and iETUG tests. (i) A single supra-spinal area, which was not affected by the lesions of the patients with stroke in this study, may be involved in MI. This area adapts to the patient’s motor impairments and is particularly accurate for simple tasks, but not for more complex tasks. (ii) Two areas are involved in MI, 1 that processes simple tasks and can adapt to lesions of motor areas, and was not damaged in the patients included, and another that was also intact, but was unable to ensure strong TC in both healthy subjects and patients with stroke. Both these hypotheses would explain why the TC (calculated using raw data) for each sub-task was similar between the patients and healthy subjects. Further studies using functional magnetic resonance imagery (fMRI) are needed to test these hypotheses by elucidating the brain structures involved in MI.
This study has several limitations: the first is that the use of kinesthetic or visual imagery was not imposed, neither was the visual imagery perspective (internal or external imagery). Since these types of MI are supported by different neuronal circuits (36), this may have affected the results. However, we made this choice to allow comparison with previous work in this area, as well as to simplify the task for the study participants; it was also for these reasons that the executed (ETUG test) action was always carried out before the imagined action (iETUG test). Another limitation is that the sample was small. However, it was the same sample as another study in our group that evaluated the iTUG test in patients with stroke (15) and the size was based on the results of Beauchet et al. (2) in older adults as well as a study of patients with multiple sclerosis (11). The discussion was mainly based on the results obtained from the comparison of the raw data between real time and imagined time in both groups, for which statistical power was higher than with TC expressed as a percentage. The effect size and statistical power for the study clearly indicate that the TC formula is not adapted to small sample size; however, the use of the raw time result seems to be more relevant, with higher power in the patient group. We thus suggest that future studies adapt sample-size calculations to the nature of the comparisons. Thus, this study presents statistical power limits, but it is a pilot study as well, it give us more knowledge on the use of MI and TC of the Timed Up and Go in patients with stroke.
In conclusion, further work using an imagined expanded task paradigm will be necessary to clarify the mechanisms underlying the lack of TC in healthy subjects for specific tasks. The fact that the control subjects and patients with stroke exhibited the same patterns of temporal accuracy is interesting, since it provides the first evidence that the mental imagery of some gait-related activities could be preserved in patients with chronic hemiparetic stroke.
This pilot study evaluated a single session of MI. A future longitudinal study involving several sessions of MI training could evaluate whether the lack of TC for the “Walking”, “Turnaround” and “Sitting” sub-tasks of the ETUG test improves with practice and whether this is correlated with improvements in clinical performance. MI has already been shown to enhance the effects of rehabilitation (9), and the present study suggests the location of the lesion may influence the effects, depending on the MI task (15). Further studies are required, involving larger cohorts to improve statistical power and to confirm these results, to evaluate the effects of MI during rehabilitation in patients with no subcortical lesions.
The authors would like to thank “Fondation Garches” and Allergan for supporting this article, the patients and healthy subjects who participated in the study, Kristi Alcouffe, Johanna Robertson and Jennifer Dandrea for English correction and constructive criticism.
The authors have no conflicts of interest to declare.


 Click to show fullsize
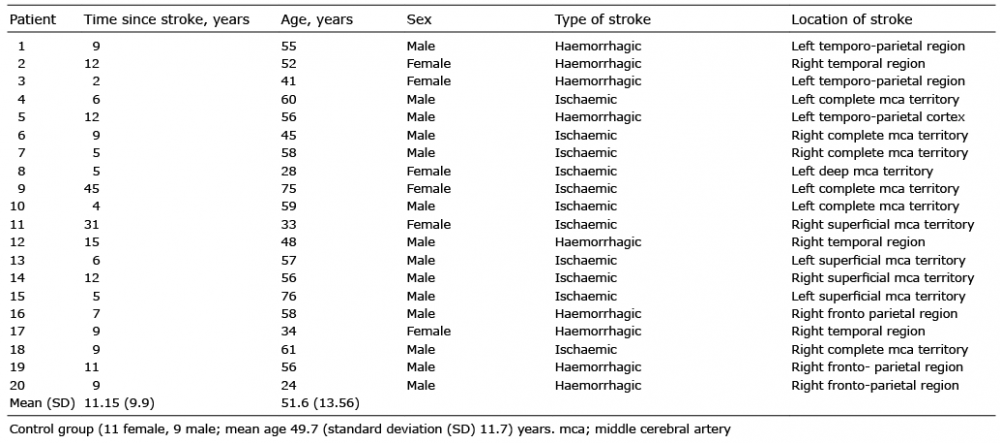 Click to show fullsize
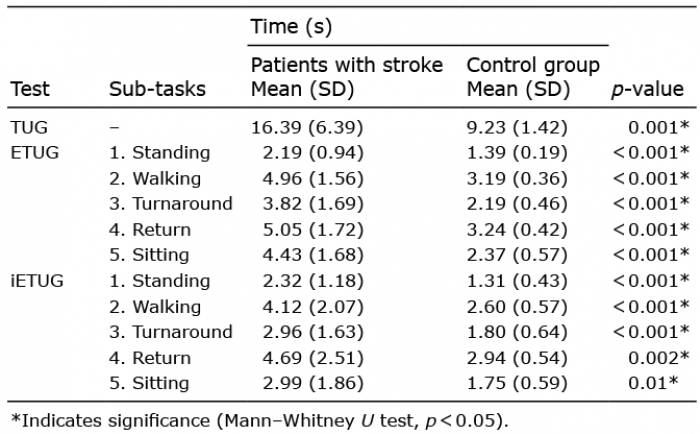 Click to show fullsize
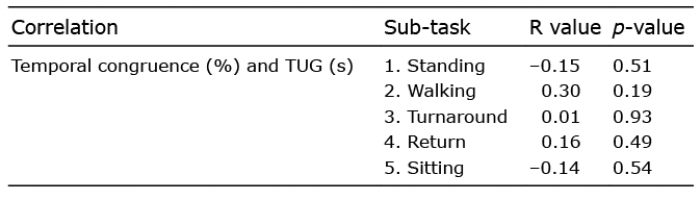 Click to show fullsize