
From the 1Department of Physical and Rehabilitation Medicine, Laboratory of Clinical Neuroscience, Faculty of Medicine and Pharmacy, Mohammed Ben Abdallah University, Fez, 2Laboratory of Epidemiology, Clinical Research and Public Health, Faculty of Medicine and Pharmacy of Oujda, Mohammed First University, Oujda, 3Disability Department, Ministry of Family, Solidarity, Equality and Social Development, Rabat and 4Laboratory of Epidemiology, Clinical Research and Public Health, Faculty of Medicine and Pharmacy, Mohammed Ben Abdallah University, Fez, Morocco
Objective: Disability is considered a global health problem, with an increasing number of persons with disabilities. Up-to-date and good-quality data on disability are essential to policymakers in order to establish tailored programmes for persons with disabilities based on the specific needs of each category. The aims of this study were to determine the prevalence of disability in the adult Moroccan population, and its distribution according to socio-demographic characteristics and geographical regions.
Methods: A national survey was conducted in 2014, including a sample of 47,275 adult participants drawn from 16,044 households from urban and rural areas proportioned to population size. The sample’s socio-demographic characteristics were collected in face-to-face interviews. The data were then screened for disability using the Washington Group Short Set of Questions on Disability.
Results: Overall prevalence of disability among the Moroccan adult population was 9.5%, with important geographical disparities. Older age, lower education rates, unemployment, being single, and living in rural areas, were associated with higher prevalence rates of disability. Visual and motor deficiencies were the most common disability modalities, and the prevalence of moderate-to-extreme disability, which is associated with more significant limitations in functioning, was 2.6%.
Discussion/Conclusion: Results from this national Survey are critical and would guide national disability policies and programmes, in order to reduce disabling barriers and improve persons with disabilities access to healthcare and participation.
Key words: disabled persons; cross-sectional studies; Morocco; disability prevalence; low-and middle-income country; Washington Group.
Accepted Sep 18, 2019; Epub Sep 30, 2019
J Rehabil Med 2019; 51: 00–00
Correspondence address: Abderrazak Hajjioui, Faculty of Medicine and Pharmacy, Mohammed Ben Abdallah University, Route Immouzer, BP 2626, Fez, 30.000 Morocco. E-mail: hajjiouiabdo@yahoo.fr
The aim of this study was to determine the prevalence of disability in the adult Moroccan population, and its distribution according to socio-demographic characteristics and geographical regions. A national survey was conducted in 2014, including a sample of 47,275 adult participants drawn from 16,044 households from urban and rural areas proportioned to population size. The sample’s socio-demographic characteristics were collected in face-to-face interviews. The data were then screened for disability using the Washington Group Short Set of Questions on Disability. The overall prevalence of disability among the Moroccan adult population was 9.5%, with important geographical disparities. Older age, lower education rates, unemployment, being single, and living in rural areas, were associated with higher prevalence rates of disability. Visual and motor deficiencies were the most common disability modalities, and the prevalence of moderate to extreme disability, which is associated with more significant limitations in functioning, was 2.6%.
According to the World Health Organization (WHO), more than 1 billion people worldwide are living with some form of disability, representing 15% of the world population, with a 5% increase since the previous WHO estimation in the 1970s (1). Hence, disability can be considered a global health problem, with an increasing number of persons with disabilities (PWD). This can be explained by the ageing of populations and by the increase in chronic diseases, which can lead to disability, such as diabetes, cardiovascular conditions and mental illnesses (1).
In Morocco, epidemiological data on disability are rare and mostly limited to the results of the first national disability survey, conducted in 2004 by the Secretary of State for “Social Protection, Family and Children” (SSSPFC), which revealed that 1.53 million people were living with disabilities, representing 5.12% of the Moroccan population (2).
Since 2004, Morocco has seen a number of significant changes that have influenced the issue of disability, such as the ratification of the international Convention on the Rights of Persons with Disabilities (CRPD) in April 2009 (3), and the adoption of a new constitution in 2011, which recognizes the rights of PWD and prompts public authorities to implement policies and programmes specifically designed to make life easier for PWD. However, up-to-date and good-quality data on disability are essential to policymakers in order to establish tailored programmes for PWD based on the specific needs of each category (4).
Moreover, as a developing country, and due to its demographic transition, with more elderly people, Morocco has also been facing an epidemiological transition, with a substantial increase in non-communicable diseases (5), which has a major effect on the prevalence of disability (6).
According to the Global Burden of Disease, chronic health conditions are held accountable for approximately 66.5% of years lived with disability in low- and middle-income countries (7). A recent survey by the Moroccan Ministry of Health showed that 18.2% of the Moroccan population had at least one chronic disease. This rate rises to 57.5% among subjects aged 60 years and more (8), suggesting a potentially higher prevalence of disability than was found in the 2004 Disability Survey.
The aim of this present national survey, conducted in 2014, was to establish a new and updated database on disability in Morocco, in order to measure the prevalence of disability among the Moroccan population, and to determine its characteristics and domains. We present here the results related to the prevalence of disability among the adult Moroccan population, and its variability according to socio-demographic characteristics and geographical distribution.
Study design and sampling
The prevalence of disability in Morocco was estimated through a population-based, cross-sectional survey, based on a 2-stage stratified random sample design. The target population included members of Moroccan households spread across the country (urban and rural areas) in each of the16 administrative regions of Morocco.
The sampling was realized according to the database from the latest national census, conducted in 2004, which was adjusted to fit with the administrative division of 2009. The country was stratified into 16 regions (according to the Moroccan administrative division). Each region was then stratified into urban and rural areas. In the urban area, all possible types of housing were considered (luxury, modern, ancient, affordable and social, precarious and clandestine), whereas in the rural area, provinces were stratified according to their specificity (plain, mountain, plateau, and Saharan).
A first-stage sampling consisted in randomly drawing a sample of districts from the national census in each considered stratum. This draw was carried out with a probability proportional to the number of households within each stratum. Then, the second-stage sampling consisted in an equal probability random draw of 20 households within each previously selected district.
According to the previous national study conducted in 2004, which found a prevalence of disability of 5.2% (9), and taking into account the regional and living areas (urban/rural) specificities, the target sample size was determined at 16,044 households, with a 95% confidence interval (95% CI), 2% margin of error, and 10% expected non-response.
The study was carried out as part of a governmental population census in agreement with Moroccan law and the principles of the Declaration of Helsinki on protecting human subjects. All patients included in this study were informed of the study aims and characteristics and gave their informed consent to participate. The ethics committee of the Faculty of Medicine and University Hospital of Fez approved the analysis and use of the census database.
Procedure
A total of 80 qualified investigators were recruited and mobilized to conduct the field-survey, which lasted 10 weeks between May and July 2014. Prior to the survey, all survey team staff were trained in the survey objectives, interview procedures and data collecting tools (digital tablets), with real situation simulations. The survey teams were assigned to cover administrative regions where they belong, or in which they had worked before, so that they were aware of the local population cultural and language specificities.
On arriving at the household, the investigator first asked to talk to the head of the family (usually the father), in order to explain the survey objectives and to obtain consent to interview him and the rest of the household members. If the consent was not obtained, the household was replaced by another one with the same characteristics (same district, same housing type), which was usually the next-door neighbours.
All members of each household visited were included in the survey, and interviewed using 2 questionnaires. A socio-demographic questionnaire was used to collect information about each person’s age, sex, marital state, level of education, and occupation. All household members were then screened for disability using the Washington Group (WG) Short Set of Questions on Disability, but we only report the results of the adult population over 18 years of age. These questions were developed to identify the majority of the population with functioning difficulties in basic activities, which might limit independent living or social integration if appropriate accommodation is not made. The WG Short Set of Questions on Disability was developed according to the Fundamental Principles of Official Statistics to be used in Censuses and Surveys (10). It is consistent with the International Classification of Functioning, Disability and Health (ICF), and has been shown to produce internationally comparable data (11). The Short Set of WG contains 6 questions, covering 6 core functional domains, administered as follows:
“The next questions ask about difficulties you may have doing certain activities because of a health problem:
1 – Do you have difficulty seeing even if wearing glasses?
2 – Do you have difficulty hearing, even if using hearing aid?
3 – Do you have difficulty walking or climbing stairs?
4 – Do you have difficulty remembering or concentrating?
5 – Do you have difficulty with self-care (such as washing all over or dressing)?
6 – Using your usual (customary) language, do you have difficulty communicating (for example, understanding or being understood by others)?
Each question has 4 response categories: 1 – No, no difficulty; 2 – Yes, some difficulty; 3 – Yes, a lot of difficulty; and 4 – Cannot do at all.
For a more rigorous identification of PWD, the results were refined among the population who stated that they had some difficulty (2) or a lot of difficulty (3) in one or more of the 6 targeted disability domains, by submitting this population to complementary questions, as suggested by the WG Short Set of Questions on Disability. The aim of this approach was to remove any confusion or approximation related to the first statements. Total disabilities were not covered by additional questions.
The participants were then considered as facing disability in each specific domain, if their answers to the additional questions confirmed their difficulty. For example, a person who had stated they had some difficulty seeing, were asked 2 additional questions:
1 – Do you have difficulty clearly seeing someone’s face across a room?
2 – Do you have difficulty clearly seeing a small object at arm’s length?
The person was confirmed as having disability in seeing, only if he/she answered “Yes” to at least one of the complementary questions.
Subjects with confirmed disability were classified into 4 levels of severity, as follows:
Mild disability: if disability confirmed in at least one of the 6 domains of the WG Short Set of Questions on Disability, with a response category corresponding to no worse than (2 – Yes, some difficulty) in all domains.
Moderate disability: if disability confirmed in at least one of the 6 domains of the WG Short Set of Questions on Disability, with a response category corresponding to (3 – Yes, a lot of difficulty), in one domain.
Severe disability: if disability confirmed in at least one of the 6 domains of the WG Short Set of Questions on Disability, with a response category corresponding to (3 – Yes, a lot of difficulty), in 2 domains or more.
Extreme disability: if disability is confirmed in at least one of the 6 domains of the WG Short Set of Questions on Disability, with a response category corresponding to (4 – Cannot do at all), in one or more domains.
Statistical analysis
From the data obtained, a descriptive study was made in which the quantitative variables were expressed as mean with standard deviation (SD), and the qualitative variables as percentages. To study the associations between disability and the socio-demographic characteristics of the population, a manual descending binary logistic regression model was used. All factors associated with a p-value < 25% in bivariate analyses were included in the initial multivariate logistic model. Adjusted odds ratios (OR) and 95% CI were reported for each explaining variable.
Statistical analysis was carried out using SPSS v. 21.0. The level of significance was established for p-values < 0.05.
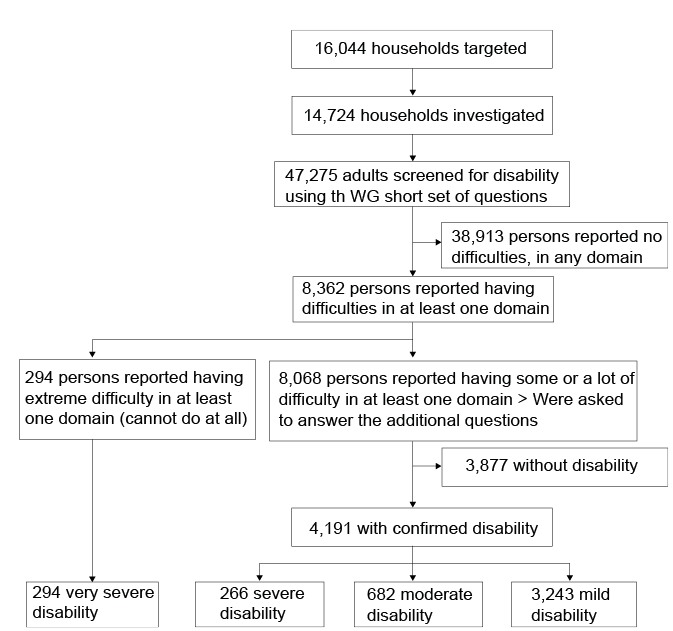
The survey investigated 14,725 households, representing a response rate of 97.4%. The population sample comprised 47,275 individuals aged 18 years and over (cf. Fig. 1).
Fig. 1. Flow chart of survey participants.
Population sample characteristics
Socio-demographic characteristics of the population sample are summarized in Table I. The mean age of the studied population was 39.96 years (SD 16.05), with a median of 38 years, and a maximum of 115 years. Regarding sex, men slightly predominated over women (50.9%). Of the studied population, 60.4% lived in an urban area. 59.9% were married, 32.8% single, and 5.2% widow/widower. Regarding occupation, only 38.1% were economically productive (full-time or part-time employed), whereas 15.3% were unemployed, 35.2% housewives, and 7.4% students. As for education, 43.2% were illiterate, and only 9.5% had gone to university.
Table I. Sample characteristics
Prevalence of disability
Table II presents the results regarding the prevalence of disability according to the type and number of concerned domains, and according to severity levels. The overall prevalence rate of disability in the investigated population was 9.5%, corresponding to 4,485 persons. Regarding the levels of disability severity, the prevalence was 6.9% for mild disability, 1.4% for moderate disability, 0.6 % for severe disability, and 0.6% for extreme disability.
As for the domains of disability, “vision difficulties” were the most common, with a prevalence of 6%, followed by “mobility difficulties” (4.8%), then “hearing difficulties” (1.9%), “personal care difficulties” (1.3%), then “memory and communication difficulties” with a prevalence of 1%.
The prevalence of persons experiencing disability in only 1 domain was 6.6%. The co-existence of disability in 2 domains achieved a prevalence of 2.1% and the co-existence of disability in 3 or more domains had a prevalence of 0.8%.
Table II. Prevalence of disability according to domains and degrees of disability
Prevalence of disability, according to socio-demographic characteristics and geographical distribution
As shown in Table III, bivariate analysis revealed a significantly higher prevalence of disability in persons of older age categories (p < 0.001), and in those living in a rural area (p < 0.001). It also showed a negative association between disability prevalence and education level (p < 0.001), with the highest prevalence (16.2%) observed in the illiterate population, and a negative association between the prevalence of disability and active occupation (< 0.001), within the lowest prevalence observed in the categories students, employed and housewives (1.6%, 5.7% and 9.5%, respectively), and the highest prevalence of disability rates found in the categories unemployed and retired (17.7% and 27%, respectively). Regarding marital status, a significant association was found between the prevalence of disability and marital status (p < 0.001), with the lowest prevalence rate observed within the single category (4.5%). However, there was no significant difference in prevalence of disability according to sex.
Table III. Prevalence of disability according to socio-demographic variables, univariate analysis
As shown in Table IV and Fig. 2, the prevalence of disability varied according to geographical region, with the lowest prevalence (< 5%) found in the region of Casablanca on the Atlantic coast, and the highest prevalence (> 15%) found in Tanger-Tétouan region, in the north-west. This geographical disparity was statistically significant (p < 0.001)
Table IV. Prevalence of disability according to geographical region
Fig. 2. Prevalence of disability in Morocco according to geographical region. 1: Oued Ed-Dahab-Lagouira; 2: Laâyoune-Boujdour-Sakia el Hamra; 3: Guelmim-Es Smara; 4: Souss-Massa-Drâa; 5: Gharb-Chrarda-Beni Hssen; 6: Chaouia-Ouardigha; 7: Marrakech-Tensift-Al Haouz; 8: Oriental; 9: Grand Casablanca; 10: Rabat-Salé-Zemmour-Zaër; 11: Doukkala-Abda; 12: Tadla-Azilal; 13: Meknès-Tafilalet; 14: Fès-Boulemane; 15: Taza-Al Hoceima-Taounate; 16: Tanger-Tétouan.
Multivariate analysis (Table V) confirmed the significant associations between prevalence of disability and older age, with (OR = 11.69, 95% CI 10.30–13.28, p < 0.001) in the population aged 60 years and above. The married population presented a significantly lower prevalence of disability (OR = 0.77, 95% CI = 0.68–0.88, p < 0.001) and widow/widower with significantly higher prevalence of disability (OR = 1.46, 95% CI = 1.24–1.71, p < 0.001) compared with the single population. As for education, prevalence of disability was significantly lower in the populations with higher educational levels. Compared with the professionally active population, the categories unemployed (OR = 3.29; 95% CI = 2.97–3.66; p < 0.001), housewives (OR = 1.13; 95% CI = 1.03–1.24; p = 0.006) and retired (OR = 1.81; 95% CI = 1.59–2.07; p < 0.001) were significantly associated with higher prevalence of disability.
Table V. Prevalence of disability according to socio-demographic variables and geographical distribution, multivariate analysis
As for occupation, in the younger group (age range 15–59 years), only the unemployed (OR = 3.59, 95% CI = 3.15–4.05, p < 0.001) and retired (OR = 3.58, 95% CI = 2.94–5.05, p < 0.001) were confirmed to be significantly associated with higher prevalence of disability compared with the employed population; whereas in the older group, housewives (OR = 1.40, 95% CI = 1.09–1.80, p = 0.008) were also experiencing a significantly higher prevalence of disability, along with the unemployed and retired, compared with the still economically active (employed) population.
With comparable socio-demographic variables, the prevalence of disability is still significantly higher is the north region (R16 = Tanger-Tétouan), than in the rest of the rest of the country.
This survey found that 9.5% of the adult Moroccan population, representing 2,166,285 persons (12), have different degrees of impairments and limitations in functioning. There was an 85% increase in overall prevalence of disability over a period of 10 years (2004–2014) (9), which could be explained, at least in part, by the use of the 2014 survey of a larger screening spectrum of disabilities, based on the WG Short Set of Questions on Disability. The latter is based on the “bio-psycho-social” ICF model, which transformed our understanding of disability from impairment-based to activity-limitation-based. One of the main strengths of the ICF model is that it improves the comparability of disability prevalence and data across different populations and contexts (13).
The overall prevalence of disability in Morocco (9.5%) is lower than the worldwide estimation of disability (15.6%) according to the world health survey conducted in 59 countries representing 64% of the world population in 2002–2004 (14). The lower prevalence of disability in lower income countries is usually explained by data collection for a narrow set of impairments, yielding lower estimates of disability (1). Hence, this lower prevalence rate of disability in Morocco, after the use of standardized disability screening tools, such as the WG Short Set of Questions on Disability, suggests different possible causes, such as a more limited life-span of people with disabilities in low- and middle-income countries, due to lack of access of PWD to appropriate medical care.
Compared with recent surveys in low- and middle-income countries, based on the WG Short Set of Questions on Disability, the prevalence of disability in Morocco is, on average, close to that of Tanzania (7.8%) (15) and Palestine (7%) (16). It was higher than in Jordan (2%) (17), Zimbabwe (2.9%) (18), Cambodia (4%) (19), Myanmar (4.6%) (20), South Africa (4.9%) (21) and Mozambique (5.8%) (22), and lower than in Bangladesh (9.07%) (23), Uganda (15.8%) (24) and Haiti (17.8%) (25).
The current study found a 2.6% prevalence rate of moderate-to-extreme disability, corresponding to 56,323 persons, when extrapolated to the Moroccan adult population, aged 18 years and above, and estimated at 22,803,000 persons in 2014 (12). This is comparable with the mean prevalence rate of significant difficulties, estimated at 2.2% in the world health survey (1).
Vision and mobility difficulties were the most common in our population, as reported in many countries (17, 26), highlighting the need for specific medical care, assistive devices and adaptation of the environment in order to improve these persons’ autonomy, participation and quality of life.
The prevalence of disability was significantly higher in the older population, reaching 33.2% in persons over 60 years of age, which is consistent with worldwide disability measures (1), as a result of the dramatic increase in health risks due to chronic illnesses and injury related to the ageing process (27). Women had a slightly higher prevalence of disability in Morocco, as was reported in the world health survey of 2004 (14). Women with disabilities are more at risk of low participation than men, since they are already faced with gender disadvantages (28); therefore women should be given more attention and adequate assistance. Regarding marital status, disability prevalence was significantly higher in single than in married persons, suggesting possible social isolation among some PWD that would limit their interpersonal relationships and social skills (29). Moreover, it has been documented that disability was considered as a disadvantage that would limit the chances of PWD, and especially women with disabilities, to get married in low-income countries (28, 30).
The prevalence of disability was inversely proportional to educational level, and significantly higher among unemployed persons, reflecting the lower accessibility of PWD to education, especially in its higher levels and to employment in Morocco, as was also documented in many other places worldwide, both higher-income and lower-income countries (1, 31). Even if accessibility to education and employment are fundamental rights of PWD (3), there are still many barriers that should be addressed in most countries to improve the participation levels of PWD, both in education and economic activities.
Regarding geographical disparities, the lowest prevalence rate of disability was observed in the region of Casablanca (R9), representing the most economically developed region of Morocco and the region with the highest coverage of medical care provision (12). As shown on the map (Fig. 2), the prevalence of disability increases as one moves away from the Atlantic coast (the more economically developed regions), towards the Eastern and Southern frontiers (characterized by lower economic productivity and lower coverage of medical care provision). Disability has a bidirectional link with poverty and is associated with poor socio-economic conditions in both developed and developing countries (32–36). There was insufficient data collected in the present study to assess the income of surveyed individuals or deduce the economic level of the household, in order to investigate the relationship between disability and poverty on an individual level. However, on a regional level, a statistically significant disparity of disability prevalence was observed among different administrative Moroccan regions. Moreover, the prevalence of disability rate curve evolved in the opposite direction to the gross domestic product (GDP) among different administrative Moroccan regions (Fig. 3), highlighting the need for a comprehensive national strategy to improve the living conditions of PWD, which would take into consideration geographical disparities and priorities.
The present study is the first large survey on disability in Morocco to be conducted using standardized measuring tools, and to yield reliable and comparable data on disability and its aspects. The results are critical to guide national disability policies and programmes, to focus on removing disabling barriers and improving the access of PWD to healthcare and participation.
Fig. 3. Variation trends of disability prevalence rates and gross domestic product (GDP) per capita** in different Moroccan geographical regions. **Regional estimates of GDP per capita (%) in 2014, according to the Moroccan High Commission for Planning.
The study was conducted and funded by the Moroccan government as part of a National Action Plan on Disability.
The authors have no conflicts of interest to declare.


 Click to show fullsize
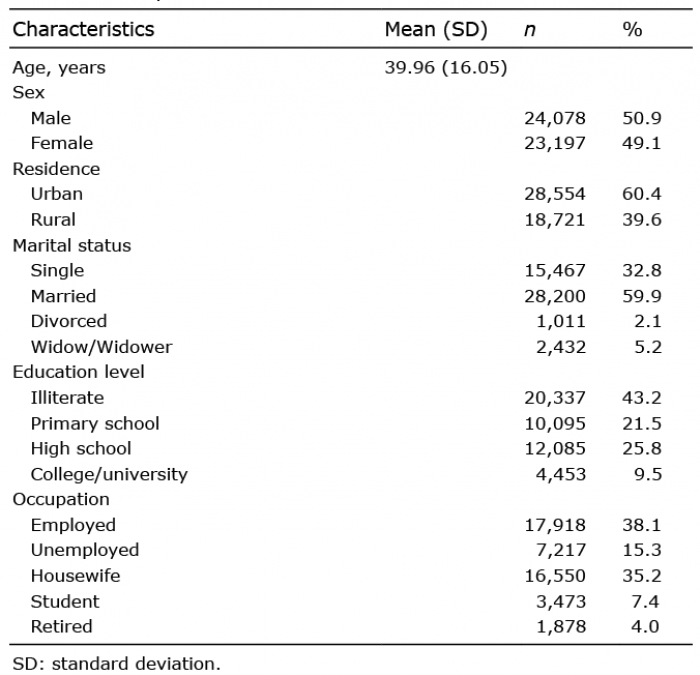 Click to show fullsize
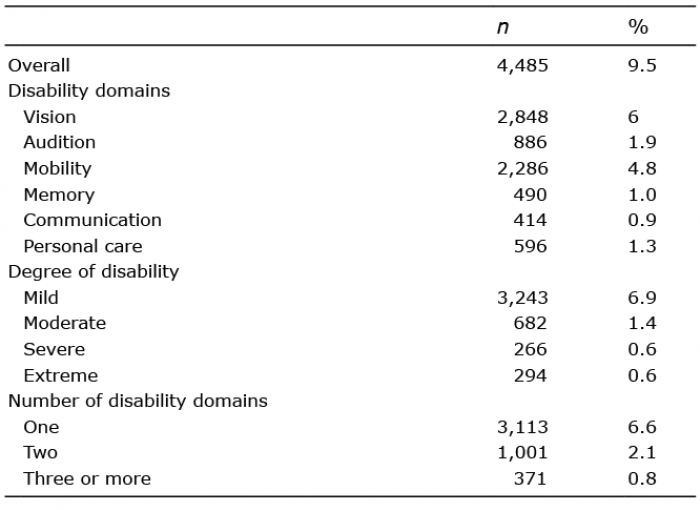 Click to show fullsize
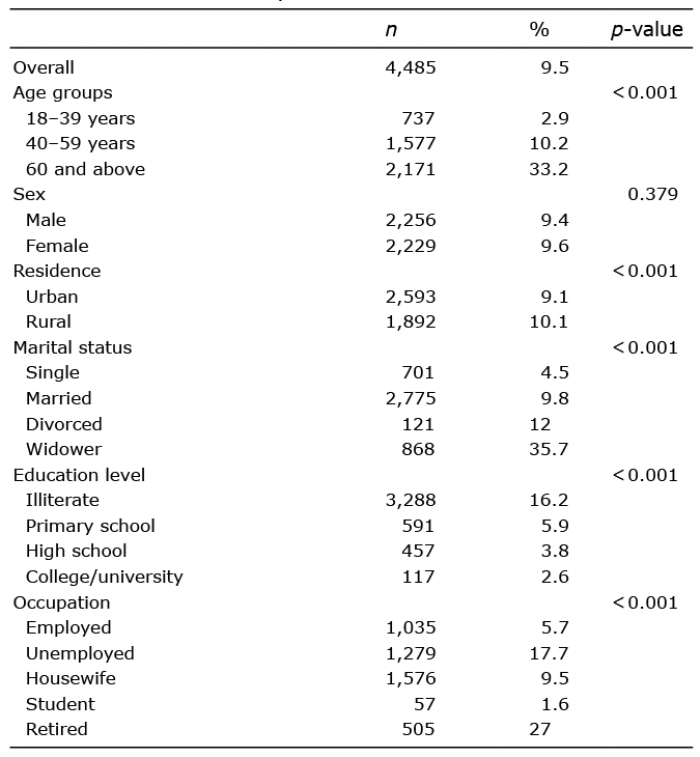 Click to show fullsize
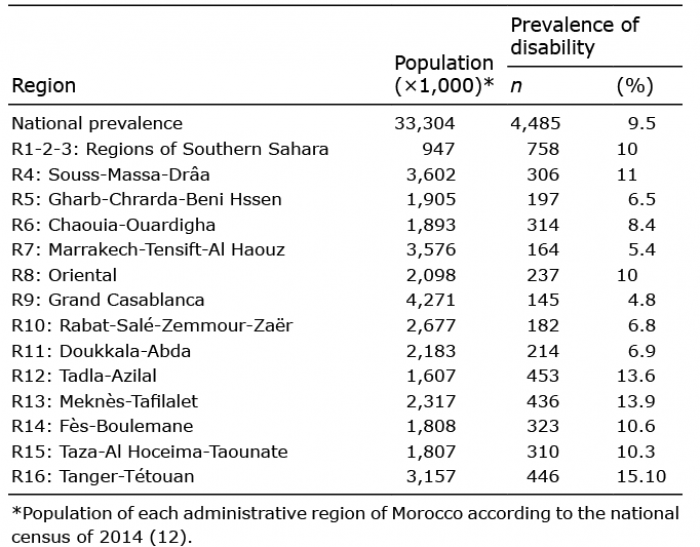 Click to show fullsize
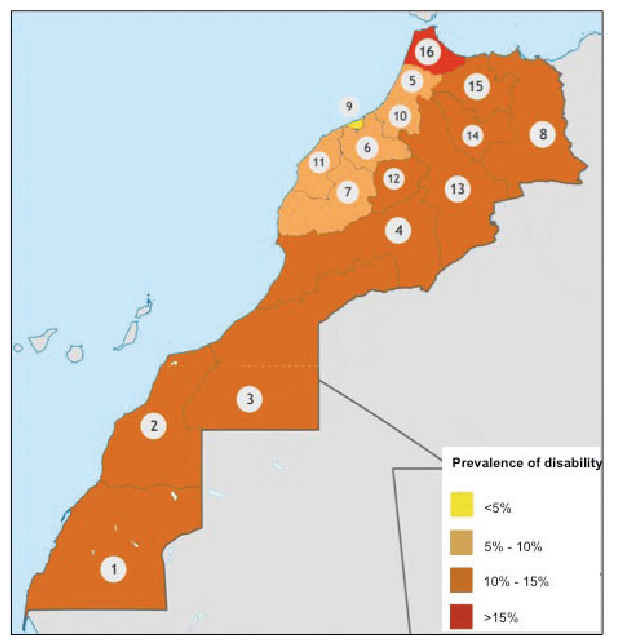 Click to show fullsize
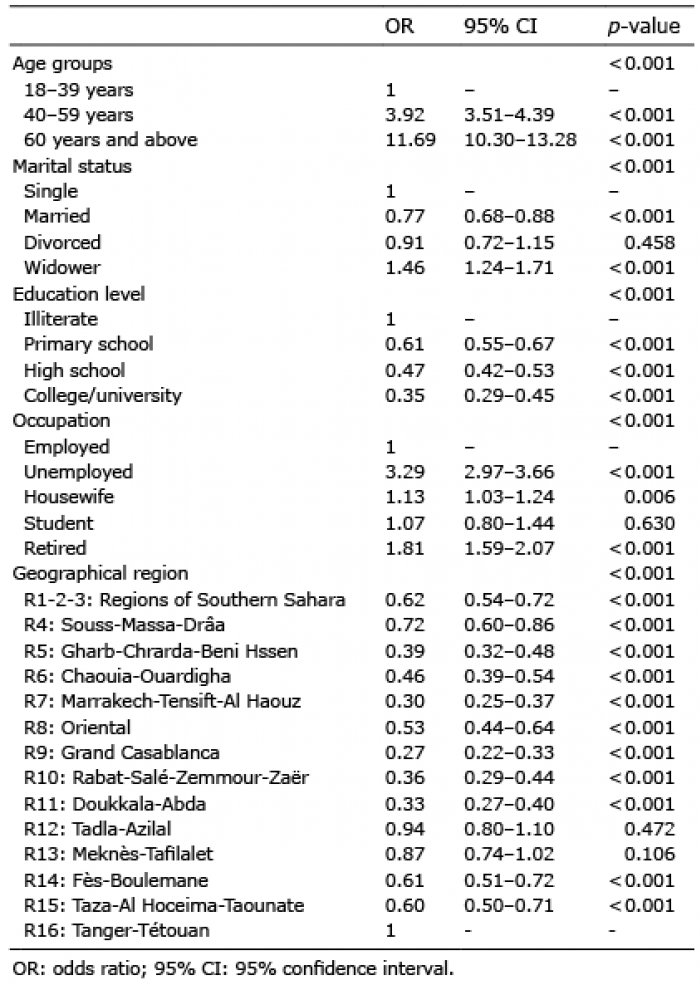 Click to show fullsize
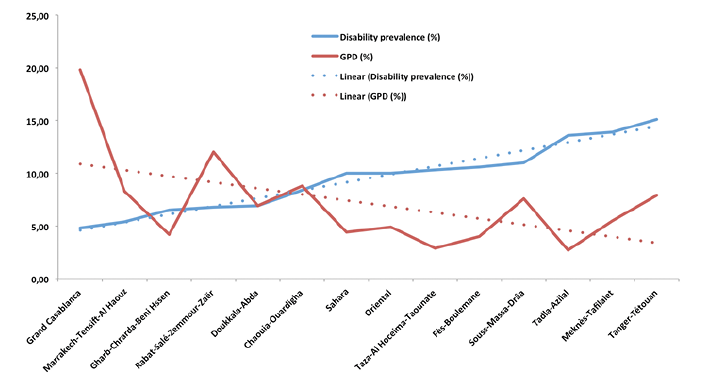 Click to show fullsize