
From the 1Swiss Paraplegic Research (SPF), Nottwil, 2Department Health Sciences and Medicine, University of Lucerne, Lucerne, Switzerland, 3Faculty of Mathematics, Statistics and Computer Science, Semnan University, Semnan, Iran, 4Faculty of Applied Health and Social Sciences, University of Applied Sciences Rosenheim, Rosenheim, Germany, 5Spinal Unit, Montecatone Rehabilitation Institute, Imola (BO), Italy, 6Department of Physical and Rehabilitation Medicine, University Hospitals Leuven, Belgium; KU Leuven – University of Leuven, Department of Development and Regeneration, Belgium, and 7Department of Rehabilitation Medicine and Department of Medical and Health Sciences, Linköping University, Linköping, Sweden
Objective: To identify the impact of moderate-to-severe spasticity on functioning in people living with spinal cord injury.
Design: Secondary analysis of cross-sectional survey data using graphical modelling.
Subjects: Individuals (n = 1,436) with spinal cord injury aged over 16 years with reported spasticity problems.
Methods: Spasticity and 13 other impairments in body functions were assessed using the spinal cord injury Secondary Conditions Scale. Impairments in mental functions were assessed using the Mental Health subscale of the 36-item Short Form (SF-36). Independence in activities was measured with the Spinal Cord Injury Independence Measure Self-Report. Restrictions in participation were measured with the Utrecht Scale for Evaluation Rehabilitation – Participation.
Results: Fifty-one percent of participants reported moderate-to-severe spasticity. Graphical modelling showed that Chronic pain, Contractures, Tiredness, Doing housework, and Respiratory functions were associated with spasticity and were the top 5 potential targets for interventions to improve the experience of spasticity. The associations and intervention targets were dependent on the level and completeness of the lesion.
Conclusion: This is the first application of graphical modelling in studying spasticity in people living with spinal cord injury. The results can be used as a basis for studies aiming to optimize rehabilitation interventions in people with moderate-to-severe spasticity.
Key words: spinal cord injury; spasticity; International Classification of Functioning, Disability and Health; patient-reported outcome measures; undirected graph; directed acyclic graph.
Accepted Jan 29, 2020; Epub ahead of print Feb 26, 2020
J Rehabil Med 2020; 52: jrm00037
Correspondence address: Cristina Ehrmann, Swiss Paraplegic Research, 6207 Nottwil, Switzerland. E-mail: cristina.bostan@paraplegie.ch
Spasticity is one of the most common complications of spinal cord injury. It influences limitations in functioning. Comprehensive evidence on the impact of spasticity on all domains of functioning may be beneficial to optimize rehabilitation interventions aimed at reducing the effects of spasticity. This is the first application of graphical modelling to study and visualize the impact of moderate-to-severe spasticity on functioning in people living with spinal cord injury. The results show that chronic pain, contractures, tiredness, doing housework, and respiratory functions were the functioning domains associated with spasticity. These are therefore the top 5 potential targets for interventions to improve the experience of spasticity. In addition, the level and completeness of lesions should be considered when studying spasticity in relation to all domains of functioning. These results should be used as a basis for studies aiming to optimize rehabilitation interventions in people with moderate-to-severe spasticity.
To increase the economic and social participation of people living with spinal cord injury (SCI), knowledge of functioning needs to be complemented with information on how secondary complications influence functioning limitations in the context of SCI. Evidence demonstrates continuing high levels of complications, such as respiratory infections, urinary tract infections, spasticity, pain, blood pressure problems, and pressure sores, with more than one complication occurring concurrently, even many years after injury. Therefore, people living with SCI are more likely to be re-hospitalized and to have a disrupted daily life (1–4).
An important focus of rehabilitation interventions is to improve functioning by counteracting the effects of complications on functioning. However, a causal relation between these complications and functioning has yet to be established. According to the International Classification of Functioning, Disability and Health (ICF), the impact should be studied across the components of functioning, from body functions and structures to activities and participation (5). Each component is divided into domains (e.g. “mental functions” for the component body functions and structures, or “mobility” for the component activities and participation). The domains are divided into categories at varying levels of granularity (up to 4 levels). The ICF categories are units of the ICF classification and reflect the various levels of the hierarchical code system.
Spasticity is one of the most common complications after SCI (6). There is still no consensus on the definition of spasticity, although a commonly used one is “disordered sensorimotor control, resulting from an upper motor neuron lesion, presenting as intermittent or sustained involuntary activation of muscles” (7). Spasticity has both positive and negative effects. The term “disabling spasticity” has been used when people perceive that spasticity limits their activities in daily life (8), and is therefore a target for intervention. Evidence pointing to the relationship between spasticity and functioning has shown significant interference with daily activities in people with more severe, self-reported spasticity compared with people with no or only mild spasticity (9). The impact of severe spasticity on body functions and structures and on performance in different daily activities is poorly documented. Apart from the vicious cycle between spasticity and different secondary complications after SCI, such as pressure sores (10), the effect of improving functioning by reducing spasticity was studied on the overall performance of activities of daily living, rather than on specific functioning domains, such as mobility or self-care (11). Comprehensive evidence on the relationship between spasticity and all domains of functioning is required to optimize rehabilitation interventions aimed at reducing the impact of spasticity.
Graphical modelling is a probabilistic tool that has not yet been utilized to analyse and display the relationships between spasticity and different categories of functioning (12). A graph consists of nodes standing for variables of interest and connections (edges) representing conditional dependencies. Graphical modelling has been used to study the epidemiology of functioning in people living with SCI. This consists of visualizing complex associations between domains of functioning, reducing dimensions, comparing association structures, and estimating potential intervention targets to improve self-reported general health (13). Graphical modelling does not make any a priori assumptions about directionality when studying these associations, as do other multivariate exploratory methods (e.g. multiple regression analysis, structural equation modelling, and factor analysis) (13).
The present study used a graphical modelling approach to investigate the impact of moderate-to-severe spasticity on people’s functioning by: (i) identifying and visualizing the categories of functioning associated with spasticity; and (ii) identifying the potential targets for interventions to reduce the impact of spasticity on functioning. Conceptually based on the ICF, the Swiss Spinal Cord Injury (SwiSCI) Community Survey (14) includes information on spasticity, other complications after SCI and functioning in different domains, such as self-care, mobility and involvement in life situations. These data have already been used successfully to describe the complex interrelationship between mild-to-severe spasticity and other categories of functioning (14). However, as spasticity is damaging in its more severe forms, and people with self-reported moderate spasticity tend to shift towards reporting more severe spasticity over time, additional information on factors that may improve the experience of reported spasticity is needed (15).
Participants and design
This is a secondary analysis of cross-sectional survey data from the SwiSCI Community Survey. Swiss residents with traumatic or non-traumatic SCI aged 16 years or older were invited to participate in the survey (16). People were recruited using a contacts database established through the national association for people living with SCI (Swiss Paraplegic Association), 3 specialized SCI rehabilitation centres and a SCI-specific home-care institution. Exclusion criteria were: (i) congenital conditions leading to SCI, (ii) new SCI in the context of palliative care, (iii) neurodegenerative disorders, and (iv) the Guillain-Barré syndrome. Survey participants returned: (i) informed consent, (ii) the initial short questionnaire on socio-demographics, lesion characteristics and the care situation, and (iii) a longer questionnaire covering functioning and environmental factors. Non-missing data about spasticity were considered.
Data were collected between September 2011 and March 2013, and this survey will continue to be conducted again every 5 years following initial data collection. Brinkhof et al. demonstrated a minimum impact of response bias with regards to personal characteristics on survey results (17). Moreover, self-reported demographics (age, sex) and SCI characteristics (years of SCI, lesion level and lesion severity) showed high reliability by linking this self-reported information with available medical record data (17). The inverse probability weight was used to correct for the non-response bias. The data were collected using written or online questionnaires and, in special cases, conducting telephone interviews. The SwiSCI study was approved by the regional research ethics committees on research involving humans of Cantons of Lucerne, Basel-Stadt and Valais.
Outcome measures
The questions from SCI Secondary Conditions Scale that assess how much spasticity affected the subject’s activity and independence in the previous 3 months on a 4-point Likert scale (“not existing or insignificant”, “mild or infrequent”’, “moderate or occasional”, or “significant or chronic’) was used for the spasticity outcome (18).
Data on the severity of 13 other impairments in body func-tions, including injury caused by loss of sensation, chronic pain, postural hypotension, circulatory problems, respiratory problems, bowel dysfunction, urinary tract infection, bladder dysfunction, sexual function, contractures, decubitus, sleep disorders, and autonomic dysreflexia, during the previous 3 months was collected with the SCI Secondary Conditions Scale (18).
The Mental Health sub-scale of the 36-item Short Form (SF-36) was used to assess impairments in mental functions.
Independence in performing activities was evaluated using the SCI Independence Measure Self-Report, a self-reported version of SCI Independence Measure III developed for this survey (19).
Performance problems in participation were evaluated using the Utrecht Scale for Evaluation Rehabilitation – Participation (20).
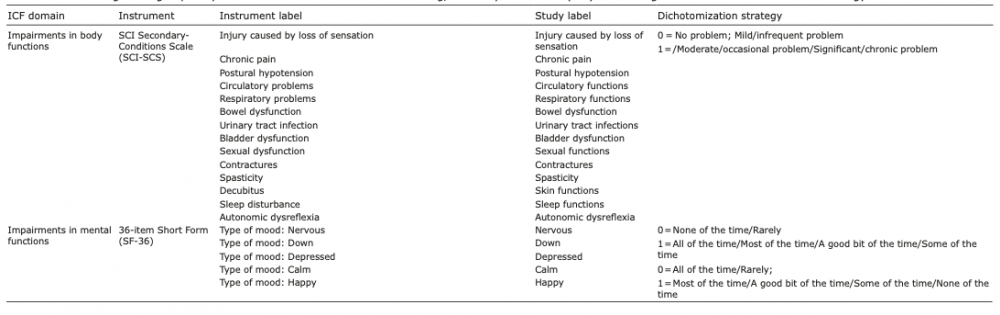
A detailed description of each item used to operationalize each category of functioning is shown in Table I. For each functioning item, the answers were dichotomized into 0, for “not existing or insignificant problems/difficulty”, and one, for “existing and significant problems/difficulty”. For impairments in body functions, the answer “mild/infrequent problem” was coded as 0 (“not existing or insignificant problems/difficulty”).
Table I. Functioning items grouped by International Classification of Functioning, Disability and Health (ICF) functioning domains and dichotomization strategy
Statistical analysis
R version 3.5 was used for all analyses (21), in particular R package missForest for imputing the missing data (22), R package pcalg for identifying functioning categories associated with spasticity (23), and R syntax, developed by Mahmoudi et al., for detemining the potential intervention targets for improving spasticity (24). The sample characteristics were evaluated using descriptive statistics. The International Spinal Cord Society recommendations were used to categorize age, SCI aetiology, severity of injury and time since injury (25).
As in a previous study, each category of functioning was operationalized in terms of the items in these instruments. Moreover, Partner relationship and Work/education items were excluded from the analysis, since 22.92% and 29.20% of the 1,436 study participants did not participate in these activities (14).
Functioning categories associated with spasticity
The skeleton of a directed acyclic graph (DAG) model was used to identify and visualize the functioning categories associated with spasticity. This model is an undirected graph, in which nodes (circles) represent the functioning categories and the undirected edges (lines) represent the conditional associations among the considered functioning categories. Fig. 1a shows a simple example of a skeleton model. The nodes stand for functioning categories Sports, Skin functions and Spasticity. Any undirected edge in this model indicates a strong dependence when controlling for the remaining functioning categories. The absence of an undirected edge between Sports and Spasticity indicates conditional independence, meaning that information about Sports does not provide any information about Spasticity when controlling for Skin functions (and vice versa). For constructing the skeleton model, any 2 variables were tested for conditional independence given any subsets of the remaining variables (first part of the Peter and Clark (PC) algorithm for determining a DAG with a significance level of 0.01 (23). To enhance the accuracy and validity of model selection, the skeleton was estimated for each of the 100 samples generated from the imputed data using the Gibbs sampling procedure derived by Hoff, given that univariate histograms of all variables and Shapiro–Wilk’s test indicated non-normality (26). The results were aggregated in a summary graph (27). The thickness of undirected edges corresponds to the strength of the association: the 20% with the strongest associations are printed in bold, and the 20% with the weakest associations are printed in grey.
To visualize the differences in the association structure between paraplegic and tetraplegic SCI populations, and between complete and incomplete SCI populations, respectively, the association structure was estimated for each subgroup, as described previously.
Fig. 1. A simple example of: (a) a skeleton of a directed acyclic graphical model (DAG), (b) a possible transformation of the skeleton from (a) in a DAG, and its corresponding intervention graph. The nodes represent the functioning categories: Sports, Skin functions and Spasticity.
Potential targets for interventions for improving spasticity
The potential targets for interventions for improving spasticity were identified using Pearl’s do-calculus of intervention implemented by Mahdi Mahmoudi & Wit. in R (24). In the first step of this calculus, each skeleton identified in the association analysis is transformed in a DAG by applying the second part of the PC algorithm (28, 29). Fig. 1b shows a possible transformation of the skeleton of a DAG, represented in Fig. 1a, into a DAG. The arrow between Skin functions and Spasticity indicates that Skin functions contains information that influences Spasticity. Skin functions is referred to as a parent of Spasticity in graphical-modelling theory. In a DAG there is no cycle, such as Sports → Skin functions → Spasticity → Sports. In the second step of this calculus, for each obtained DAG, a clinical intervention was statistically simulated for each variable by forcing the variable’s values from “problem” to “no problem” one after another. The causal effect of Skin functions on Spasticity was estimated by regressing Spasticity on Skin functions when controlling for the functioning variables that are parents for Skin functions (Sports). This is the first-order Taylor estimator proposed by Madhi Mahmoudi & Wit (24). The effect of such a simulation for each variable on Spasticity was then estimated for each of the 100 data-sets. The mean for all the estimates for each variable was calculated, and the variables were ranked according to the size of the effect of the simulated intervention.
Sample characteristics
From a total of 3,144 eligible persons contacted by post, 1,539 individuals participated in the study, with spasticity data being available for 1,436. Table II shows detailed participants’ characteristics and the missing percentage, and the mean and standard deviation of functioning items. Approximately two-thirds of the sample had paraplegia (68.8%), while approximately half had an incomplete lesion (57.4%). Missing data on functioning items ranged from 0.3% (Grooming) to 13.64% (Bladder management). A total of 51.7% reported moderate-to-severe problems in Spasticity. The most frequently reported functioning problems were Doing housework (82.3%), climbing Stairs (82.3%) and performing Sports (70.1%).
Table II. Participants’ characteristics, initial missing percentage (IMP) and the mean and standard deviation of functioning categories
Functioning categories associated with spasticity
Fig. 2 shows the functioning categories conditionally associated with Spasticity in the overall sample. The skeleton model showed stable (identified in more than 20 generated samples) associations between Spasticity and functioning categories from all ICF domains of functioning: impairments in body functions: Chronic Pain, Contractures, Sexual functions, Bladder dysfunction, Respiratory functions, and Bowel dysfunction; impairments in mental functions, Tiredness; independence in performing activities: Dressing lower body; performance problems in participating: Doing housework, Sports activities.
Fig. 2. The associations identified around Spasticity for the overall spinal cord injury (SCI) sample (n = 1,436).
Comparison of spinal cord injury subsamples
Paraplegic compared with tetraplegic SCI subsamples. Fig. 3 shows the results of the skeleton model when comparing the association structures around Spasticity between paraplegic and tetraplegic SCI subsamples. The associations of Spasticity with Chronic pain, Contractures and Sexual functions were stable associations identified in both SCI subsamples. In the paraplegic SCI subsample, strong associations (more than 20 generated samples) were identified between Spasticity and Bladder dysfunction. Moreover, spasticity is associated with having problems with doing housework or dressing lower body. In the tetraplegic SCI subsample, association between Spasticity and Bowel dysfunction were strong. Weak associations (less than 20 generated samples) were shown between Spasticity and Tiredness, Skin functions and Circulatory functions in the paraplegic SCI subsample, and between Spasticity and Respiratory functions in the tetraplegic SCI subsamples.
Fig. 3. The resulting functioning categories conditionally dependent with Spasticity when comparing the association structure between paraplegic spinal cord injury (SCI) population (n = 988) and tetraplegic SCI populations (n = 448).
Incomplete compared with Complete SCI subsamples. Fig. 4 shows the results of the skeleton model when comparing the association structures around Spasticity between incomplete and complete SCI subsamples. In more than 20 generated samples, Spasticity was associated with: (i) Chronic pain and Contractures for both SCI subsamples, (ii) having problems in Doing housework and Sexual functions for incomplete SCI subsamples, and (iii) Bladder dysfunction, Urinary tract infection and having Telephone/computer contacts for the subpopulation with complete SCI. Weak associations (in less than 20 generated samples) were identified between Spasticity and (i) Tiredness, Autonomic dysreflexia and having problems in Dressing upper body for both SCI subsamples, (ii) having problems in Dressing lower body and Circulatory functions for the incomplete SCI subsample, and (iii) Spasticity and Respiratory functions, Tiredness and Sexual functions for the complete SCI subsample.
Fig. 4. The resulting functioning categories conditionally dependent with Spasticity when comparing the association structure between complete spinal cord injury (SCI) population (n = 612) and incomplete SCI populations (n = 428).
Potential intervention targets for improving spasticity
The total causal effect of Chronic pain (meanover 100 samples =0.925, SDover 100 samples=0.108), Contractures (meanover 100 samples =0.880, SDover 100 samples=0.108), Tiredness (meanover 100 samples =0.725, SDover 100 samples=0.111), Doing housework (meanover 100 samples =0.726, SDover 100 samples=0.134) and Respiratory functions (meanover 100 samples =0. 679, SDover 100 samples=0.132) on Spasticity were the top 5. Moreover, Contractures and Chronic pain were identified as functioning categories for which an intervention may diminish the functional impacts of moderate-to-severe spasticity for all SCI subsamples (Appendix II).
This is the first study to explore the relationship between spasticity and all domains of functioning, as defined in the ICF, using a graphical modelling approach. The association structures of problems in spasticity and all categories of functioning, according to lesion level and lesion completeness, was further compared and visualized. Moreover, functioning categories in which an intervention may change the effect of spasticity on functioning from moderate-to-severe to none-to-mild were identified.
With no a priori hypothesis, a number of associations identified by previous research between Spasticity and the other measured categories of functioning were confirmed, which supports the face validity of the method used. For example, this study showed that Contractures is associated with Spasticity (6) and that both Spasticity and Contractures may contribute to Chronic pain and Tiredness (30). The results of this study also confirmed that muscle spasms are associated with Bladder dysfunction (31) and may interfere with participating in sexual activities (32). The graphical representation of conditional dependence relationships as a map may help clinicians to better understand the dynamic nature of spasticity.
A triangle formed by spasticity and 2 other functioning categories, e.g. (i) Spasticity, Chronic Pain and Contractures; (ii) Spasticity, Chronic Pain and Tiredness; (iii) Spasticity, Chronic Pain and Sexual functions; (iv) Spasticity, Contractures and Tiredness; (v) Spasticity, Bladder dysfunction and Sexual functions; (vi) Spasticity, Contractures and Respiratory functions; (vii) Spasticity, Bladder dysfunction and Bowel dysfunction and (viii) Spasticity, Sexual functions and Bowel dysfunction indicates that Spasticity may be a confounding variable in the association of the other 2 variables. However, it remains essential for treating clinicians to appreciate that the contextual factors can also influence the efficacy of interventions.
Graphical modelling gave different results in the SCI subsamples under consideration. This confirms that the prevalence of spasticity in different SCI subgroups should be kept in mind when recognizing the features of spasticity of people’s functioning (33). While previous research has stated that the relationship between Spasticity and Tiredness is unclear, this study provides empirical evidence that Tiredness is associated with high levels of Spasticity present mostly in the tetraplegic population (34). Moreover, the mixed results of 2 prospective studies on a relationship between the presence of Urinary tract infection and increased Spasticity may be explained by our results. Spasticity may indicate the presence of Urinary tract infection as a medical problem, and may also be associated with Bladder dysfunction in people with complete SCI (35, 36). Further studies are needed to confirm these associations.
Graphical modelling allowed us to describe the interactions of spasticity with different categories of functioning, which are all relevant and should be considered when setting goals during the rehabilitation process of people with SCI. For example, the path Spasticity–Doing housework indicates that spasticity includes information that could influence performance in this daily activity, while the path Spasticity–Contractures–Moving<100 m or the path Spasticity–Respiratory functions–Breathing indicates that spasticity is associated with the performance in daily activities as the result of its association with different secondary complications after SCI (see Appendix II).
Study limitations
This study has some limitations. Firstly, all analyses were limited by cross-sectional, missing and dichotomized data. Therefore, for interfering causality, it is recommended that these results are validated using follow-up data and inference at both population and individual levels (37). Secondly, the presence of spasticity and the range of its effect on functioning was based on a single question in the SCI Secondary Conditions Scale; a scale for which reliability, validity and sensitivity to change need be tested with larger and diverse SCI samples (18). However, to date there is no recommended instrument for assessing spasticity, since previous research showed that the Ashworth Scale is not sufficiently valid and reliable as a measure for spasticity (38). Thirdly, the small sample for the SCI subsamples considered might produce sparse graphs. Fourthly, the Pearl intervention calculus may introduce “collider bias” when conditioning on a collider node in the regression analysis is used. A collider node is a variable that has both the preceding and the subsequent nodes with directed edges going to this variable (39). Fifthly, the exact level and the lesion completeness, based on the American Spinal Injury Association system, were not collected (40).
Conclusion
This study shows that graphical models are a flexible tool for studying and visualizing the impact of moderate-to-severe spasticity on the functioning of people living with SCI. With no a priori assumptions, meaningful associations were identified between spasticity and functioning categories from all ICF components of functioning and intervention targets for improving functioning by reducing spasticity that depend on the level and completeness of the lesion. On this basis, graphs as presented in this paper may be used as a new tool to describe and understand the impact of a problem on a specific ICF category on overall functioning.
This study has been financed in the framework of the Swiss Spinal Cord Injury Cohort Study (SwiSCI, www.swisci.ch), supported by the Swiss Paraplegic Foundation.
The members of the SwiSCI Steering Committee are:
Xavier Jordan, Fabienne Reynard (Clinique Romande de Réadaptation, Sion); Michael Baumberger, Hans Peter Gmünder (Swiss Paraplegic Center, Nottwil); Armin Curt, Martin Schubert (University Clinic Balgrist, Zürich); Margret Hund-Georgiadis, Kerstin Hug (REHAB Basel, Basel); Urs Styger (Swiss Paraplegic Association, Nottwil); Daniel Joggi (Swiss Paraplegic Foundation, Nottwil); NN (Representative of persons with SCI); Nadja Münzel (Parahelp, Nottwil); Mirjam Brach, Gerold Stucki (Swiss Paraplegic Research, Nottwil); Armin Gemperli (SwiSCI Coordination Group at Swiss Paraplegic Research, Nottwil).
The authors have no conflicts of interest to declare.
Appendix I. The association structure among the categories of functioning for the overall spinal cord injury (SCI) sample identified in more than 20 generated samples.
Appendix II. The output from Pearl’s intervention calculus assessing the effect of a simulated statistical intervention on each functioning category on Spasticity. The mean of the intervention effects (regression coefficients) and of the standard deviation over the 100 samples are provided for each functioning category. The top 5 targets for intervention are shown in bold.


 Click to show fullsize
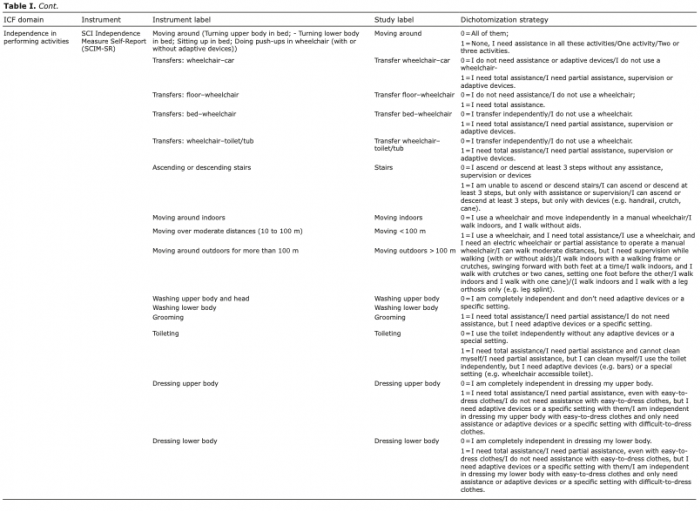 Click to show fullsize
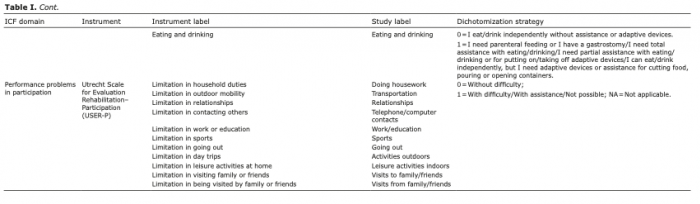 Click to show fullsize
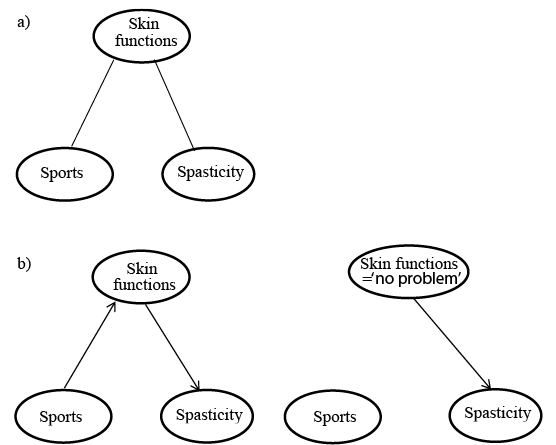 Click to show fullsize
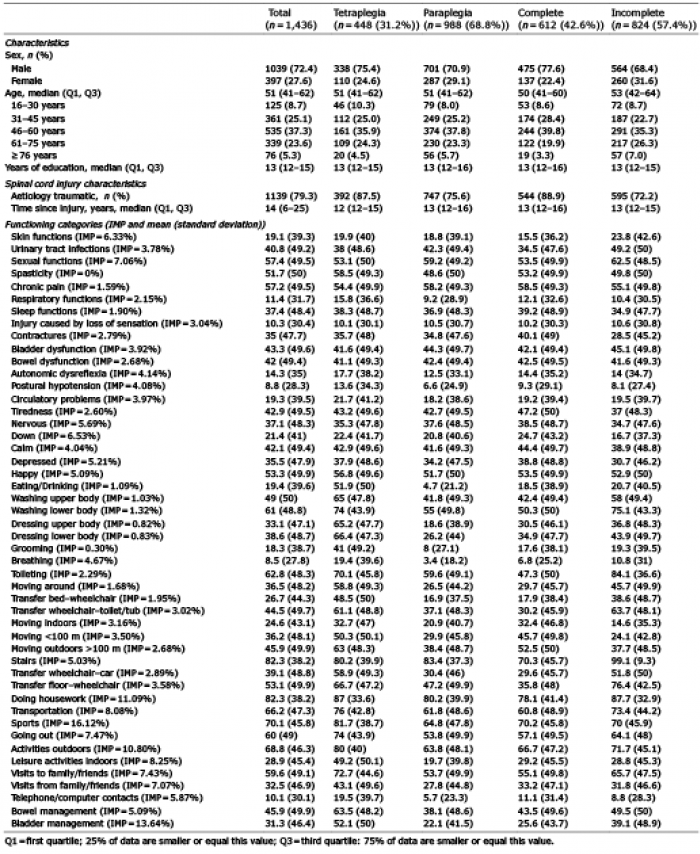 Click to show fullsize
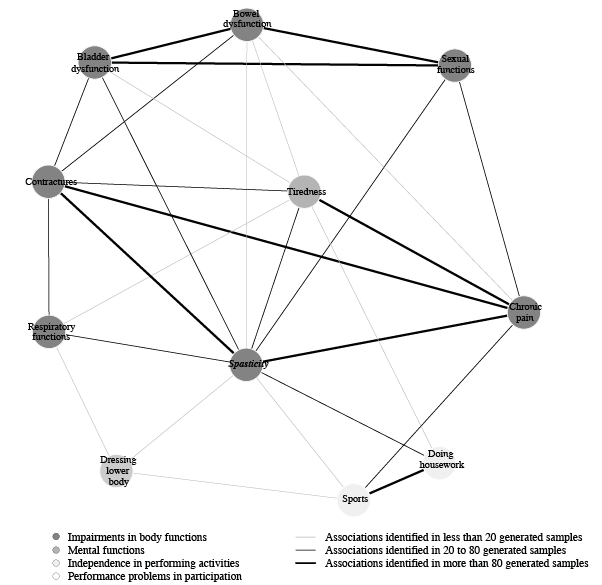 Click to show fullsize
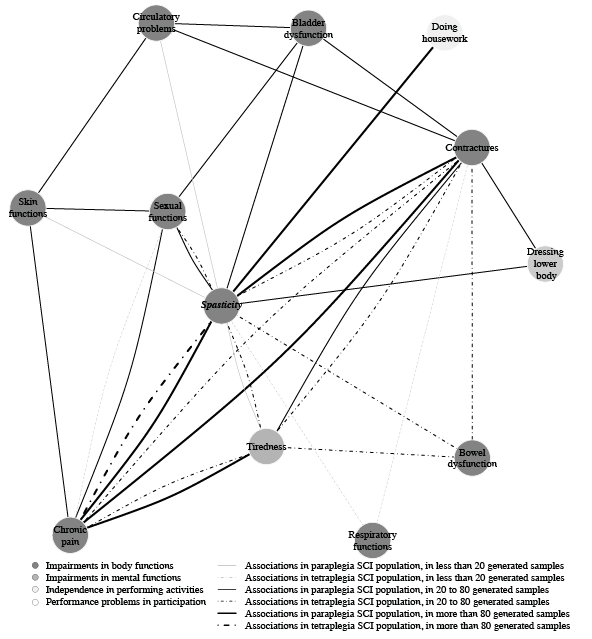 Click to show fullsize
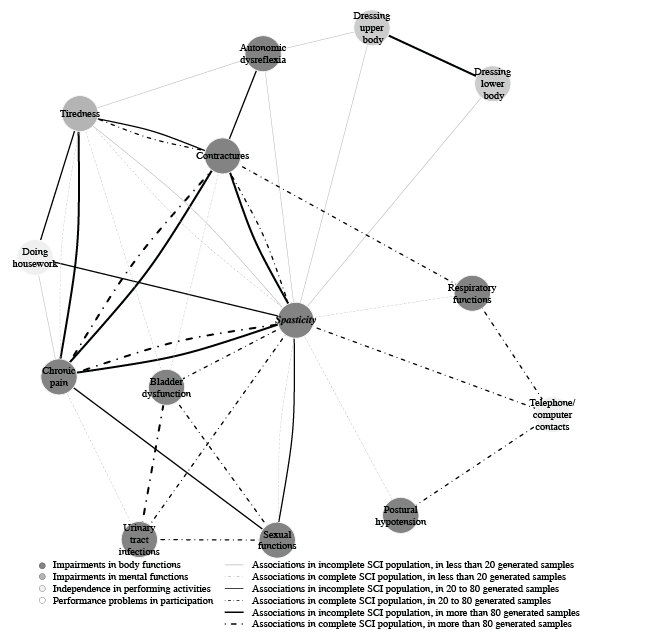 Click to show fullsize
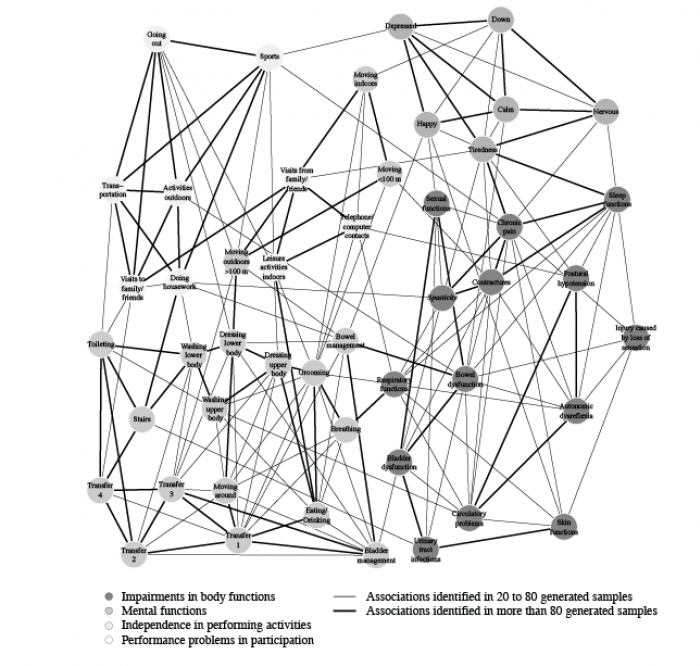 Click to show fullsize
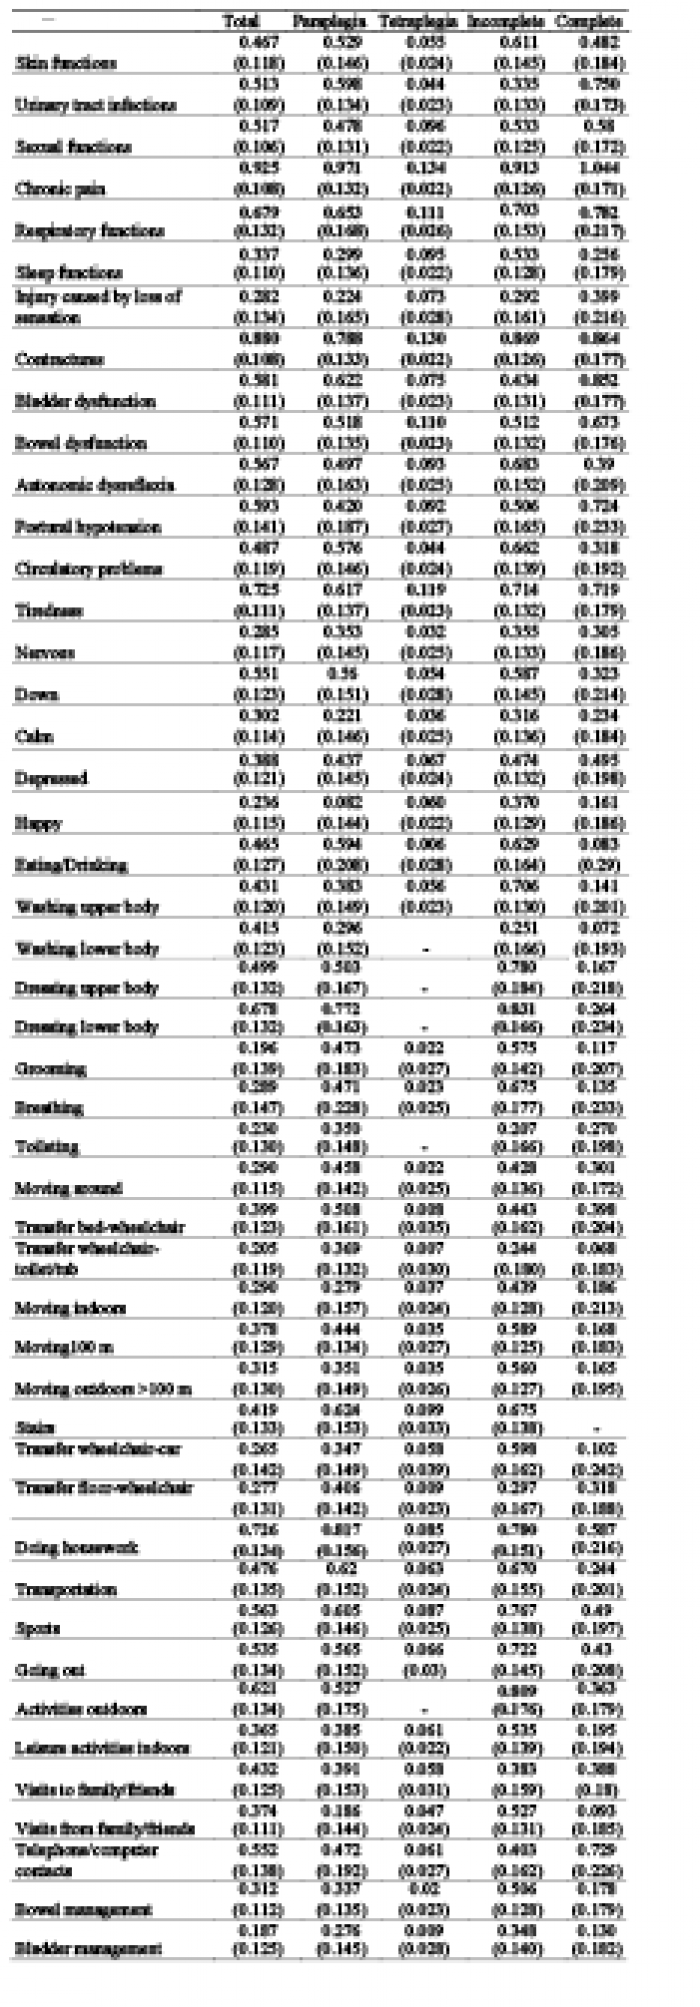 Click to show fullsize