OBJECTIVE: To explore the relationships between perceived limitations in walking-related daily activities, walking ability (capacity), and the amount of daily walking (performance) in persons affected by leprosy and to identify their determinants.
DESIGN: A cross-sectional study.
SUBJECTS: Thirty-nine persons affected by leprosy.
METHODS: Perceived limitations were assessed with the World Health Organization Disability Schedule II, domain “getting around”. Walking capacity was assessed as covered distance in 6 min. Walking performance was recorded as mean strides/day with the StepwatchTM 3 Activity Monitor. Potential determinants were sensory function, foot deformities, joint mobility, ankle muscle strength and co-morbidity.
RESULTS: Perceived limitations in walking-related activities were significantly correlated with walking capacity (r = –0.47; p < 0.01) but not with walking performance, although walking capacity significantly correlated with walking performance (r = 0.38; p < 0.05). Various foot impairments independently contributed to reduced walking capacity and, to a lower degree, to perceived limitations in activities and performance.
CONCLUSION: People affected by leprosy perceive limitations in walking-related activities that are determined by a reduced walking ability and the severity of foot impairments. Since perceived limitations in walking-related activities were not related to walking performance, perceived limitations are apparently weighted against the individual’s needs.
Key words: mobility limitation; activities of daily living; mononeuropathies; leprosy; walking.
J Rehabil Med 2011; 43: 32–38
Correspondence address: F. J. Slim, Department of Rehabilitation, Academic Medical Center, PO Box 22660, NL-1100 DD Amsterdam, The Netherlands. E-mail: f.j.slim@amc.uva.nl
Submitted May 5, 2010; accepted August 30, 2010
INTRODUCTION
Walking is an essential activity of daily life for many domestic and occupational tasks and can be affected by neurological disorders such as peripheral neuropathy due to leprosy. Damage of the sensory, motor, and autonomic nerve fibres results in loss of thermal, nociceptive and pressure senses, muscle pareses and dryness of the skin (1). At the foot, joint contractures and foot deformities may develop and absorption (shortening) of toes can occur (2). All these impairments may affect walking ability of a person and subsequently affect activities of daily living.
The relationship between leprosy impairments in general and perceived limitations in daily activities has been shown previously (3–5). Furthermore, lower limb impairments in leprosy have been associated with perceived limitations in walking and standing (6). We have recently shown that leprosy-affected persons living in The Netherlands perceive substantial limitations, particular in “getting around” and “household/work activities” and that these limitations were related to leprosy impairments (7). In the present study, we aimed to further explore the pathway to perceived limitations in daily living, in particular activities related to walking.
Within the International Classification of Functioning, Disability and Health (ICF), activities and participation can be moderated by capacity (what a person with a health condition can do in a standard environment) or by performance (what a person actually does in their usual environment). It is plausible that perceived limitations in walking-related daily activities are related to a reduced ability to walk (i.e. walking capacity) and to less walking in daily life (i.e. walking performance). However, these relationships have never been investigated in persons affected by leprosy. Furthermore, identifying underlying determinants is important to develop intervention strategies to reduce perceived limitations in walking-related activities.
The aim of our study was therefore to explore the relationships between perceived limitations in walking-related activities, walking capacity and walking performance in daily life and to identify their independent determinants.
METHODS
Design and sample
A cross-sectional study was performed in previously treated people affected by leprosy from the outpatient clinic of dermatology at the Academic Medical Center in Amsterdam, The Netherlands.
Inclusion criteria were: leprosy diagnosed according to the Ridley and Jopling classification (1966) and a minimum age of 18 years (8). The study was approved by the local ethics committee and informed consent was obtained prior to the start of the study. Data were recorded as part of a larger, cross-sectional study on the consequences of leprosy impairments (7).
Protocol
During a single visit to the hospital, a clinical foot examination was performed, demographics and medical history were noted and perceived limitations in activities of daily life were assessed with a questionnaire. A walking test was performed and patients were given an activity monitor. All tests were explained and carried out by the same investigator.
Clinical foot examination
A detailed foot examination was performed and included assessment of: muscle strength of the ankle dorsal and plantar flexors, toe and foot deformities, joint mobility of the ankle and MTP 1 joint and quantitative sensory testing including NDS, VPT and PPT (Details of the assessment are described in Appendix I). The World Health Organization (WHO) disability grading was used to define 3 groups: Grade 0 = a normal foot (with normal PPT), Grade 1 = impaired sensation (abnormal PPT) and no visible impairments and Grade 2 = visible deformity/impairment (claw/hammer toes, amputation/absorption of toes, ulcers, drop foot or end-stage neuro-osteoarthropathy) (9).
| Appendix I. Clinical foot examination |
| Muscle strength of the ankle dorsal flexors and plantar flexors was determined by manual muscle testing and was graded from 0 to 5 according to the Medical Research Council Scale (22). The score for left and right side was added for each muscle group (range 0–10). |
| Foot deformities assessed were: presence of hammer/claw toes, hallux valgus, absorption/amputation, pes cavus/planus, ankle varus/valgus (all observed in weight-bearing position), prominent metatarsal head (palpation) and end-stage neuro-osteoarthropathy (also called neuropathic bone disorganization). Hammer/claw toes were only scored when significant absorption of toes was not present at the same time. A score of 1 was given for each deformity present on either one or both feet, except for amputation, which was scored as 1 for below ankle and 2 when above ankle amputation (indicating more serious foot impairment). A foot deformity sum-score was obtained by adding the scores of all the deformities (range 0–8). |
| Joint mobility of the ankle and first metatarsophalangeal (MTP 1) joint were measured using a goniometer. Ankle joint mobility was measured with the patient supine and knee extended. The goniometer was aligned with the fibula and the plantar part of the foot and maximum passive dorsal flexion was determined. Maximum passive MTP 1 joint extension was measured in standing position. MTP 1 joint extension was defined as the sum of the angle between floor and first metatarsal added to the angle between the floor and the maximally extended hallux. The goniometer was aligned with the floor and the shaft of the first metatarsal and with the floor and proximal phalanx of the hallux, respectively. The side with the lowest mobility for both the ankle and MTP 1 joint was used for analysis. |
| Quantitative sensory testing included the Neurological Disability Score (NDS), the vibration perception threshold test (VPT) and the pressure perception threshold test (PPT). All tests were performed 3 times. NDS was obtained from examination of the ankle reflex, vibration, nociceptive and temperature sensation (23). A pinprick with a blunt and a sharp side was used to measure nociceptive perception, a tuning fork (128 Hz) to assess vibration perception and temperature perception was tested using the Tip-Therm® (AXON GmbH, Dusseldorf, Germany). With all tests a forced-choice procedure was used. The sensory modalities were scored as either normal (0) or abnormal (1); ankle reflexes were scored as normal (0), present with reinforcement (1), or absent (2). Scores of both feet were summed and reflected the NDS (range 0–10). The VPT was measured using a neurothesiometer (Horwell Scientific Laboratory Supplies, Wilford, Nottingham, UK), which is a hand-held device with a vibrating rubber probe that is balanced vertically on the top of the toe. The voltage (range 0–50) was increased until the vibration was felt (24). A mean score of 3 attempts was obtained per foot, and the highest score was used for analysis. Cutaneous PPT was determined using the 10 gram Monofilament (Rehaforum Medical® GmbH, Elmshorn, Germany) on 3 sites; the plantar surface of the hallux and the first and fifth metatarsal heads of the foot (25). PPT was rated as disturbed when one or more out of 3 sites were scored as incorrect (≥ 2 attempts should be felt per site). A disturbed PPT scored on either one or both feet was used for analysis. |
Co-morbidity was assessed using mCIRS, which is a validated questionnaire consisting of 14 relatively independent categories grouped under body systems (10). The severity for each category was scored from 1 to 5 (“none” to “extremely severe”). A sum-score was obtained by adding the scores from the 14 categories (range 14–70).
Perceived limitations in walking-related activities were assessed with the Dutch version of the World Health Organization – Disability Assessment Schedule II (WHO-DAS II) (11). The questionnaire includes 36 items organized into 6 multi-item domains. Only the domain “getting around” was used, as this is a walking-related activity domain. Getting around is assessed with 5 items: standing for long periods such as 30 min, standing up from sitting down, moving around inside your home, getting out of your home and walking a long distance such as a kilometre or equivalent. Items were scored using a 5-point Likert-scale (1 = “no difficulties” up to 5 = “extreme difficulties/not possible at all”). Raw scores were translated into a scale from 0 to 100, using WHO-DAS syntax. Low values indicate few limitations.
Walking assessment
Walking capacity was assessed using the 6-min walking test (6MWT) on a 50-m indoor circuit (12). Participants were instructed to walk at comfortable speed and were allowed to use their regular walking aids. The covered distance in 6 min was measured.
Walking performance in daily life was assessed using the StepWatchTM 3 Activity Monitor (SAM) (Orthocare Innovations, Mountlake Terrace, WA, USA). The SAM was worn on the right ankle for 7 consecutive days, except when sleeping, bathing, showering or swimming. A diary was kept to register daily activities (such as walking, sleeping and cycling). The mean average daily stride count was used for analysis (one stride equals two steps). A correction was performed to the data by excluding activity, which according to the diary was related to cycling.
Statistical analysis
Data were analysed by descriptive statistics. Independent t-tests were used to compare groups for the dichotomous determinants. A one-way analysis of variance (ANOVA) with Tukey post hoc tests was conducted to test for differences between the 3 groups according to the WHO disability grading and outcome measures. Pearson’s correlation coefficients were used for investigating associations between continuous determinants and outcome measures. A point bi-serial correlation coefficient was performed to quantify the relationship between dichotomous determinants and the outcome measures.
Multiple stepwise linear regression analysis was used to study the independent contribution of the determinants to the outcome measures. Variables with a univariate p-value < 0.1 were entered into the model to obtain a set of mutually independent determinants. Potential determinants were categorized into: nerve function, foot deformities, joint mobility, muscle strength and co-morbidity. The analysis was performed in two steps: Step 1: the potential determinants (p < 0.1) were reduced to only significant determinants for each category per outcome using a stepwise regression procedure. Step 2: the independent determinants identified in step 1 were entered into an overall regression model for each outcome, using a stepwise selection procedure (p < 0.05). Residual analysis was performed to search for violations of necessary assumptions in multiple regression, in terms of linearity, equality of variance, independence of error, normality and influential data points (Cook’s distances). Significance levels of p < 0.05 were used throughout all tests. Statistical analysis was performed using SPSS version 16.0.2.
RESULTS
Thirty-nine participants (59% male) with a mean and standard deviation (SD) age of 59.7 (SD 14.8) years were included. Most participants originated from Suriname (76%) (Table I).
| Table I. Population characteristics (n = 39) |
| Characteristics | |
| Age, years, mean (SD) | 59.7 (14.8) |
| Male/female, n (%) | 23/16 (59/41) |
| Ethnicity, n (%) Western migrants Non-Western migrants From Suriname Others Missing | 3 (8) 35 (90) 29 (76) 6 (15) 1 (3) |
| Footwear, n (%) Adjusted footwear Commercially available Not recorded | 15 (39) 23 (59) 1 (3) |
| SD: standard deviation. |
Seventy-four percent of participants had a disturbed pressure sense (PPT), while 33% and 46% had a disturbed vibration sense (VPT > 25V) and increased NDS (> 6). Approximately half of the participants (49%) had absorption/amputation of toes. More than half of the participants (59%) had claw or hammertoes, prominent metatarsal heads (67%), varus or valgus ankle (71%) and pes cavus or planus (82%) (Table II). A foot drop (ankle dorsal flexors MRC < 3) was found in 4 patients (10%).
| Table II. Mean and frequency of all variables measured |
| Variable | |
| Nerve function | |
| NDS (0–10), median (p25/p75) | 6 (3/10) |
| VPT (Volts, 0–50), median (p25/p75) | 19 (8/29) |
| Disturbed PPT, n (%) | 29 (74%) |
| Foot deformities | |
| Toe amputation/absorption, n (%) | 19 (49) |
| Hammer/clawtoes, n (%) | 20 (59) |
| Hallux valgus, n (%) | 13 (34) |
| Prominent metatarsal heads, n (%) | 26 (67) |
| Pes cavus/planus, n (%) | 32 (82) |
| End-stage neuro-osteoarthropathy, n (%) | 4 (10) |
| Varus/valgus position ankle, n (%) | 27 (71) |
| Foot deformity sum-score, median (p25/p75) | 3 (3/5) |
| Joint mobility, median (p25/p75) | |
| Ankle dorsal flexion motion (max) | 9.5 (3/10) |
| MTP 1 joint extension (max) | 48 (38/62) |
| Muscle strength, mean (SD) | |
| Ankle plantar flexion (MRC sum, 0–10) | 9.8 (0.5) |
| Ankle dorsal flexion (MRC sum 0–10) | 9.4 (1.3) |
| Co-morbidity | |
| mCIRS total (14–70), median (p25/p75) | 19 (17/23) |
| NDS: Neuropathy Disability Score; VPT: Vibration Perception Threshold; PPT: Perception Threshold Test (10 gram monofilament); Foot deformity sum-score: sum-score of all foot deformities (range 0–8); max: maximum degrees; MTP 1: first metatarsophalangeal; MRC: sum-score measured with Medical Research Council scale (0–5); mCIRS: modified Cumulative Illness Rating Scale (score 1–5); SD: standard deviation. |
The mean score of the WHO-DAS II domain “getting around” was 39 (SD 29). The mean distance covered in the 6MWT was 387 m (SD 107) and number of daily strides per day were 4067 (SD 2036) (Table III). Most patients (n = 27) were rated grade 2 according to the WHO disability grading. The number (n) of persons for the total group and subgroup is shown in Table III. In case of missing data the number (n) of persons per variable is also shown. Data of walking performance from one participant was left out of the analysis, as walking performance could not adequately be determined due to inability to correct for cycling activity (i.e. time period of cycling was not stated by participant). With increasing WHO disability grading the mobility outcomes decreased with significant differences between Grade 0 and Grade 2 for walking capacity and walking performance.
| Table III. Walking variables measured for the total group and according to the World Health Organization (WHO) disability grading |
| | Total group (n = 39) Mean (SD) | Grade 0 (n = 7) Mean (SD) | Grade 1 (n = 5) Mean (SD) | Grade 2 (n = 27) Mean (SD) |
| WHO-DAS II domain “getting around” | 39 (29) | 26 (31) | 34 (21) | 43 (29) |
| Walking capacity (m) | 387 (107) (n = 37) | 482 (61)* | 354 (99) | 367 (106) (n = 25) |
| Walking performance (strides/day) | 4067 (2036) (n = 32) | 5697 (2097)* (n = 6) | 4827 (3135) (n = 2) | 3507 (1765) (n = 24) |
| *Sign at p < 0.05 for grade 0 vs grade 2. Grade 0: WHO disability grade 0, normal foot with normal Pressure Perception Threshold; Grade 1: WHO disability grade 1, foot with abnormal Pressure Perception Threshold but no visible impairments; Grade 2: WHO disability grade 2, a foot with visible impairments/deformity (claw or hammer toes, amputation/absorption of toes, ulcers, drop foot or end stage neuro-osteoarthropathy); WHO-DAS II: WHO Disability Assessment Schedule II (0–100); Strides: 1 stride equals 2 steps; SD: standard deviation. |
Associations between perceived limitations in walking-related activities, walking capacity and walking performance
Perceived limitations in walking-related activities was significantly associated with walking capacity (r = –0.47; p < 0.01), however, not with walking performance. A significant relation was found between walking capacity and walking performance (r = 0.38; p < 0.05) (Table IV).
| Table IV. Associations with perceived limitations in walking-related activities, walking capacity, and walking performance |
| | Perceived activity limitationa | Walking capacity | Walking performance |
| Perceived activity limitationsa | × | –0.47** | –0.22 | |
| Walking capacity | –0.47** | × | 0.38* | |
| Walking performance | –0.22 | 0.38* | × | |
| Age | 0.03 | –0.34* | –0.53** | |
| Nerve function | | | | |
| NDS | 0.32* | –0.46** | –0.44** | |
| VPT | –0.01 | –0.37* | –0.25 | |
| Disturbed PPT | 0.26 | –0.42** | –0.42* | b |
| Deformities | | | | |
| Toe amputation/absorption | 0.12 | –0.22 | –0.46* | b |
| Hammer/clawtoes | 0.12 | –0.30 | –0.43* | b |
| Hallux valgus | –0.01 | –0.17 | –0.20 | b |
| Prominent MTH | 0.16 | –0.16 | –0.19 | b |
| Pes cavus/planus | –0.07 | 0.03 | 0.11 | b |
| End-stage neuro-osteoarthropathy (n = 4) | 0.34* | –0.27 | –0.34* | b |
| Varus/valgus ankle | –0.08 | –0.10 | 0.23 | b |
| Foot deformity sum-score | 0.46 | –0.30 | –0.40* | |
| Joint mobility | | | | |
| Ankle dorsal flexion motion | –0.27 | 0.17 | 0.29 | |
| MTP 1 joint extension | –0.31 | 0.45** | 0.47* | |
| Muscle strength | | | | |
| Ankle dorsal flexion | –0.23 | 0.51** | 0.40* | |
| Ankle plantar flexion | –0.49** | –0.48** | 0.18 | |
| Co-morbidity | | | | |
| mCIRS total | 0.31 | –0.19 | –0.28 | |
| *p < 0.05; **p < 0.01. aWorld Health Organization Disability Assessment Schedule II (0–100) domain “getting around”. bData are shown as Pearson correlations and Point Biserial correlation. NDS: sum-score of the Neuropathy Disability Score (0–10); VPT max: maximum Vibration Perception Threshold (Volts, 0–50); PPT: Perception Threshold Test (10 gram monofilament); MTH: metatarsal heads; Foot deformity sum-score: sum-score of all foot deformities (range 0–8); Ankle dorsal flexion motion: maximum dorsal flexion (degrees) of the ankle joint; MTP 1 extension: maximum extension (degrees) of the first metatarsophalangeal joint; Ankle dorsal flexion: Medical Research Council (MRC) sum-score (0–10) of the ankle dorsal flexion strength measured with MRC scale (0–5); Ankle plantar flexion: MRC sum-score (0–10) of the ankle plantar flexion strength measured with MRC scale (0–5); mCIRS: modified Cumulative Illness Rating Scale (score 1–5, range 14–70). |
Determinants of perceived limitation in walking-related activities, walking capacity and walking performance
Several variables in the categories nerve function, foot deformities, joint mobility and muscle strength were associated to perceived limitations, walking capacity and walking performance. However, there was no association with co-morbidity (Table III). Multivariate analysis was performed to investigate the independent contribution of determinants to the perceived limitations in walking-related activities, walking capacity and walking performance (Table V). Ankle plantar flexion strength was independently associated with perceived limitations in walking-related activities (21% total explained variance). Ankle dorsal flexion strength and MTP 1 joint extension were independently associated with walking capacity explaining 24% and 12% respectively of the variance in walking capacity (36% total explained variance). Hammer/claw toes independently contributed to walking performance explaining 15% of the variance.
| Table V. Multiple linear regression analysis: Independent contribution of determinants on perceived limitations in walking-related activities, walking capacity and walking performance |
| Models | Independent variables | B | Standard error | p-value | Adjusted R2 |
| Perceived activity limitations NDS sum-score End stage neuro-osteoarthropathy MTP 1 joint extension Ankle plantar flexion strength | Ankle plantar flexion strength | –26.0 | 8.3 | 0.004 | 0.21 |
| Walking capacity NDS sum-score MTP 1 joint extension Ankle dorsal flexion strength | Ankle dorsal flexion strength MTP 1 joint extension | 37.2 1.6 | 12.10 0.6 | 0.004 0.012 | 0.24 0.36 |
| Walking performance NDS Hammer/claw toes MTP 1 joint extension Ankle dorsal flexion strength | Hammer/claw toes | –1698.8 | 736.7 | 0.030 | 0.15 |
| Independent determinants identified for each category (all determinants with p-value < 0.1) were entered into an overall regression model for each outcome, using a stepwise selection procedure, with a significance level of 0.05. NDS: sum-score of the Neuropathy Disability Score (0–10); MTP 1: maximum degrees of first metatarsophalangeal joint extension; Ankle plantar flexion strength: MRC sum-score (1–10) measured with Medical Research Council scale (0–5); Ankle dorsal flexion strength: MRC sum-score (1–10) measured with Medical Research Council scale (0–5). |
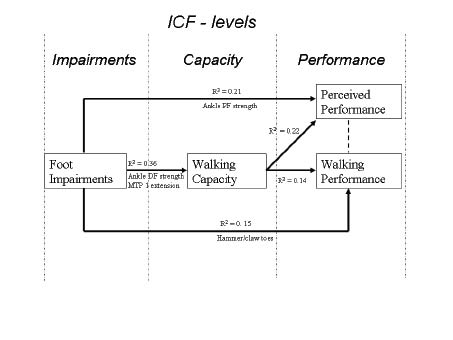
The potential role of impairments of the foot in the pathway from disease to perceived limitations is shown in Fig. 1. This figure illustrates how foot impairments of people affected by leprosy contribute to perceived limitations through walking capacity. Foot impairments lead to reduced walking capacity, and subsequently to perceived limitations. Foot impairments themselves also have a small, direct contribution to perceived limitations in walking-related activities. Furthermore, the figure shows that walking performance is not in the pathway to perceived limitations.
Fig. 1. Pathway to perceived limitations (perceived performance). Diagram shows how foot impairments are independent contributors to walking capacity, perceived limitation in walking-related activities (perceived performance) and walking performance in daily life. Univariate analysis between foot impairments, walking capacity, perceived limitation in walking-related activities (perceived performance) and walking performance are also shown. Black lines indicate a significant association. Dotted line indicates no relationship.Walking capacity: 6-min walking test; Walking performance: number of daily strides using the StepWatch™ 3 Activity Monitor; Perceived limitations in walking-related activities (perceived performance): World Health Organization Disability Assessment Schedule II domain “getting around”; MTP 1: first metatarsophalangeal joint; DF: dorsal flexion; PF: plantar flexion.
DISCUSSION
This study demonstrates that perceived limitations in walking-related activities in persons affected by leprosy are determined by foot impairments and reduced walking capacity. Although foot impairments and reduced walking capacity negatively affect walking performance (actual walking in daily life), the latter does not contribute to perceived limitations in walking-related activities.
That perceived mobility problems were related to leprosy impairments corroborates our previous findings in a larger patient group from which the present study population was derived, that self-reported foot impairments were related to perceived activity limitations (7). The same was found in a study from Nepal, demonstrating that lower limb impairments caused by leprosy were associated with perceived difficulties in walking and standing (6). Differences in daily life circumstances between populations from western and endemic countries may lead to differences in limitations perceived in daily life. However, because WHO-DAS II items concerning walking activity were used in this study, which are universal and not specifically related to culture or society, this effect is likely to have been small. Furthermore, foot impairments were found to be related to a reduced walking capacity, which in turn was related to perceived mobility problems (Fig. 1). However, it appeared that foot impairments also independently contributed to perceived limitations in walking-related activities. This may be explained by the fact that when testing walking capacity on a flat surface, this does not take into account the (full) effects of reduced postural instability and propriocepsis or uneven surfaces on walking in daily life. Walking capacity (mean distance covered in 6MWT) of 387 m in our study was lower compared with healthy subjects (mean 425 m) but greater than in diabetic patients (mean 317 m) (12, 13) in whom peripheral neuropathy was associated with reduced walking capacity and a lower score on a lower-extremity functional test battery (14, 15). This difference could be related to more co-morbidity in diabetes (16). Persons without sensory deficits and foot deformities (WHO Grade 0) had greater walking capacity and activity compared with persons with sensory deficits but without foot deformities (WHO Grade 1). Although these differences were not significant, probably due to insufficient discriminative power with small numbers per group, they suggest that sensory deficits alone may affect walking.
That perceived mobility problems were related to walking capacity is similar to findings in former polio patients (17, 18). This indicates that persons with reduced walking capacity perceive limitations in daily life. Although the quantity of walking in daily life (performance) was related to walking capacity, it was not within the pathway to perceived limitations in walking-related activities. This suggests that a person’s perception of limitations is not related to what that person actually does in daily life, but to the person’s wishes and needs. Nonetheless, walking performance was limited (1250–2450 strides/day) in a substantial number of people (24%) (19). It may be that, over the years, people have adapted their behaviour to a gradual decreasing walking performance and a so-called “response shift” may have occurred, which has counteracted potential negative effects of decreasing performance on the perceived limitations (20).
Multivariate analysis showed that different foot impairments contributed independently to either perceived limitations in walking-related activities, walking capacity and walking performance. These differences in impairments, such as ankle plantar and dorsal flexors strength, may be caused by a mutual correlation between the different impairments. Four of the participants with a foot drop used orthopaedic shoes with a high shaft to support the foot in swing. The properties of these shoes may have affected the relationships with walking outcomes that we have not further explored.
Furthermore, small differences in correlation coefficients in a relatively small group can also lead to different outcomes using regression analysis. Therefore, impairments that did not make it into the final model should also be considered as possible contributors.
Co-morbidity (mCIRS) did not correlate with our outcome measures, indicating that there was no significant influence of other diseases, which may also influence walking. This is in contrast with people with diabetes in whom cardiovascular disease plays an important role in limitation in daily activities and peripheral artery disease, which specifically limits walking performance (13, 19, 21). Unlike diabetes, leprosy is not associated with other co-morbidity.
Our results indicate that health workers should be aware of limitations in walking in persons affected by leprosy. The independent contribution of foot impairments to perceived limitations, walking capacity and walking performance provides an opportunity for interventions to compensate for these impairments, such as provision of ankle-foot orthoses and/or footwear or interventions to improve walking, muscle strength and joint mobility.
It is important to note that perceived activity limitations related to walking may change over time due to deteriorating foot deformities. Further research should investigate the effect of interventions to reduce limitations in walking. Furthermore, we showed that walking performance (walking behaviour) is not an indicator of perceived limitations, and is therefore not a suitable evaluation tool for this purpose.
To our knowledge, this is the first study to investigate the pathway to perceived limitations through the ICF domains impairments, capacity and performance in leprosy. Although a limitation of this study was the small number of participants included compared with other leprosy studies, the strength of this study was the inclusion of treated and clinically stable persons affected by leprosy with a wide range of severity of foot impairments.
The use of an activity monitor may have influenced the daily walking performance. However, because monitoring was done over 7 days, this effect on daily walking performance was likely to be small.
In conclusion, people affected by leprosy perceive limitations in walking-related activities, which are mediated through foot impairments and through a reduced walking capacity. Since perceived limitations in walking-related activities were not related to walking activity in daily life, perceived limitations are apparently weighted against the individual’s needs. Because foot impairments are important contributors, interventions to compensate for these impairments are needed to improve walking capacity and reduce activity limitations.
ACKNOWLEDGEMENTS
The Netherlands Leprosy Relief (NLR) financially supported this study. The authors wish to thank Dr A. Beelen for advice on data analysis.
REFERENCES