Objective and design: Long-term consequences of mild traumatic brain injuries were investigated based on a 10-year follow-up of patients from a previously-published randomized controlled study of mild traumatic brain injuries. One aim was to describe changes over time after mild traumatic brain injuries in terms of the extent of persisting post-concussion symptoms, life satisfaction, perceived health, activities of daily living, changes in life roles and sick leave. Another aim was to identify differences between the intervention and control groups.
Patients: The intervention group comprised 142 persons and the control group 56 persons.
METHODS: Postal questionnaires with a response rate of 56%.
RESULTS: No differences over time were found for the intervention and control groups in terms of post-concussion symptoms. In the intervention group some variables in life satisfaction, perceived health and daily life were decreased. Some roles had changed over the years for both groups. No other differences between the intervention and control groups were found. However, in both groups sick leave decreased.
CONCLUSION: Early individual intervention by a qualified rehabilitation team does not appear to impact on the long-term outcome for persons with symptoms related to mild traumatic brain injuries. The status after approximately 3 weeks is indicative of the status after 10 years.
Key words: brain concussion; brain injuries; traumatic; post-concussion symptoms; quality of life; rehabilitation; intervention studies; RCT.
J Rehabil Med 2011; 00: 00–00
Correspondence address: Elisabeth Elgmark Andersson, School of Health Sciences, Department of Rehabilitation, Jönköping University, Box 1026, SE-551 11 Jönköping, Sweden. E-mail: elisabeth.elgmark@hhj.hj.se
Submitted March 8, 2010; accepted October 29, 2010
INTRODUCTION
Mild traumatic brain injuries (MTBI), defined as; “any period of loss of consciousness; any loss of memory for events immediately before or after the accident; any alteration in mental state at the time of the accident (e.g. feeling dazed, disorientated, or confused); loss of consciousness of approximately 30 minutes or less; after 30 minutes, an initial Glasgow Coma Scale of 13–15; and post-traumatic amnesia not greater than 24 hours” (1), has an incidence in Sweden of approximately 175 per 100,000 inhabitants per annum (2).
MTBI can be followed by post-concussion symptoms (PCS), such as headaches, memory problems, dizziness, irritability and poor concentration (3). An important symptom is fatigue, which influences mental health and, in turn, participation in social, leisure and work activities. Over time, the problems with fatigue will, however, diminish, but some persons will experience problems even after 10 years (4) and so will continue to require healthcare services (5). Many persons who have MTBI have a decreased health-related quality of life (6, 7). However, previous studies have demonstrated that insufficient attention has been paid to the role of psychological distress or pain from associated injuries contributing to PCS (8).
Pre-existing psychiatric or substance abuse problems, poor general health, depression, life stress, unemployment, and protracted litigation may hinder patient recovery (9).
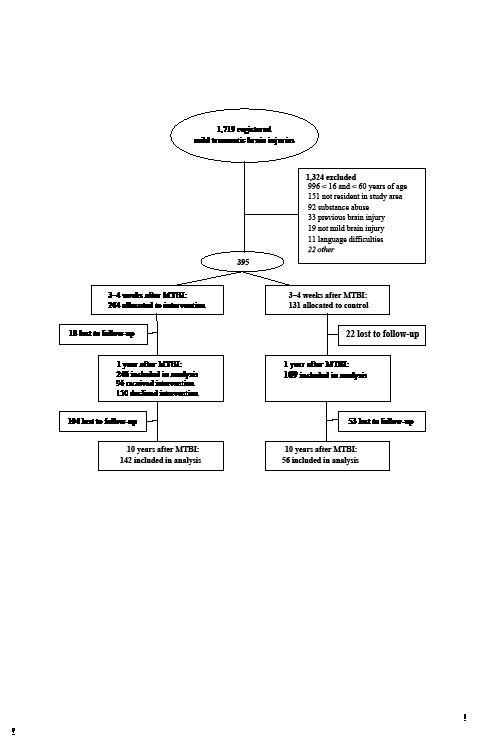
In a prospective randomized controlled trial (RCT) comprising 355 MTBI patients over the years 1997–2001 (see Fig. 1), no improvements were found at the 1-year follow-up in the 96 persons who received intervention, nor in the 150 persons who declined intervention (10). The 96 persons in the intervention group received intervention comprised of information provision, counselling, general encouragement and pharmaceutical assessment 2–8 weeks after the injury. Furthermore, individualized treatment was provided to address PCS and enhance daily activities. Controls (n = 109) and persons in the intervention (n = 150) group who declined intervention recovered and returned to their pre-injury status. Hence, individual intervention by a qualified rehabilitation team did not appear to change the outcomes 1 year after injury.
At present, i.e. 10 years later, no follow-up exists within the public medical service in Sweden for persons with MTBI (11), and the evidence remains limited about how best to support them (12, 13). Hence, however unlikely, possible long-term effects of the individual interventions remain unclear. Consequently, the aim of the present study was to investigate the long-term consequences of MTBI, based on a 10-year follow-up of patients from a previously-published randomized controlled study of mild traumatic brain injuries (10). The objective was to describe changes that occur in the 10 years following MTBI, in terms of residual PCS, life satisfaction, participation in activities of daily living (ADL), perceived health, changes of life roles and sick leave. A secondary objective was to examine any differences between the group that received intervention and the control group, approximately 10 years after MTBI.
METHODS
Participants
Fig. 1 shows the patients’ flow through the trials. Approximately 10 years after the MTBI, the 355 persons who participated in the original RCT (10) were posted the same questionnaire again. The inclusion criteria for the original study were: age range 16–60 years with MTBI according to the definition of a Mild Traumatic Brain Injury by the American Congress of Rehabilitation Medicine (Mild Traumatic Brain Injury Committee 1993) (1).
Fig. 1. Trial flow-chart.
Exclusion criteria for the original study described above were: previous clinically significant brain disorders (earlier brain injury, psychiatric disease, or intellectual disabilities), a history of substance abuse, language difficulties (non-native Swedish speakers) and not being a resident of the catchment area.
Randomization was performed in the proportion 2:1 (rehabilitation group: control group) (14). The two groups were balanced according to the following 10 variables (age, sex, loss of consciousness, amnesia, acute alcohol intoxication, focal neurology, dizziness, headache, vomiting, and nausea). In the intervention group, 246 patients were contacted by telephone 2–8 weeks (median 3 weeks) after the MTBI. The patients were asked if anything had changed in their lives after the injury. There were 150 of the 246 patients who just had a few PCS and stated that their health had been restored to pre-injury level and thus declined treatment. The remaining 96 patients who felt unwell because of PCS were offered an appointment at the rehabilitation centre. The control group had no contact with the rehabilitation centre.
In the present follow-up study total, 142 (58%) persons in the intervention group and 56 persons (51%) in the control group agreed to participate. Their demographic data are presented in Table I.
No drop-out analysis was performed.
|
Table I. Demographic data of the participants
|
|
|
Intervention group (n = 142)
|
Control group (n = 56)
|
|
Age, years, mean, (median) [range]
|
43 (40) [26–68]
|
44 (42) [26–68]
|
|
Sex, male/female, n
|
84/58
|
37/19
|
|
Marital status, na
|
|
|
|
Single adult
|
16
|
7
|
|
Married/cohabiting
|
113
|
44
|
|
Divorced/widowed/separated
|
10
|
5
|
|
Employment
|
|
|
|
Student
|
17
|
5
|
|
Employed, n
|
95
|
39
|
|
Unemployed
|
2
|
0
|
|
Full-time housework
|
11
|
5
|
|
Retired
|
5
|
2
|
|
Sick listed
|
12
|
5
|
|
aMissing data for 3 participants.
|
Instruments
The assessments instruments were:
• Post-Concussion Symptoms Questionnaire (PCSQ), comprising 20 “Yes” or “No” questions (3).
• Life Satisfaction Questionnaire (LiSat-11) (15), comprising 11 questions responded to on a 6-grade scale. Higher scores indicate better life satisfaction.
• Instrumental Activity Measure (IAM) is a modified version that includes 11 ”Yes” or ”No” questions within areas that would normally be performed in daily life (16).
• Short-Form Health Survey (SF-36) (17, 18), which quantifies bodily and mental aspects by self-rating 8 health domains, viz. Physical functioning, Role functioning – physical, Bodily pain, General health, Vitality (energy and fatigue), Social functioning, Role functioning – emotional, Mental health. The 8 domains include 36 items. The item raw scores are summed and transformed into a 0–100 scale, where higher scores indicate better health.
• A modified Swedish version (19) of the Role Checklist (20), including 11 ”Yes” or ”No” questions on ”at present” participation in different occupational roles and 11 “Yes” or “No” questions on sought after, i.e. “wish to”, participation in these roles.
• Self-reported sick leave data for the last 10 years.
The study was approved by a regional ethics committee at Gothenburg University.
Statistical methods
Comparisons within the groups were made between baseline, i.e. the injured person’s self-rated measurement on the following instruments: LiSat-11, IAM, Role Checklist, and the 10-year follow-up. PCSQ, SF-36 and sick leave within-group data were compared between 1 and 10 years after the injury. Statistical analyses were performed using the Statistical Package for Social Science (SPSS) (version 14.0). Pearson’s χ2 or Fischer’s exact test, depending on the expected count, were used to analyse changes over time and differences between the two groups with respect to PCSQ, IAM, Role Checklist and sick leave data. Wilcoxon’s signed-rank test was used to analyse the paired LiSat-11 and SF-36 data over time and Mann–Whitney U test to analyse differences between the two groups with respect to LiSat-11 and SF-36 data at the 10-year follow-up.
All analyses were based on a α = 0.05, but Bonferroni corrections were applied to avoid type I errors. Hence, the critical α-values were adjusted to:
• 0.0040 for IAM and LiSat-11 item comparisons
• 0.0020 for PCSQ and Role Checklist item comparisons
• 0.0014 for SF-36 data item comparisons
RESULTS
Post-concussion symptoms
In the analysis of the persistence of post-concussion symptoms, no differences were found over time, either within the intervention group, or within the control group. Comparisons of data between the intervention group and control group collected at the 10-year follow-up revealed no differences, as shown in Table II.
|
Table II. Post-concussion symptoms questionnaire data at 1 and 10 years after mild traumatic brain injuries. Critical α-value after Bonferroni correction = 0.0020
|
|
Post-concussion symptoms
|
Intervention group
1 year after injury
Yes/No
(n = 226)
|
Intervention group
10 year after injury
Yes/No
(n = 134)
|
Controls
1 year after injury
Yes/No
(n = 101)
|
Controls
10 year after injury
Yes/No
(n = 55)
|
p-values; differences between intervention and control group after 10 years
|
|
Extremity weakness
|
50/175
|
44/88
|
22/80
|
13/42
|
0.175a
|
|
Sensitive to noise
|
55/169
|
39/94
|
22/80
|
11/44
|
0.146a
|
|
Hard of hearing
|
33/190
|
35/98
|
12/89
|
11/44
|
0.338a
|
|
Sensitivity to light
|
44/181
|
28/105
|
15/87
|
5/50
|
0.047a
|
|
Visual impairment
|
59/163
|
47/86
|
26/76
|
17/37
|
0.575a
|
|
Anosmia
|
15/208
|
11/121
|
2/100
|
1/54
|
0.114b
|
|
Dizziness
|
69/155
|
33/101
|
29/71
|
9/45
|
0.185a
|
|
Language difficulties
|
56/167
|
34/98
|
16/86
|
8/47
|
0.071a
|
|
Orientation problems
|
10/215
|
5/129
|
6/96
|
1/54
|
0.673b
|
|
Decreased simultaneous capacity
|
37/186
|
25/108
|
14/88
|
6/48
|
0.494a
|
|
Fatigue
|
89/132
|
54/79
|
28/73
|
16/39
|
0.125a
|
|
Poor concentration
|
72/151
|
41/92
|
25/76
|
10/45
|
0.070a
|
|
Poor memory
|
61/161
|
43/91
|
22/80
|
12/43
|
0.121a
|
|
Irritability
|
79/146
|
44/90
|
25/77
|
13/42
|
0.195a
|
|
Anxiety
|
64/161
|
35/95
|
22/80
|
12/43
|
0.441a
|
|
Depression
|
78/144
|
46/87
|
30/71
|
13/42
|
0.205a
|
|
Emotional labiality
|
62/161
|
49/84
|
20/81
|
10/45
|
0.013a
|
|
Sleep disturbances
|
37/186
|
37/96
|
20/82
|
10/45
|
0.370a
|
|
Increased sleeping times
|
39/182
|
19/73
|
12/90
|
6/30
|
0.628a
|
|
Headache
|
92/131
|
39/94
|
35/67
|
13/42
|
0.402a
|
|
Neck pain
|
77/145
|
46/88
|
43/58
|
17/38
|
0.643a
|
|
aχ2 test, bFisher’s exact test.
|
Life Satisfaction Questionnaire
With respect to “Life in general”, comparisons of data at baseline and 10 years after injury revealed a decrease in life satisfaction for the intervention group, i.e. a mean decrease of 0.32 (95% confidence interval (CI) 0.13–0.53, Z (133) = –3.1, p = 0.002), in “Contacts” with friends and acquaintances, i.e. a mean decrease of 0.45 (95% CI 0.28–0.68, Z (133) = –3.6, p < 0.001), and in the ability to manage ADL, i.e. a mean decrease of 0.35 (95% CI 0.19–0.51, Z (131) = –4.1, p < 0.001). However, the item “Somatic health” decreased in both groups, i.e. the mean decrease in the intervention group was 0.51 (95% CI 0.28–0.74, Z (134) = –4.2, p < 0.001), whereas a mean decrease of 0.80 (95% CI 0.41–1.2, Z (53) = –3.7, p < 0.001) was found in the control group. No other decreases were found over time. Furthermore, between the 2 groups at the 10-year follow-up, no differences were found with respect to any of the items in LiSat-11.
Instrumental Activity Measure
In the intervention group, more participants reported problems cooking a meal and fewer were driving at the 10-year follow-up in comparison with baseline, as shown in Table III. At the 10-year follow-up, no differences were found between the two groups with respect to any of the items in IAM.
|
Table III. Changes in daily activities as measured by Instrumental Activity Measure (IAM) between baseline and at the 10-year follow-up. Critical α-value after Bonferroni correction = 0.0040
|
|
IAM items covering whether daily
activities are carried out (“Do you…?”)
and encountered problems or difficulties in:
|
Intervention group
|
Control group
|
Differences at 10-year follow-up between the 2 groups
p
|
|
Baseline
Yes/No (n)
|
10-year follow-up
Yes/No (n)
|
p
|
Baseline
Yes/No (n)
|
10-year follow-up
Yes/No (n)
|
p
|
|
Personal hygiene, grooming, dressing
|
3/233
|
4/137
|
0.432
|
3/99
|
3/53
|
0.667
|
0.408
|
|
Outdoor mobility
|
3/233
|
6/135
|
0.085
|
3/99
|
1/56
|
1.0
|
0.676
|
|
Preparing a snack
|
2/234
|
2/139
|
0.632
|
2/100
|
0/57
|
0.537
|
1.0
|
|
Cooking a meal
|
3/232
|
6/135
|
0.002*
|
3/99
|
5/52
|
0.036
|
0.301
|
|
Cleaning
|
10/225
|
15/126
|
0.085
|
6/96
|
7/50
|
0.136
|
0.739
|
|
Do you use public transport?
|
69/163
|
25/115
|
0.011
|
29/73
|
9/48
|
0.073
|
0.728
|
|
Problems with public transportation
|
5/199
|
9/120
|
0.45
|
3/87
|
2/51
|
1.0
|
0.514
|
|
Do you drive?
|
164/71
|
125/15
|
< 0.001*
|
70/31
|
50/6
|
0.005
|
1.0
|
|
Problems driving a car
|
9/213
|
14/125
|
0.023
|
2/89
|
3/51
|
0.361
|
0.406
|
|
Shopping
|
7/228
|
15/126
|
0.016
|
3/99
|
7/50
|
0.226
|
0.739
|
|
Washing
|
7/228
|
9/132
|
0.113
|
4/98
|
5/52
|
0.284
|
0.550
|
|
*Significantly different (p < 0.0040) at the 10-year follow-up compared with baseline.
|
Short-Form Health Survey
In the analyses of the SF-36 data over time, 2 of the 8 domains, viz. “Bodily pain” and “Vitality (energy and fatigue)” demonstrated a lower score at the 10-year follow-up in the intervention group. For the control group, no differences over time were found. Moreover, no differences were found between the two groups at the 10-year follow-up, as shown in Table IV, which also provides Swedish reference data.
|
Table IV. Changes in daily activities as measured by Short-Form Health Survey between 1 year after injury and at the 10-year follow-up. Critical α-value after Bonferroni correction = 0.0014. Reference data are provided
|
|
Items
|
Intervention group 1 year after injury (n = 226)
|
Control group
1 year after injury (n = 101)
|
Intervention group 10 year after injury (n = 140)
|
Control group
10 year after injury (n = 56)
|
Swedish reference group (18) (n = 8930)
|
|
Physical functioning
|
90.6 (88.3–92.8)
|
90.6 (87.6–93.6)
|
85.7 (82.3–89.2)
|
88.9 (83.5–94.4)
|
87.9 (87.5–88.3)
|
|
Role functioning – physical
|
77.1 (72.6–81.6)
|
72.5 (65.3–79.7)
|
74.5 (68.0–80.9)
|
75.9 (66.1–85.8)
|
83.2 (82.5–83.8)
|
|
Bodily pain
|
70.4 (66–7–74.0)
|
66.2 (60.1–72.2)
|
66.5 (61.9–71.1)*
|
60.6 (52.4–68.4)
|
74.8 (74.3–75.4)
|
|
General health
|
70.7 (67.4–55.2)
|
70.1 (65.1–75.1)
|
68.2 (64.1–72.2)
|
67.3 (60.1–74.5)
|
75.8 (75.4–76.3)
|
|
Vitality (energy and fatigue)
|
58.5 (55.2–61.8)
|
59.8 (55.0–64.5)
|
55.9 (51.9–59.8)*
|
56.5 (49.4–65.3)
|
68.8 (68.3–69.3)
|
|
Social functioning
|
84.1 (81.2–87.1)
|
81.2 (76.1–86–3)
|
82.2 (78.1–86.4)
|
82.7 (75.8–89.7)
|
88.6 (88.2–89.0)
|
|
Role functioning – emotional
|
76.2 (71.5–81.0)
|
74.9 (67.4–82.4)
|
73.8 (67.6–80.1)
|
82.1 (73.8–90.3)
|
85.7 (85.0–86.3)
|
|
Mental health
|
73.1 (70.3–75.8)
|
75.1 (70.8–79.4)
|
72.7 (69.7–75.8)
|
77.2 (72.1–82.3)
|
80.9 (80.5–81.3)
|
|
*Significantly different (p < 0.0014) at the 10-year follow-up compared with one year after injury.
|
Role checklist
More persons in the intervention group aimed to have the “Student” role at baseline rather than after 10 years. The intervention group further claimed to have “Other” roles more frequently at 10 years than at baseline, whereas the control group had the role as “Friend” less frequently at 10 years than at baseline, as shown in Table V. No differences were found between the two groups at the 10-year follow-up.
|
Table V. Changes in roles as measured by Swedish Role Checklist between baseline and the 10-year follow-up. Critical α-value after Bonferroni correction = 0.0020
|
|
Roles
|
|
Intervention group
|
Control group
|
Differences at 10-year follow-up between the 2 groups
p
|
|
Baseline
Yes/No (n = 246)
|
10-year follow-up
Yes/No (n = 138)
|
p
|
Baseline
Yes/No (n = 109)
|
10-year follow-up
Yes/No (n = 55)
|
p
|
|
Student
|
At present
|
32/182
|
7/127
|
0.005
|
19/81
|
2/48
|
0.013
|
1.000
|
|
Wish to
|
90/103
|
34/88
|
0.001*
|
34/51
|
10/37
|
0.029
|
0.382
|
|
Worker
|
At present
|
170/47
|
112/24
|
0.360
|
72/29
|
39/12
|
0.497
|
0.364
|
|
Wish to
|
182/19
|
107/15
|
0.420
|
76/13
|
41/6
|
0.768
|
0.934
|
|
Care-giver
|
At present
|
88/128
|
69/67
|
0.066
|
42/59
|
25/26
|
0.383
|
0.834
|
|
Wish to
|
130/68
|
94/28
|
0.031
|
52/36
|
30/17
|
0.591
|
0.081
|
|
Home maintainer
|
At present
|
193/25
|
128/10
|
0.192
|
84/19
|
45/17
|
0.433
|
0.252
|
|
Wish to
|
156/44
|
113/12
|
0.004
|
68/21
|
42/6
|
0.119
|
0.584
|
|
Spouse/ Partner
|
At present
|
152/65
|
117/23
|
0.004
|
68/34
|
41/9
|
0.049
|
0.799
|
|
Wish to
|
173/25
|
115/11
|
0.277
|
79/10
|
43/3
|
0.365
|
0.762
|
|
Family member
|
At present
|
170/44
|
101/35
|
0.259
|
78/24
|
43/9
|
0.374
|
0.222
|
|
Wish to
|
181/23
|
110/15
|
0.842
|
83/11
|
44/2
|
0.221
|
0.162
|
|
Friend
|
At present
|
168/50
|
99/38
|
0.308
|
83/20
|
29/23
|
0.001*
|
0.030
|
|
Wish to
|
186/18
|
114/9
|
0.632
|
86/6
|
37/11
|
0.005
|
0.004
|
|
Volunteer worker
|
At present
|
38/179
|
32/105
|
0.179
|
21/81
|
15/36
|
0.225
|
0.394
|
|
Wish to
|
56/142
|
46/79
|
0.109
|
33/56
|
20/28
|
0.109
|
0.555
|
|
Outdoor leisure
|
At present
|
151/67
|
90/46
|
0.544
|
67/34
|
33/19
|
0.723
|
0726
|
|
Wish to
|
163/42
|
108/18
|
0.155
|
84/11
|
39/9
|
0.243
|
0.467
|
|
Indoors leisure
|
At present
|
94/125
|
67/70
|
0.270
|
48/53
|
27/25
|
0.606
|
0.711
|
|
Wish to
|
113/89
|
80/45
|
0.150
|
57/35
|
30/17
|
0.829
|
0.983
|
|
Other
|
At present
|
14/63
|
20/20
|
< 0.001*
|
7/27
|
2/12
|
1.000
|
0.019
|
|
Wish to
|
15/56
|
16/20
|
0.012
|
9/19
|
2/10
|
0.451
|
0.167
|
|
*Significantly different (p < 0.0020) at the 10-year follow-up compared with baseline.
|
Sick leave data
No significant differences were found between the two groups at the 1-year follow-up and at the 10-year follow-up. However, in both groups, a decrease in sick leave was found. At the 1-year follow-up, 15% were on sick leave, whereas at the 10-year follow-up, 9% were on sick leave. Of those 17 persons’, 9 persons’ sick leave could be attributed to the MTBI, whereas the others’ sick leave had no association with their MTBI.
DISCUSSION
Based on the 10-year follow-up, early individual intervention by a qualified rehabilitation team does not appear to impact on the outcome for persons with MTBI. This is consistent with findings from the one-year follow-up (10). It is plausible that those with few PCS recovered spontaneously within a period of two weeks up to two months after MTBI, while persons with more PCS and other problems approximately 2–8 weeks after injury did not improve after 1 year, nor after 10 (10) years. All acquired PCS remained stable in both groups, and no new symptoms occurred. Indeed, the persons in the intervention group had a lower life satisfaction than controls concerning “Life in general”, as well as with respect to “Contacts” and “ADL” functions. Ten years after the MTBI, all participants reported reduced “Somatic health”, but only those in the intervention group experienced decreased satisfaction with respect to peers and friends. In the present study, perceived life satisfaction (15) and health (17, 18) among the participants were also reduced 10 years previously. Another follow-up study (21) confirms that the quality of life and well-being do not change after MTBI.
However, 10 years is a long time and many critical events can occur in a person’s life that may affect the outcome of quality of life instruments, regardless of any prevailing PCS. Whether or not this is the underlying reason for our results remains unknown. More information is needed about every person’s life over this time-span, in order to answer that question.
Nevertheless, the fact that the intervention group had poorer outcomes was also reflected by the fact that they drove less and more often encountered problems in preparing a meal at the 10-year follow-up. Both of these activities require executive functions and simultaneous capacity. This finding is consistent with another 10-year follow-up (22), which found that persons who had traumatic brain injuries had a worse outcome than healthy controls with respect to cognition, including executive functions. Furthermore, the SF-36 (17, 18) domains “Bodily pain” and “Vitality (energy and fatigue)” were scored lower than at the one-year follow-up for the intervention group. However, at the one-year follow-up (10) both the intervention group and controls reported significantly poorer health-related quality of life than a Swedish reference group, a fact that also remained stable after 10 years. At this second follow-up, the intervention group were less inclined to be students, but reported that they now had roles they did not have before the MTBI. It should be noted that at baseline, 51% were between 16 and 30 years of age so it was expected that the roles would change over the subsequent 10-year period, which may explain these results. Surprisingly, however, sick leave decreased to half of the amount at the one-year follow-up, but was the same in both groups, despite the fact that controls had already recovered from MTBI one year after the injury (10). Hence, despite poorer outcomes in some aspects, the ability to work in the intervention group was not affected in comparison with the control group. A previous study found that person characteristics, injury severity and cognitive functions were not associated with vocational status (23), supporting the findings of the present study. However, sick leave data were self-reported in the present study with no confirmation from the social insurance office.
Although good recovery can be expected for most adults sustaining MTBI (5), the risk factors for a poor outcome after a MTBI remain unidentified. Some studies state that an organic structural change occurs in the brain at the acute stage of MTBI, but these changes usually resolve within 3 months (24). In a study of persons with traumatic brain injury and their relatives, a high correlation was found between their reporting of problems and neurobehavioral functioning. The same study also reported an association between subjective reports of cognitive problems and actual test performance, but much stronger relationships were found between cognitive and emotional changes (25). However, in the present study patients with previous clinically significant brain disorders (previous brain injuries, psychiatric diseases or intellectual disabilities), a history of substance abuse and language difficulties were excluded in order to avoid confounding factors that were significantly related to poor outcomes.
Only a few intervention studies have focused on reducing the prolonged effects of MTBI (22, 26–28). A follow-up by Jacobsson et al. (28) reported that individuals with MTBI were more affected than expected. In addition, a 5–7-year follow-up found that persons after MTBI reported significantly more PCS and poorer perceived health compared with age- and sex-matched control groups (26). Another follow-up study, 5–7 years after head injury showed that poor outcomes were strongly associated with psychosocial factors (29). Several studies state that individual psychological prerequisites, pre-morbidity, and the ability to handle the situation after a MTBI are crucial outcome factors (23, 30, 31). Post-injury psychiatric morbidity, depression and pain, e.g. headache, have a strong relationship with the outcome after MTBI, in addition to work, family and friends (31, 32).
Another important factor for the outcome is that an intervention focusing on PCS may in fact increase the awareness of PCS-like symptoms in any persons (33–35). Consequently, the self-report checklists may have the unwanted consequence of teaching the person how to focus on and simulate symptoms of head injury more convincingly (34–35). The preceding RCT study (8) showed that participants reported significantly more symptoms when a list of symptoms were read for them than when they were asked to state their symptoms spontaneously. With respect to PCS, they are also claimed to be common in the normal population (30) where high rates of acute PCS have been found in persons without traumatic brain injuries. A limitation to the present study is that no information was collected about use of drugs or other therapies during the 10 years. Almost certainly there are interactions between all the factors mentioned.
Litigation or compensation may alter or mitigate possible long-term effects of MTBI (31) and, in combination with depression and pain, they could have an effect on the outcome larger than the brain injury in itself (31, 32). A limitation of the present study is that we have not investigated these factors. Further limitations are low recruitment, and as restricted by the regional ethics committee, that no drop out analysis was performed.
The conclusion of the original RCT study and the present study is that the intervention may not have the desired effect. Furthermore, individuals in the follow-up 2–8 weeks after the MTBI who declined treatment because their health issues had restored maintained the same status 10 years later. This indicates that persons who feel well within two months after a MTBI may not have any problems or reduced health related to MTBI in the future.
In summary, the 10-year follow-up showed no differences between the intervention and control groups in terms of PCS, life satisfaction, ADL, perceived health, roles and sick leave. Over time, some minor changes occurred with respect to ADL, life satisfaction and perceived health in the intervention group. However, in both groups, sick leave decreased significantly.
ACKNOWLEDGEMENTS
This study was supported by the FöreningsSparbankens, Sjuhärad Foundation, Borås, Sweden, the Axel Linder Foundation, Alingsås, Sweden and the Selma Anderssons Foundation, Uppsala University, Sweden. We thank secretaries Margareta Olsson, Marianne Hjalmarsson and Birgitta Hallberg. We are grateful for the support of Sven-Erik Roslin, Head of the physiotherapy department, all at the Rehabilitation Centre, Södra Älvsborgs Sjukhus, Borås, Sweden and Associate Professor Matthew Molineux at the School of Occupational Therapy and Social Work, Curtin University, Perth, WA, Australia.
REFERENCES