OBJECTIVE: To compare kinematic indices in age-matched healthy subjects and stroke patients, by evaluating various tasks performed with a robotic device, and to provide an objective and standardized protocol to assess upper limb impairments in stroke patients.
DESIGN: A prospective cohort study.
SUBJECTS: Age-matched healthy subjects (n = 10) and stroke patients (n = 10).
METHODS: Various kinematic indices were analysed from 3 randomly assigned tasks performed by the affected arm in stroke patients and the dominant arm in healthy subjects. These tasks, composed of large-amplitude, targeted and geometrical movements, were standardized and performed with the ReaPLAN robotic device.
RESULTS: For large-amplitude movements, the stroke patients’ path lengths were less constant in amplitude, less rectilinear and less smooth than those for healthy subjects (p < 0.001). For the targeted movements, the stroke patients’ path lengths were less rectilinear than those of the healthy subjects (p < 0.001). For the geometrical movements, the stroke patients had greater difficulty making the requested shapes compared with the healthy subjects (p < 0.01).
CONCLUSION: Our study proposes an objective and standardized protocol to assess stroke patients’ upper limbs with any robotic device. We suggest that further randomized controlled trials could use this quantitative tool to assess the efficacy of treatments such as robot-assisted therapy.
Key words: robotics; outcome assessment; biomechanics; stroke; upper extremity.
J Rehabil Med 2012; 44: 210–217
Corresponding author: Thierry Lejeune, Université catholique de Louvain, Cliniques universitaires Saint-Luc, Physical Medicine and Rehabilitation Department, Avenue Hippocrate, 10, BE-1200 Brussels, Belgium. E-mail: thierry.lejeune@uclouvain.be
Submitted June 18, 2011; accepted October 29, 2011
INTRODUCTION
Fifteen million people worldwide experience cerebral vascular accidents each year (1) and one-third of these individuals display permanent neurological impairments (1). Intensive and prolonged multidisciplinary rehabilitation has been shown to reduce the neurological impairments and improve patients’ activities and participation (2, 3).
To evaluate the active movements of stroke patients’ upper limbs before and after rehabilitation with robotic-assisted therapy (RAT) (4–8), some authors have recommended the use of kinematic measures to assess upper limbs quantitatively and objectively (5, 9) while avoiding the disadvantages of ordinal and qualitative scales (9).
Kinematic indices could be obtained with a distal effector robotic system used in RAT (9–15). Some of these indices have been studied in stroke patients (9–15), primarily in trials evaluating the efficacy of RAT (9–12, 14). Although various indices have been described, such as target accuracy (10), amplitude of movement (12, 14), straightness (11–13), speed of movement (11, 12, 14), peak speed of movement (11), and smoothness (10, 11, 13, 15), no consensus about the choice of these kinematic indices has been clearly described in the literature.
Kinematic indices have been computed from various tasks, such as pointing at one (10) or multiple targets (11, 13, 15), moving as far as possible in various directions (12, 14), and carrying out geometrical movements (13). Although several studies used the fastest speed of displacement possible (12, 14), other studies did not take the speed of displacement into account (10, 11, 13). In addition, some tasks were performed without any constraints, whereas others were performed by applying assistance or constraints to the subjects (16, 17). Furthermore, kinematic assessments were performed in 2 spatial dimensions (2D) (10, 11, 13, 15, 16) or 3D (12, 14, 17). No study has clearly demonstrated which movements or instructions are the most relevant.
The sensitivity of kinematic indices and specific tasks to detect impairments has been studied only by comparing patients who received RAT with patients who did not receive RAT (10, 12). Interestingly, no study has compared kinematic indices between age-matched healthy subjects and stroke patients using a distal effector without any assistance or constraint.
According to all the previous considerations, the present study aimed to use various tasks performed with ReaPLAN to compare kinematic indices in age-matched healthy subjects and stroke patients. ReaPLAN corresponds to a distal effector robotic device that allows displacements of the upper limb in the horizontal plane. This comparison could provide a synthetic, specific, objective and standardized protocol that includes the most relevant tasks and indices to assess upper limb impairment in stroke patients.
METHODS
Subjects
Twenty subjects participated in the study. The cohort consisted of healthy subjects (control group; n = 10) and stroke patients (stroke group; n = 10). Characteristics of patients and healthy subjects are described in Table I. Patient inclusion criteria were: preceding ischaemic and haemorrhagic stroke (no restriction of localization); minimal strength of muscles with a Medical Research Council (18) score above 2/5 in the proximal muscles (shoulder abduction, elbow flexion and elbow extension) to ensure that they were able to move the robot’s distal effector; and comprehension of the instructions. The exclusion criterion was the presence of any other previous significant orthopaedic or neurological condition that could alter active or passive movements of the upper limbs. In healthy subjects, the only exclusion criterion was the presence of a previous significant orthopaedic or neurological condition that could alter active or passive movements of the upper limbs. Both groups were matched for age and body mass index. Descriptions of patients’ neurological impairments (Stroke Impairment Assessment Set) (19) and activity limitations (ABILHAND) (20) are also shown in Table I. All subjects volunteered and participated freely in the study, which was approved by the local Ethics Board of the Faculty of Medicine.
| Table I. Characteristics of control (healthy subjects) and stroke groups |
| Characteristics | Stroke (n = 10) | Control (n = 10) |
| Gender, male/female, n | 7/3 | 6/4 |
| Age, years, mean (SD) | 71.6 (10.4) | 68.6 (8.7) |
| BMI, kg/m2, mean (SD) | 24.2 (2.2) | 26.8 (5.0) |
| Dominant arm, right/left, n | 10/0 | 9/1 |
| Affected arm, right/left, n | 4/6 | N/A |
| Post-stroke time, months, mean (SD) | 2.7 (1.8) | N/A |
| SIAS (1–76), median [IQR] | 63 [57–67] | N/A |
| ABILHAND, logits, mean (SD) | 0.46 (1.58) | N/A |
| For the age and BMI, there is no significant difference between groups (p > 0.05). SD: standard deviation; SIAS: Stroke Impairment Assessment Set; N/A: not applicable; IQR: interquartile range; BMI: body mass index. |
Apparatus
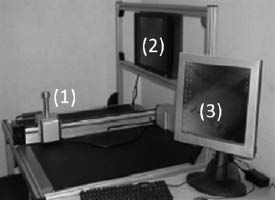
The robot used in the present study was the research prototype ReaPLAN (21), as illustrated in Fig. 1. The ReaPLAN comprises a distal effector that is held in the patient’s hand, which allows displacements in the horizontal plane resulting from various movements of the shoulder and elbow. If the patient had hand weakness, the hand was attached with an orthosis to the distal effector. In the present study, subjects only performed movements with ReaPLAN in the active mode. The active mode means that the subjects performed movements with no help from the robot. In addition, the mass and viscosity of the robotic device were at minimal levels to enable subjects to perform unconstrained movements. Moreover, the robot was provided with incremental position sensors (Maxon Motor®, Sachseln, Switzerland) to record distal effector trajectory in the X and Y planes as a function of time (acquisition frequency: 40 Hz). Assessments were made only in 2D conditions because of the design of the ReaPLAN conception.Placement of subjects
Fig. 1. View of the ReaPLAN robot. 1: distal effector; 2: visual interface of the subject; 3: physiotherapist’s interface.
Subjects were placed in an ergonomic and standardized sitting position. The angle between each subject’s hip and trunk was maintained at 120º to limit lumbar constraints. The subjects’ feet were on a footrest to stabilize them, and the trunk was secured to minimize movement compensations at this level. In addition, the distal effector was strictly centred in front of the subject.
Tasks
All 20 subjects performed 3 kinds of tasks with ReaPLAN at spontaneous speeds. The tasks, illustrated in Fig. 2, were presented to subjects via the subject’s visual interface (Fig. 1). Movements were performed by the affected arm in stroke patients and the dominant arm in healthy subjects.
For the first two tasks, the subjects performed large-amplitude movements and targeted movements. For the large-amplitude movements, the subjects made movements back and forth as far as they could in an indicated direction. For the targeted movements, the subjects made movements in the most precise and direct manner toward a specific target placed at a distance of 14 cm, similar to the method used by Daly et al. (10). Both tasks were performed in 3 directions: homolateral (on the side of the moving arm), contralateral (on the opposite side) and straight (in front of the subject). These directions enabled us to evaluate different movements of the shoulder and elbow and to determine whether a specific direction was more relevant than another.
For the third task, the subjects drew two types of geometrical shapes: a square with 25-cm sides, and a circle with a 12.5-cm radius.
The experiment began with a training phase, which took approximately 20 min. The training phase, which was not recorded, was used to limit learning bias. In the acquisition phase, the order of execution of tasks was assigned randomly, and each task was performed 5 consecutive times (corresponding to 5 consecutive cycles of movement). The rest between each task was 5 min. Subjects’ results were recorded in the acquisition phase.
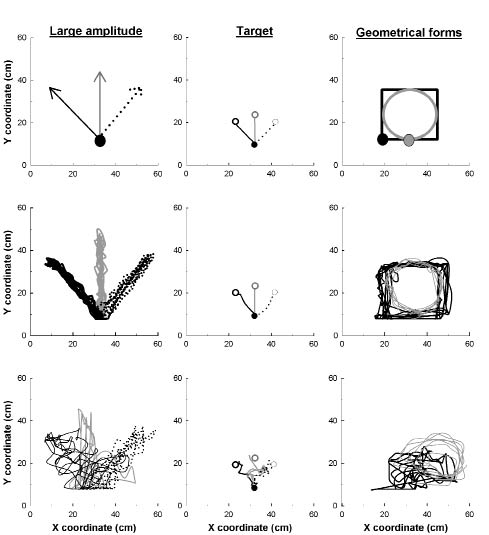
Fig. 2. Instructions presented on the visual interface (upper graphs) and the tasks performed by a healthy subject (middle graphs) and a patient (lower graphs). For large amplitude and geometrical movements, 5 goings and comings are presented (middle and lower graphs) for each movement (i.e. direction or form). For targeted movements, 1 going is presented (middle and lower graph) for each direction. For large amplitude and targeted movements, solid and dashed black lines correspond to homolateral and contralateral directions of the moving arm. The grey line corresponds to the straight direction. For the geometrical movements, black and grey points were the start point of the square and the circle, respectively. The square had sides 25 cm long and the circle had a radius of 12.5 cm.
Kinematic analyses
For each task, the X and Y coordinates of the distal effector were acquired as a function of time. These variables were analysed for each task by a specific customized program created in the LabWindows/CVI (8.5) environment.
For large-amplitude movements the following factors were analysed: the amplitude, the standard deviation of the mean amplitude (SDampl), straightness, speed, the standard deviation of the mean speed (SDspeed), peak speed and smoothness indices. For the targeted movements, the target accuracy and the straightness indices were analysed. Each of these indices was analysed during 5 consecutive cycles and the mean calculated. These indices are described below.
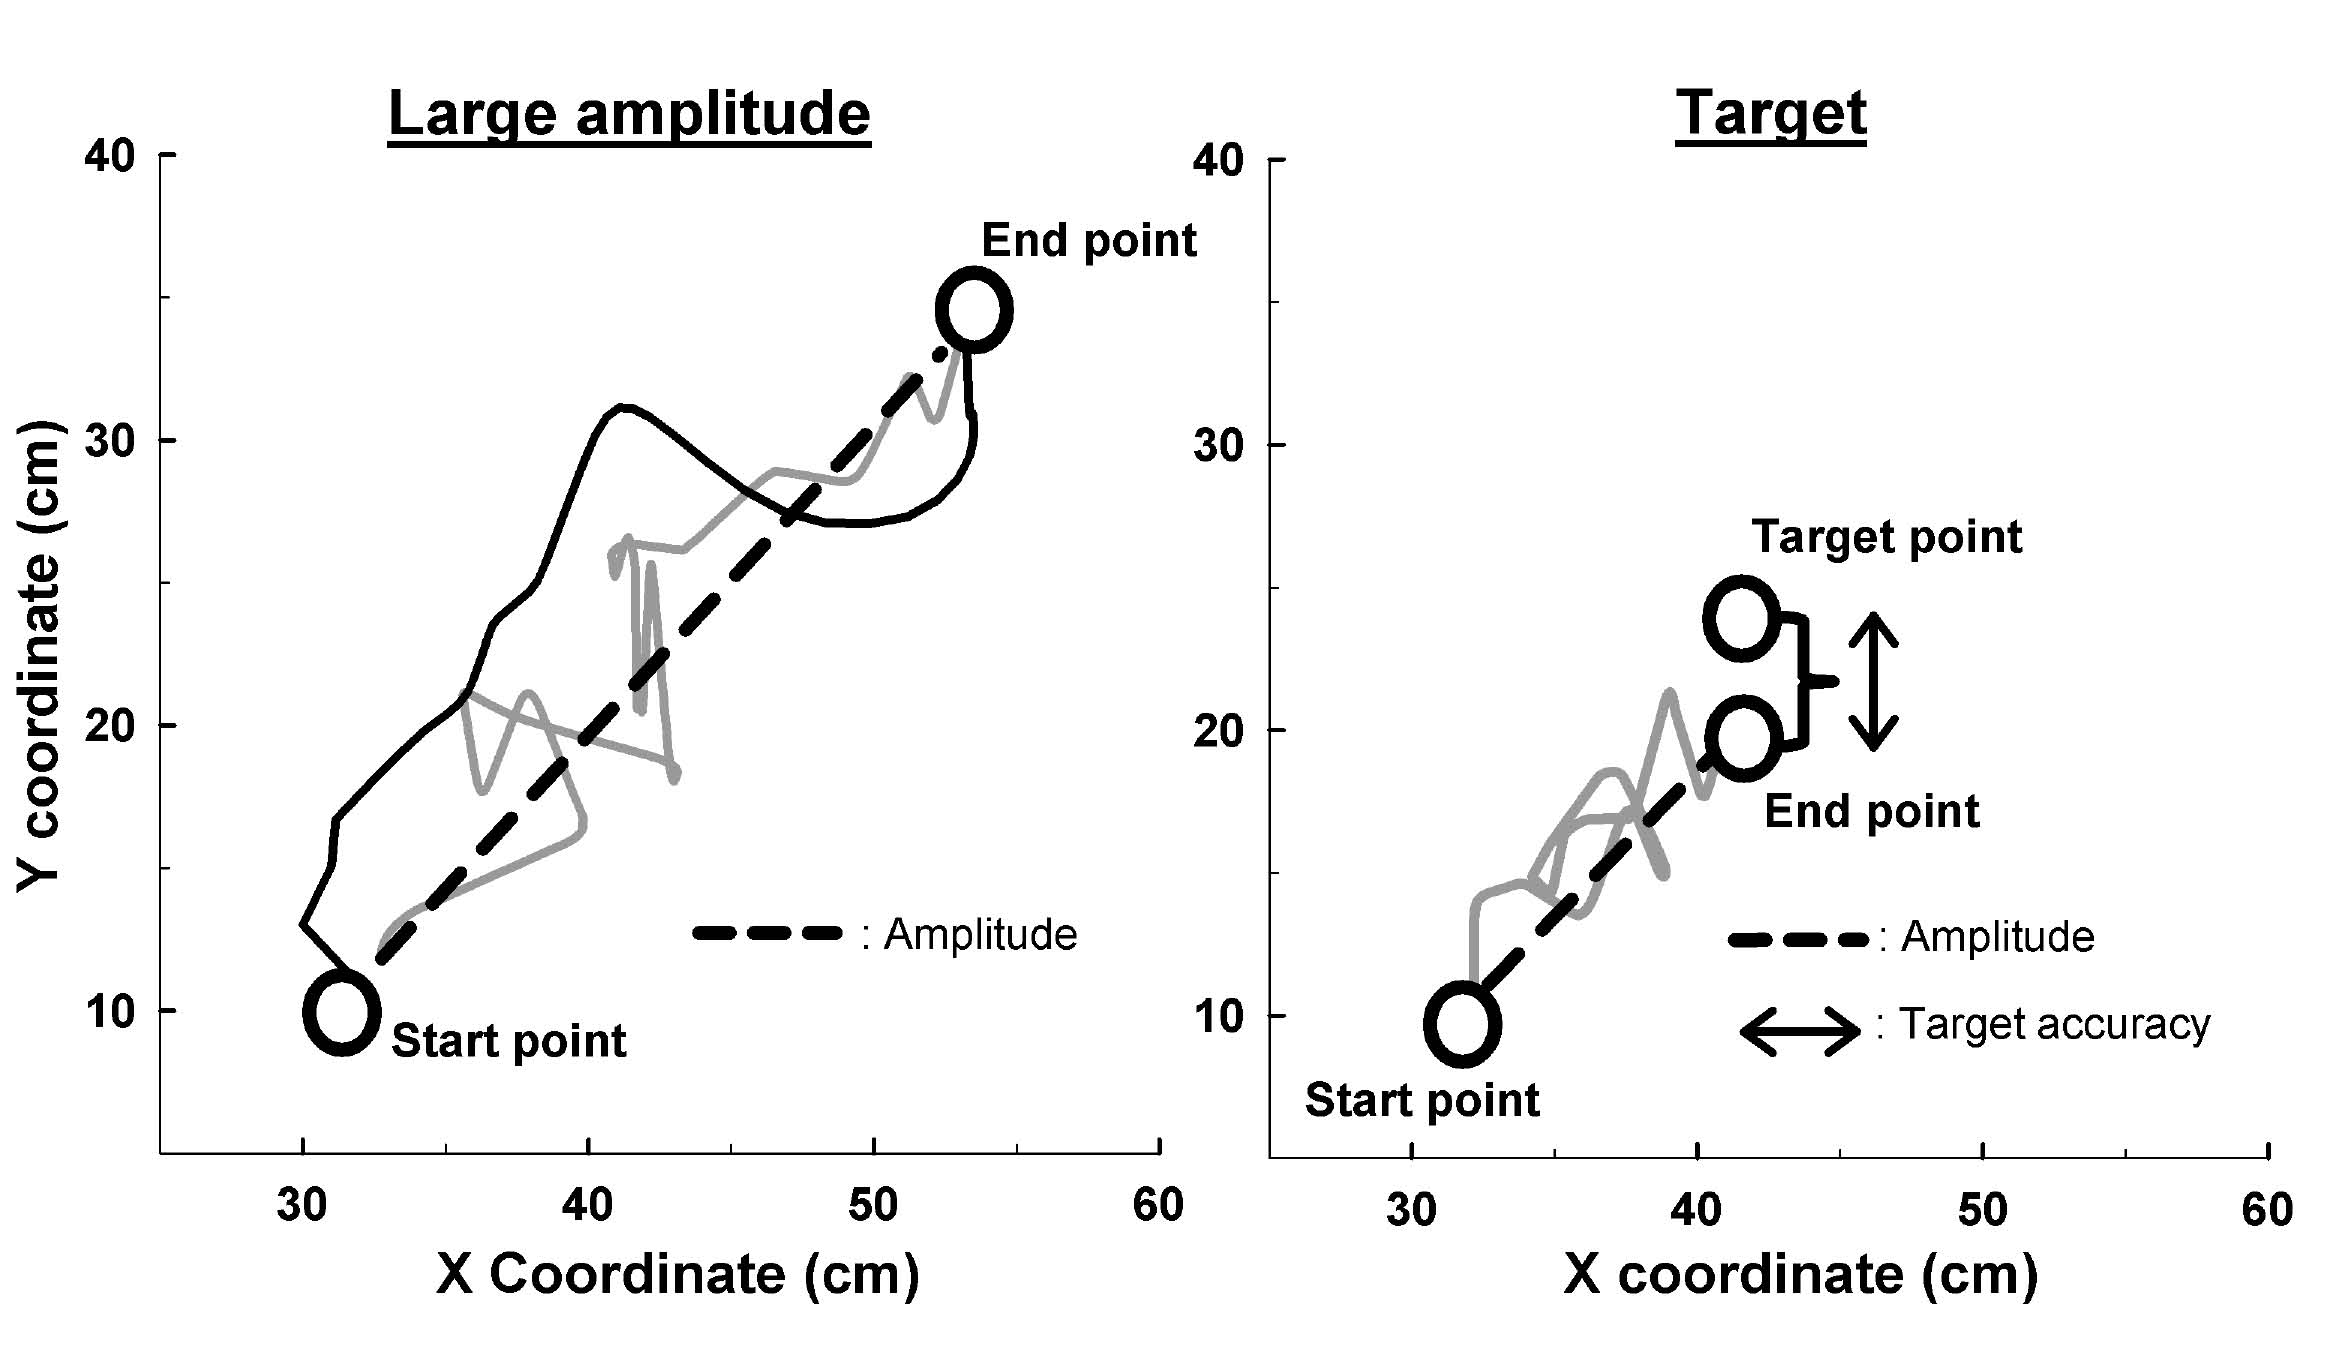
The amplitude (in cm) corresponds to the shortest distance between the starting point and the farthest point reached (Fig. 3). The SDampl (in cm) was used as an index of the amplitude variation during the 5 cycles of movement (the lower the index, the more constant the amplitude). The straightness corresponds to the amplitude divided by the path length covered by the subject. Ratios closer to 1 indicate more rectilinear paths, whereas ratios closer to 0 indicate longer paths to realize the movement (Fig. 3). The speed (in cm/s) corresponds to the ratio between the path length and the elapsed time. The SDspeed (in cm/s) was used as an index of the speed variation during the 5 cycles of movement (the lower the index, the more constant the speed). The peak speed (in cm/s) corresponds to the maximum speed. The smoothness corresponds to the ratio between the speed and the peak speed (ratios closer to 0 indicate less smooth movements) (15). The target accuracy (in cm) corresponds to the distance between the target position the subject had to reach and the end position achieved by the subject (Fig. 3). For this measure, higher scores indicate more inaccurate movements.
Fig. 3. Calculation of kinematic indices in large amplitude and targeted movements. The grey solid line corresponds to the going movement (left and right graphs), and the black solid line corresponds to the coming movement (left graph). For the two tasks, the amplitude corresponds to the distance between the start point and the end point. For the movement of large amplitude, the straightness corresponds to the ratio between the double of the amplitude (because of the going and coming) and the path length covered by the subject (grey and black solid lines). For the targeted movement, the straightness corresponds to the ratio between the amplitude and the path length covered by the subject (grey solid line). The target accuracy corresponds to the distance between the end point and the target point.
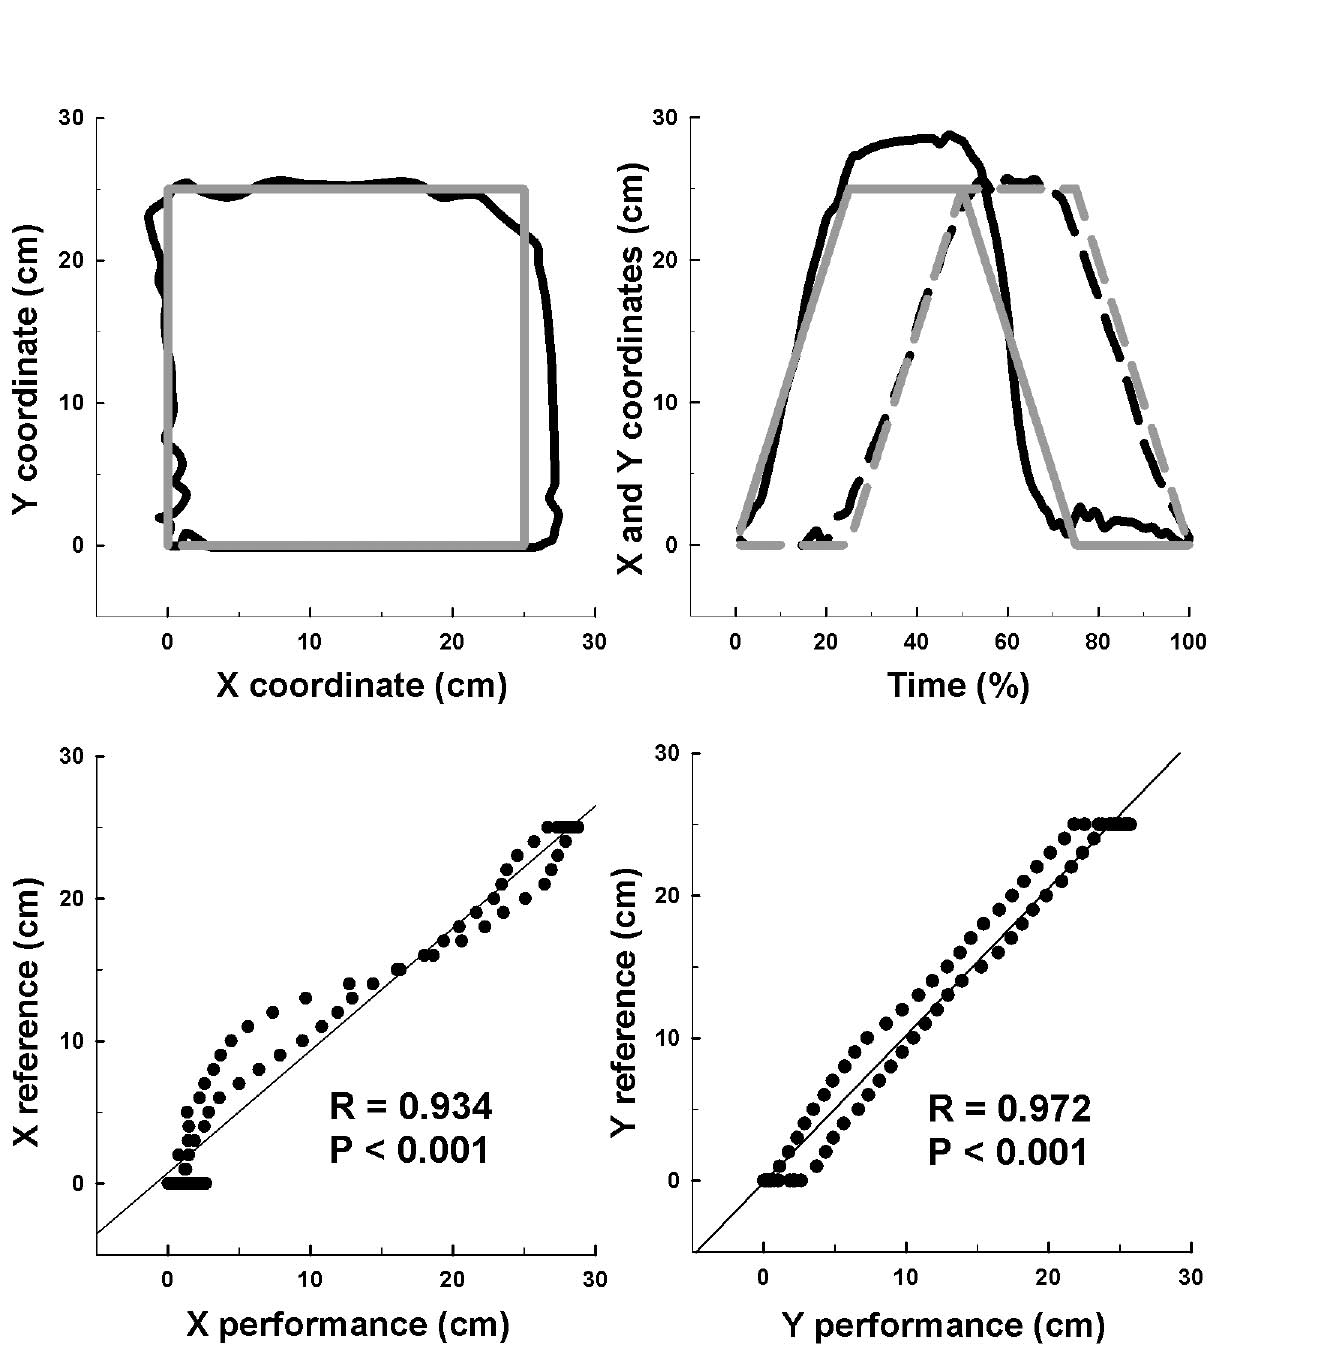
For the geometrical movements, the goal was to quantify the ability of the subjects to draw a square or a circle. The X and Y coordinates acquired during 5 consecutive cycles were normalized to 100% as a function of time, and these values were called Performances (Fig. 4). These X and Y Performances were compared with X and Y reference shapes (called References) using a correlation test (Fig. 4). These References correspond to the normalized X and Y coordinates of a perfect square (with 25-cm sides) and a perfect circle (of 12.5-cm radius). Correlation coefficients closer to one indicate that the subject was capable of drawing the requested shape.
Fig. 4. Kinematic analysis of geometrical movements. The upper graphs illustrate the normalized square performed by one subject (black line) and the square of the reference (grey line). The left-upper graph illustrates the presentation of these squares on the visual interface. The right-upper graph illustrates evolutions of X (continuous line) and Y (discontinuous line) coordinates as a function of time (%). The lower graphs illustrate the Pearson’s correlation test between Performances (i.e. subject’s square) and References (i.e. square of reference) for X (left-lower graph) and Y (right-lower graph) coordinates. R: coefficient correlation; p: significant relationship between Performance and Reference.
Statistical analyses
For the first two tasks (i.e. large-amplitude and targeted movements), a 2-way analysis of variance (ANOVA) (groups (healthy vs stroke) and directions (homolateral, contralateral and straight)) was performed for each kinematic index using SigmaStat 3.5 software (WPCubed GmbH, Munich, Germany). A Bonferroni-adjusted post hoc (Holm Sidak) test was used to analyse differences between groups.
For the third task (i.e. geometrical movements), we performed a Pearson’s correlation test between Performances and References for each shape (square and circle) and coordinate (X and Y). We also performed a 2-way ANOVA (groups (healthy vs stroke) and shapes (square and circle)) for each coordinate (X and Y) using SigmaStat 3.5 software. A Bonferroni-adjusted post hoc (Holm Sidak) test was used to analyse differences between groups.
Homoscedasticity (normal distribution and equality of variance) was verified for all comparisons, and the accepted significance level was 0.05.
RESULTS
One patient, who had the lowest Stroke Impairment Assessment Set (SIAS) score (i.e. 49/76), was excluded from the analysis because he was unable to perform all of the tasks. Typical traces of the 3 tasks performed by one healthy subject and one patient are shown in Fig. 2. The mean (SD) values for each group (control vs stroke) and for each separate movement (i.e. directions or shapes) are shown in Table II. Fig. 5 shows the results for each group for all merged movements.
| Table II. For the 3 tasks, results of the kinematic indices in control and stroke groups |
| | Homolateral | Contralateral | Straight |
| Control (n = 10) | Stroke (n = 9) | Control (n = 10) | Stroke (n = 9) | Control (n = 10) | Stroke (n = 9) |
| Large-amplitude | | | | | | |
| Amplitude (cm) | 35.6 (6.2) | 35.1 (6.2) | 32.6 (4.9) | 34.0 (8.3) | 33.0 (6.8) | 30.8 (8.9) |
| SDampl (cm) | 2.6 (1.4) | 4.0 (2.1) | 2.5 (0.84) | 3.9 (1.03) | 1.7 (0.8) | 3.6 (2.1) |
| Straightness | 0.97 (0.02) | 0.86 (0.09) | 0.97 (0.02) | 0.84 (0.13) | 0.98 (0.02) | 0.89 (0.12) |
| Speed (cm/s) | 26.4 (14.1) | 22.3 (12.3) | 22.6 (10.6) | 20.0 (11.5) | 20.0 (8.8) | 16.4 (6.6) |
| SDspeed (cm/s) | 14.6 (9.6) | 16.0 (7.3) | 12.6 (6.3) | 14.9 (7.6) | 14.6 (6.8) | 14.5 (4.9) |
| Peak speed (cm/s) | 49.2 (25.8) | 56.4 (18.5) | 42.6 (19.2) | 51.5 (19.6) | 42.6 (17.6) | 45.0 (13.2) |
| Smoothness | 0.53 (0.06) | 0.39 (0.13) | 0.53 (0.04) | 0.38 (0.11) | 0.47 (0.04) | 0.36 (0.08) |
| Target | | | | | | |
| Target accuracy (cm) | 1.4 (1.1) | 2.4 (1.5) | 2.7 (0.8) | 2.4 (1.4) | 0.6 (0.3) | 1.4 (1.9) |
| Straightness | 0.92 (0.12) | 0.61 (0.11) | 0.92 (0.07) | 0.57 (0.14) | 0.95 (0.07) | 0.77 (0.20) |
| | Square | Circle | |
| Control (n = 10) | Stroke (n = 9) | Control (n = 10) | Stroke (n = 9) |
| Geometrical forms | | | | | | |
| X correlation | 0.94 (0.05) | 0.72 (0.39) | 0.95 (0.07) | 0.69 (0.31) | | |
| Y correlation | 0.95 (0.05) | 0.77 (0.31) | 0.96 (0.03) | 0.75 (0.18) | | |
| SD: standard deviation. |
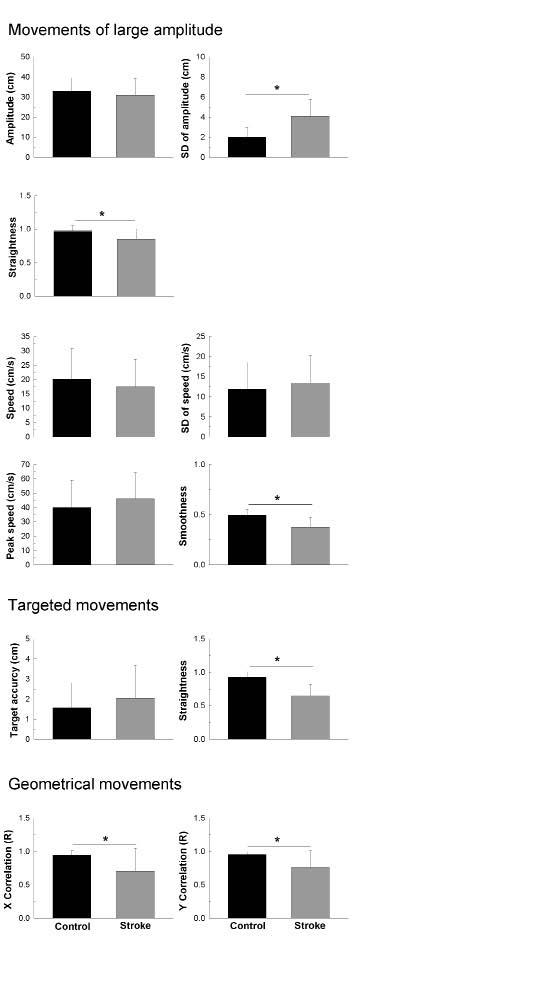
Fig. 5. Results of the Bonferroni-adjusted post hoc (Holm Sidak) tests comparing control and stroke groups in studied indices. *Significant difference (p < 0.01) between the two groups.
Interaction between groups and movements
For each kinematic index in the 3 tasks, the two-way ANOVA did not reveal any interaction (p > 0.05) between the groups and the movements (i.e. directions or shapes).
Comparison between groups
For the large-amplitude movements, the amplitude was not significantly different between groups (p > 0.05); however, stroke patients had more difficulty reaching constant amplitude at each cycle of movement (p <0.001). Indeed, the SDampl value was approximately two times greater in the stroke group. Furthermore, the path length was less rectilinear in the stroke group (p < 0.001) (i.e. the straightness ratio was 13% lower in the stroke group). The speed was not significantly different between groups (p > 0.05), and the SDspeed showed that the stroke patients were able to maintain a constant speed similar to the healthy subjects (p > 0.05). Interestingly, movements of stroke patients were less smooth than those of healthy subjects (p < 0.001). Indeed, the smoothness ratio was 12% lower in the stroke group.
For the targeted movements, the target accuracy was not significantly different between groups (p > 0.05). The path length, however, was less rectilinear in the stroke group (p < 0.001). Indeed, the straightness ratio was 27% lower in the stroke group.
For the geometrical movements, stroke patients had significantly more trouble drawing the requested shape than the healthy subjects (p < 0.01). Indeed, the X and Y correlation indices were 24% and 19% lower, respectively, in the stroke group.
DISCUSSION
This study presented a lot of kinematic indices, which were obtained with a distal effector robotic device in stroke patients and healthy matched subjects. By choosing the most relevant indices, we attempted to establish an objective, standardized protocol to assess upper limb impairments in stroke patients.
Elaboration of the standardized protocol
For the large-amplitude movements, our results showed that the amplitude, speed, SDspeed and peak speed could be rejected because they were similar in patients and healthy subjects. The amplitude rejection was surprising because Khan et al. (12) and Reikensmeyer et al. (14) observed that this index was improved after rehabilitation. Thus, we hypothesized that this index was altered before treatment. The rejection could have 2 explanations. First, the stroke patients in the present study had moderate to minor impairments, as shown by high SIAS values in Table I (this was not the case in the previous studies). Secondly, movements were carried out at spontaneous speeds in the present study and at maximum speed in the studies by Khan et al. (12) and Reikensmeyer et al. (14). This last protocol (i.e. maximum speed) could limit the reaching amplitude by increasing spasticity (22).
For the large-amplitude movements, the results showed that SDampl, straightness and smoothness should be retained because they were different in patients and healthy subjects. Interestingly, SDampl is an original index that has not been used before, whereas the straightness index was calculated with the same method as used by Khan et al. (12), but has never been used with a distal effector robotic system. Although the smoothness can be calculated in various ways (10, 11, 13, 15), our method was in agreement with Finley et al. (11) and Rohrer et al. (15), who described smoothness as a relevant index in assessing stroke patients.
For the targeted movements, our results showed that the index of target accuracy could be rejected and that the straightness should be retained (for the reasons detailed above). This result was not in agreement with Daly et al. (10), who used target accuracy in patient assessments. The difference could be due to the fact that the stroke patients in the Daly et al. (10) study had severe impairments. The present results suggested that stroke patients with moderate to minor impairments could reach targets similarly to healthy subjects, but they took longer to point out the target.
For these two first tasks, contrary to Finley et al. (11), but similar to Daly et al. (10), only one direction (i.e. homolateral) of movement was retained. This choice could be for 3 reasons. First, the present results did not reveal any interaction between groups and directions, which means that all directions have the same relevance. Secondly, preserving only one direction could limit the exhaustion bias and assessment time. Lastly, we suggest retaining the homolateral rather than the contralateral direction because the homolateral direction combines flexion and abduction of the shoulder and extension of the elbow, which allows movements away from primitive motor synergies (23).
For the geometrical movements, our results showed that the X and Y correlation indices should be retained. Although geometrical movements have been analysed in various ways (13, 16, 17, 24), the present study was the first to use a simple index to evaluate the capacity to draw a perfect circle or a perfect square in a free, unconstrained mode.
We propose that the two geometrical shapes should be retained. Although the two-way ANOVA did not reveal any interaction between groups and shapes, we hypothesized that both shapes could assess various aspects of coordination. The square involves sharp changes in direction, which require quick changes in the control of agonist and antagonist muscles, whereas the circle involves high regularity in movements, which requires a continued adaptation in the control of agonist and antagonist muscles. Further studies must be carried out to determine if treatments could improve these specific movements.
The standardized protocol should include specific indices (SDampl, straightness, smoothness, X and Y correlations) obtained from 4 movements (i.e. homolateral large-amplitude and targeted movements and square and circle movements).
A correlation study between our kinematic and clinical scores did not reveal any significant relationship (p > 0.05). However, the sample of patients is small and the “Stroke Impairment Assessment Set” scale is not a specific motor impairment scale that could enable us to perform these correlation studies. Then, as already performed by Bosecker et al. (25) with MIT-Manus, further correlation studies between our protocol and other clinical scales (e.g. Fugl-Meyer) should be carried out in larger samples of patients, to determine if the protocol reflects the amount of upper arm motor impairment. Moreover, further studies will assess the complete validity of this protocol, and the variability of results in the dominant and non-dominant hand. Finally, the effect of specific treatments will be assessed with this protocol.
Advantages of this study
The ReaPLAN robotic device could easily be used for all stroke patients in routine assessments. Indeed, patients could easily be placed in an ergonomic and standardized sitting position, and the protocol appears to be able to detect abnormalities in stroke patients compared with age-matched healthy subjects. In addition, therapists and researchers could easily and quickly use the specific customized program.
Although the ReaPLAN is more limited than other systems in terms of degrees of freedom (26–31), it permits a quantitative assessment of stroke patients that could easily be used in further randomized controlled trials (RCTs) or in daily clinical assessments.
The present study was the first to compare kinematic indices (in a free, unconstrained mode) of tasks performed with an effector distal robot by stroke patients and age-matched healthy subjects.
Limitations
There were several limitations to the present study. First, the results must be interpreted with care since they could be affected by the small sample and the moderate-to-light impairments of patients. Future studies are necessary to confirm our results. However, most differences shown by our indices were highly significant (p < 0.001; statistical power = 1). Secondly, kinematic indices could have a floor effect. Indeed, one patient was excluded from the study analysis because he was too weak to perform all of the tasks. In agreement with Sivan et al. (9), we believe that kinematic indices could be a complement to the Fugl-Meyer test, which has a ceiling effect (32). However, further studies are necessary to adapt this protocol with an assistance model in order to apply kinematics to more severely impaired patients. Lastly, further studies are necessary to evaluate the reliability and responsiveness of our protocol. Indeed, Wagner et al. (33) proved the intra-examiner reliability and the responsiveness of some kinematic indices that have been evaluated in simple forward-reaching tasks with an optical tracking system. No study, however, has examined the reliability and responsiveness of the kinematic indices for the measurement of upper limb functions with a robotic device (9).
In conclusion, this preliminary study proposes a new standardized, objective protocol to assess upper limb impairments in stroke patients, which will enable us to realize a larger study that will analyse intra- and inter-examiner reliability and responsiveness of this protocol. In future RCTs, researchers will be able to use our tool to objectify upper limb impairments before and after stroke patients’ treatments with RAT.
Acknowledgements
This work was supported by the Saint-Luc Foundation. The authors would like to thank all the subjects for their participation in this study.
REFERENCES