
From the 1Department of Neurobiology, Care Sciences and Society, Karolinska Institutet, and Function Area Occupational Therapy & Physiotherapy, Karolinska University Hospital, Stockholm, Sweden, 2Faculty of Medicine and Health Sciences, Centre de recherché Charles Le-Moyne, Université de Sherbrooke, Sherbrooke, and 3Faculty of Medicine, Rehabilitation (Physiotherapy) and Radiology/Nuclear Medicine Department, Université Laval, Québec City, Québec, Canada
Objective: To assess changes and responsiveness in outcome measures of mobility, balance, muscle strength and manual dexterity in adults with myotonic dystrophy type 1.
Design: A 9-year longitudinal study conducted with 113 patients.
Methods: The responsiveness of the Timed Up and Go test, Berg Balance Scale, quantitative muscle testing, grip and pinch-grip strength, and Purdue Pegboard Test was assessed using criterion and construct approaches. Patient-reported perceived changes (worse/stable) in balance, walking, lower-limb weakness, stair-climbing and hand weakness were used as criteria. Predefined hypotheses about expected area under the receiver operating characteristic curves (criterion approach) and correlations between relative changes (construct approach) were explored.
Results: The direction and magnitude of median changes in outcome measures corresponded with patient-reported changes. Median changes in the Timed Up and Go test, grip strength, pinch-grip strength and Purdue Pegboard Test did not, in general, exceed known measurement errors. Most criterion (72%) and construct (70%) approach hypotheses were supported. Promising responsiveness was found for outcome measures of mobility, balance and muscle strength. Grip strength and manual dexterity measures showed poorer responsiveness.
Conclusion: The performance-based outcome measures captured changes over the 9-year period and responsiveness was promising. Knowledge of measurement errors is needed to interpret the meaning of these longitudinal changes.
Key words: myotonic dystrophy; psychometrics; rehabilitation; responsiveness; outcome measures.
Accepted Nov 8, 2017; Epub ahead of print Dec 20, 2017
J Rehabil Med 2018; 50: 00–00
Correspondence address: Marie Kierkegaard, Function Area Occupational Therapy & Physiotherapy, A6: U1 Karolinska University Hospital, SE-171 76, Stockholm, Sweden. E-mail: marie.kierkegaard@sll.se, marie.kierkegaard@ki.se
Myotonic dystrophy type 1 (DM1) is a slowly progressive, inherited, neuromuscular disease characterized by muscle weakness and myotonia. Besides impairments in muscle function, other body functions and structures are affected, and DM1 is therefore recognized as a multi-system disorder. Clinical phenotypes of DM1 can be described based on age at onset, symptoms, and the unstable expansion of trinucleotide (CTG) repeats causing the disease (1). In the adult-onset phenotype, clinical signs generally appear between the ages of 20 and 40 years, whereas the late-onset phenotype appears at an older age (>40 years) with fewer and milder symptoms.
No curative treatment is currently available for DM1, although potential treatments are being developed (2). Concerns have been raised about outcome measures with good measurement properties to assess the effects of interventions (3). Outcome measures that reflect mobility, balance, muscle strength and manual dexterity will be needed to assess endpoints in future trials. There is a lack of knowledge, however, of the measurement properties, especially concerning responsiveness, of such measures in the DM1 population (4).
Responsiveness can be defined as “the ability of an instrument to detect change over time in the construct to be measured” (5), and thus refers to the validity of a change score (6). Two different approaches are proposed for the assessment of responsiveness. The criterion approach is used if a gold standard is available, e.g. a global rating scale capturing the impression of change in the construct of interest (7). A priori hypotheses should be made about the direction and strength of the relationship between changes in the criterion and changes in the outcome measures. Such relationships can, if the criterion is a dichotomous variable, be assessed with receiver operating characteristic (ROC) curve analyses. The size of the area under the curve (AUC) in ROC analyses indicates the ability of the outcome measure to distinguish between those who have/have not changed according to the criterion (7). The construct approach relies on hypothesis testing about expected directions and magnitudes of correlations between change scores in outcome measures measuring similar or different constructs (7). It is important that there is a rationale for these a priori formulated hypotheses, e.g. previous research findings and/or clinical experience.
A longitudinal natural-history study of functioning, disability and health in people with the adult-onset and late-onset phenotypes of DM1 was initiated in 2002 at the Saguenay Neuromuscular Clinic (Quebec, Canada), providing an opportunity to explore the responsiveness of various outcome measures. Thus, the aims of the present study were to describe and assess changes and responsiveness in outcome measures for mobility, balance, muscle strength and manual dexterity in adults with DM1.
Adults with a genetically DNA-confirmed diagnosis of DM1 and presenting with the adult-onset or late-onset phenotype were recruited from the Saguenay Neuromuscular Clinic (Quebec, Canada). As part of a funded longitudinal study, 200 patients with DM1 were included at baseline (T1) (8–18) and were invited to attend a follow-up 9 years later (T2) (19–20). At T2 59 of the 200 patients had died, 8 had left the region, 4 were excluded due to severe cognitive impairment, and 14 declined to participate (for personal reasons or lack of interest). Thus, 115 patients with DM1 were included at T2 (i.e. 58% of participants from T1). All patients provided signed informed consent before enrolment at both baseline and follow-up.
The same procedures for assessments were used at both time-points. One physiotherapist assessed all patients at T1 and 2 others performed the assessments at T2. All assessors had received formal training in the administration of the outcome measures. Study-specific global rating of change scales (GRSs) were administered by 1 of 3 nurses at T2. The longitudinal study was approved by the Ethics Review Board of the Centre Intégré Universitaire de Santé et de Services Sociaux du Saguenay-Lac-St-Jean (Quebec, Canada) and procedures were conducted in accordance with the Declaration of Helsinki.
For descriptive purposes data on sex, age, phenotype and muscular impairments were collected. The latter were assessed with the DM1-specific muscular impairment rating scale (MIRS) which is a 5-graded scale ranging from no muscular impairment (grade 1) to severe proximal weakness (grade 5) (21). Mild muscular impairment was defined as MIRS grades 1–3 and severe as MIRS grades 4–5.
The Timed Up and Go (TUG) test was used for assessing mobility and balance (22). Following standardized instructions, the time taken to stand up from a chair, walk 3 m, turn, walk back and then sit down, was recorded. Patients were instructed to walk at their preferred self-selected speed. They performed 3 trials, and data from the second trial were used in the analyses in accordance with the original test administration (22). The measurement error, i.e. the standard error of measurement (SEM) and smallest detectable change (SDC) of TUG in DM1 are reportedly 0.7 and 1.9 s, respectively (23).
The Berg Balance Scale (BBS) was used for assessing balance (24). Following standardized instructions, the performance of 14 tasks of varying difficulty was assessed and scored on a 5-graded ordinal scale. A sum score, which can range from 0 to 56 points, was calculated, higher scores indicating better performance/balance. Measurement error of the BBS in the DM1 population is unknown as there are no published reliability studies.
Quantitative muscle testing (QMT) was performed to assess maximal isometric muscle strength using make tests with a calibrated handheld dynamometer (Microfet – 2, Hoggan Health Industries, Salt Lake City, UT, USA). Following a standardized protocol (18) maximal isometric contractions of 4 lower-limb muscle groups, i.e. hip flexors, knee extensors, knee flexors and ankle dorsiflexors of the right and left legs, were assessed. The length of the corresponding lever arm (in m) between the point of application of the dynamometer and the relevant joint centre was measured in order to calculate the maximal isometric torque in Newton-metres (Nm). Two trials were performed for each muscle group, unless they differed more than 10%, in which case a third trial was performed. The mean of the 2 trials (or the 2 nearest trials if 3 trials were made) was calculated for each muscle group and side. To reduce the number of explored variables, the mean of both sides for each muscle group was then calculated. In addition, a lower-limb composite score was created to take into account that each muscle group contributes to a certain extent to each related criterion used in the assessment of responsiveness. The lower-limb composite score was calculated by adding the scores from each muscle group and side, thus representing a lower-limb total muscle force (25). There are no test–retest reliability studies on maximal isometric lower-limb muscle strength using make tests with the Microfet – 2 in DM1. Thus, the measurement errors are unknown.
A Jamar™ dynamometer (Sammons Preston, Chicago, IL, USA) was used for assessing grip strength. Following standardized procedures (26) the maximal grip score, in kg, was recorded. Participants performed 3 trials with each hand. The mean score of all trials was calculated and used in analyses. For right and left hand together, the SEM and SDC for maximal grip strength in DM1, measured with the Grippit®, are reportedly 1.4 and 3.8 kg, respectively (27).
A B&L pinch gauge (B&L Engineering, Tustin, CA, USA) was used to assess pinch-grip strength. Following standardized procedures (26) the maximal pinch-grip score, in kg, was recorded. Participants performed 3 trials with each hand. The mean score of all trials was calculated and used in analyses. For right and left hands together, the SEM and SDC for maximal pinch-grip strength in DM1, measured with the Grippit®, are reportedly 0.7 kg and 1.9 kg, respectively (27).
The Purdue Pegboard Test (PPT) (model 32020, Lafayette Instrument Co., Lafayette, IN, USA) was used for assessing manual dexterity. Following standardized instructions (28), the number of pegs placed on the pegboard in 30 s was recorded for right and left hands, respectively. The participant performed 2 trials with each hand. The mean score of all trials was calculated and used in analyses. For right and left hands together, the SEM and SDC of PPT in DM1 are reportedly 0.7 and 1.9 pegs, respectively (27).
Study-specific GRSs were used to collect information on perceived changes in recent years in balance, walking, lower-limb weakness, stair-climbing and hand weakness. Patients rated their perceived change on 5-graded scales, ranging from a lot worse to a lot better.
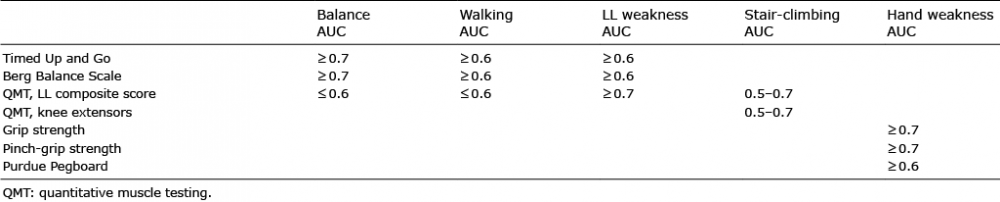
Patients’ answers on the 5-graded GRSs were dichotomized into stable or worse and used as criteria. For each outcome 1–3 patients (1–3%) were excluded, as they reported a change for the better and it was not possible to create a distinct group for analysis. The GRSs on perceived change in balance, walking and lower-limb weakness were regarded by the research team as capturing similar constructs as measured with TUG, BBS and QMT lower-limb composite score. The stair-climbing GRS was considered to reflect a similar construct to that captured by the QMT lower-limb composite score and QMT knee extensor strength. The hand weakness GRS was regarded as reflecting a construct similar to that captured by the outcome measures for manual dexterity and grip strength. We made a priori hypotheses about AUCs for change scores (Table I) in the various outcome measures to distinguish patients who had become worse according to the criterion, i.e. their answers on the GRSs We also hypothesized that the AUC for change in BBS would be greater than for change in TUG concerning those worse in balance, and vice versa for walking. These hypotheses were based on published literature (25, 29–31) and clinical experience.
Table I. Criterion approach hypotheses about size of the area under curve (AUC) to distinguish patients who had changed to the worse according to the criteria, i.e. their answers on the global rating of change scales in balance, walking, lower-limb (LL) weakness, stair-climbing and hand weakness
The research team considered TUG and BBS to measure similar constructs, i.e. mobility and balance, and that relative changes in these outcome measures should therefore be at least moderately correlated (r ≥0.6). Although lower-limb muscle strength is important for mobility and balance, relative changes in the composite score were thought to correlate less than moderately (r ≤0.4) with relative changes in TUG and BBS. It was further hypothesized that correlations between relative changes in TUG and BBS and relative changes in QMT measures would be greatest with changes in QMT knee extensor strength, followed by QMT foot dorsiflexor strength. Manual dexterity, as measured with PPT, and grip strength measures, were considered to capture slightly diverging constructs, and thus correlations between relative changes would be less than moderate (r ≤0.4). Grip and pinch-grip strength measures were considered to capture a similar construct, and relative changes in these outcome measures would thereby be highly correlated (r ≥0.7). Hypotheses were based on published literature (25, 29–31) and clinical experience.
Descriptive statistics were used to present the data. Median values were chosen, since not all data were normally distributed. Change scores in the various outcome measures were calculated by subtracting T1 scores from T2 scores, except for TUG, where T2 scores were subtracted from T1 scores. Thus, negative change scores indicated deterioration. Changes were expressed in absolute (s, points, Nm, pegs and kg) and relative (percentage) values.
Responsiveness was evaluated both with a criterion approach and a construct approach (5, 7). Descriptive statistics and ROC curve analyses with calculations of AUCs were used for the criterion approach. A priori hypotheses were made as specified above in the rationale for the criterion approach. Spearman’s correlation analyses were used for the construct approach. The correlations between relative changes in outcome measures were hypothesized to be in the positive direction and the magnitudes to be as stipulated above in the rationale for the construct approach. All analyses were performed using SPSS software (version 22).
Two of the 115 patients were excluded; one due to inability to perform the physical tests, and the other when data analyses showed that this patient was a severe outlier in all QMT measures (showing improvement) and, at the same time, reported changes for the worse in all GRSs, thereby having a major inappropriate effect on the results. Thus, 71 women and 42 men were included. Mean age at follow-up was 52 years (range 29–85 years). Eighty-nine (79%) patients had adult-onset phenotype and 24 (21%) late-onset. At baseline, 47 (42%) patients were classified as having mild muscular impairment, i.e. MIRS grades 1–3, and at the follow-up 9 years later 29 patients were so classified (26%). Statistical analyses (independent t-tests and χ2 tests) of T1 baseline data between the 113 participants in the study and the 87 lost to follow-up/excluded showed no significant differences in phenotype, number of CTG repeats or sex. However, there were significant between-group differences in age and MIRS classification. Participants lost to follow-up were a mean of 8 years older at T1 and fewer were classified as MIRS 1–3.
Results of outcome measures at T1 and T2, and absolute and relative changes, are presented in Table II. Due to transport problems 7 patients were not evaluated at the neuromuscular clinic at T2, and thus lack TUG, BBS and QMT data. The BBS was added after the start of T1 and 30 patients were therefore not assessed with the scale. Other missing data in the various outcome measures are due to patients’ incapacity to perform the tests due to severe muscle impairment. All but 2 outcome measures (TUG, QMT hip flexors), showed a median deterioration over time. A ceiling effect was found for BBS at both T1 and T2, where 59% and 41%, respectively, had the maximum score of 56.
Table II. Results from outcome measures at baseline (T1) and the 9-year follow-up (T2)
Data were missing from 3–7 patients in the GRS (Fig. 1). Between 42% and 62% of the patients who answered the GRSs had experienced a change for the worse (Fig. 1). A majority of those who perceived themselves as stable had the late-onset phenotype.
Fig. 1. Percentage of patients reporting being stable and worse on the global rating of change scales in balance, walking, lower-limb weakness, stair-climbing and hand weakness.
The direction and magnitude of median absolute and relative changes in the various outcome measures were, in general, in line with patients’ self-reported changes in balance, walking, lower-limb weakness, stair-climbing and hand weakness (Tables III and IV, Figs 2 and 3). The median changes in TUG, grip strength, pinch-grip strength, and PPT for those a little/a lot worse in the various GRS did not, in general, exceed the measurement errors, i.e. reported SDCs. Most (72%) a priori criterion-approach hypotheses concerning AUCs were confirmed (Table V). However, the AUC for change in BBS was not greater than for change in TUG concerning balance, and there was no difference in AUCs between the outcome measures concerning walking. As shown by the AUCs, TUG, BBS and relative QMT measures could satisfactorily discriminate between stable and worse groups (Table V), although there was an overlap in change scores, meaning that the same change score could be attributed both to a patient who rated him/herself as worse and to a patient who rated him/herself as stable (Figs 2 and 3).
Table III. Absolute and relative median changes in outcome measures according to patients’ answers on the global rating of change scales in balance, walking, and lower-limb (LL) weakness
Fig. 2. Box plots showing relative (percentage) changes in Timed Up and Go, Berg Balance Scale and lower-limb composite score from quantitative muscle testing for stable and worse groups according to patients’ answers on the global rating of change scales in balance, walking and lower-limb weakness. Negative values indicate deterioration.
Fig. 3. Box plots showing relative (percentage) change in: (a) knee extensors strength and lower-limb composite score from quantitative muscle testing for stable and worse groups according to patients’ answers on the global rating of change scale in stair-climbing; and (b) grip strength, pinch-grip strength and Purdue Pegboard test for stable and worse groups according to patients’ answers on the global rating of change scale in hand weakness. Negative values indicate deterioration.
Most (70%) a priori formulated construct approach hypotheses were confirmed (Table VI). Despite the predictions, the lowest correlations between QMT measures and TUG and BBS were found for foot dorsiflexors. The correlation between relative changes in grip strength and pinch-grip strength was lower than anticipated.
Table IV. Absolute and relative median changes in outcome measures according to patients’ answers on the global rating of change scales in stair-climbing and hand weakness
Table V. Criterion approach results from receiver operating characteristic curve analyses of change scores predicting patients classified as worse according to their answers on global rating of change scales in balance, walking, lower-limb (LL) weakness, stair-climbing and hand weakness
Table VI. Construct approach results presenting Spearman’s correlation coefficients between relative (percentage) changes in outcome measures
This is the first study to assess, from a long-term perspective, the responsiveness of performance-based outcome measures in adults with DM1. Applying criterion and construct approaches, we explored predefined hypotheses about expected AUCs and correlations between changes in the various constructs. Our main findings are that promising responsiveness was found for TUG, BBS and QMT measures, i.e. the knee extensors and the lower-limb composite score, the latter when changes were expressed in relative terms. Grip strength and pinch-grip strength measures, and PPT showed poorer responsiveness.
The follow-up rate from baseline might be considered as rather low. There is, however, an increased mortality rate in this patient group and 30% of patients from baseline were deceased 9 years later. Thus, despite the loss to follow-up, we argue that the study is unique and important regarding both sample size and the follow-up period. Furthermore, that only 14 patients declined to participate must be regarded as a success.
Surprisingly, not all studied outcome measures showed median deterioration changes over the 9-year period. Even though DM1 is a slowly progressive disease, mobility, as measured with TUG, and QMT measures, is not likely to improve after such a long time. The way TUG is administered, i.e. participants must walk at a self-selected speed, adds variability, which probably influenced the result. Thus, it can be speculated that another method of administration, e.g. walking as fast as safely possible, might be better when using TUG in research or in the clinical setting. It is not known why there was no median decline in pure isometric hip flexor muscle strength in our study. All other QMT data showed large relative changes, in agreement with the previously reported force loss in muscle strength found over time in DM1 (29). The BBS descriptive data showed that this outcome measure had major ceiling effects at both time-points. This indicates an inability to detect changes over time for some patients, and BBS is therefore less suitable as an outcome measure in DM1. However, the scale might be useful in clinical practice to detect deterioration.
The patients’ self-rated changes on the GRS, which were used as criteria, were reflected accordingly by relative changes in the performance-based outcome measures. Most a priori hypotheses concerning AUCs were confirmed, although some AUCs were below 0.7, which has been proposed as a threshold for adequate responsiveness (6, 7). Both TUG and BBS had AUCs indicating promising responsiveness in relation to patients’ self-reported changes in balance, walking and lower-limb weakness. Thus, despite previously discussed shortcomings, these outcome measures appear to reflect the patients’ perspective. The discriminative ability to distinguish those worse in stair-climbing was good for the 2 QMT measures, i.e. relative changes in lower-limb composite score and knee extensors. Thus, these QMT measures appear to give valuable information on functioning in DM1. The discriminative ability of grip strength and pinch-grip strength measures, and PPT to distinguish those who considered themselves as having worse hand weakness was, however, poorer.
The AUCs were, in general, larger for relative changes than for absolute outcome measures of muscle strength. Thus, it may be more relevant to report changes in relative scores (%) rather than in absolute (Nm, kg) when assessing muscle strength. However, when interpreting percentage changes one should bear in mind that a small change in a weak person will render a large relative change. In addition, one must consider where in the continuum of deterioration a person loses strength. That is, a change of 3% in muscles of normal strength does not have the same effect as a 3% loss in fairly weak muscles.
A responsive outcome measure should be able to distinguish clinically important changes from measurement error (6). It is therefore relevant to relate change scores to the SDC, which defines changes beyond measurement error (7). Our data suggest that TUG, grip strength and pinch-grip strength measures, and PPT, were unable to detect clinically important changes over time in our cohort since the changes did not exceed reported SDCs (23, 27). However, note that the sample sizes were small (10 and 16 persons) in the reliability studies from which these SDCs were derived and that another device (Grippit®) was used for grip strength measures. As for the other outcome measures, no data are available on measurement errors in the DM1 population for comparison.
Most of our a priori construct approach hypotheses were confirmed. However, we did not exceed the cut-off point of >75% of the results for correspondence with the hypotheses, which is proposed to indicate positive responsiveness (6, 32). There is, however, no consensus or guidelines about how many hypotheses are to be tested or if all hypotheses are regarded as equally important. Hence, this cut-off point must be considered with caution. Furthermore, some of our hypotheses were based on the literature and clinical experience of relationships between outcome measures and not on the relationship between change scores. Correlation coefficients in responsiveness studies are often lower than those found in construct validity studies (32). That the relative change in QMT of knee extensors correlated highly with changes in mobility and balance outcomes and the QMT lower-limb composite score, highlights the importance of this muscle group in DM1. Thus, knee extensor muscle strength may be significant for activity and participation in DM1. Furthermore, it seems clinically relevant to measure strength in these muscles to identify patients who are at risk of loss of functioning.
The use of GRSs, capturing patients’ self-rated perceived changes, as gold standards or anchors in responsiveness studies is not uncommon (33–36). The proper function of these scales, however, places a cognitive demand on the participant, as he/she must recall and quantify status at previous time-points (37). Our choice of GRS as criteria might therefore be seen as a limitation as there is a cognitive decline over time in DM1 (19, 38). Even if it is important to address and respect the individual’s own opinion, we acknowledge that clinician-rated GRS would have added valuable information. Unfortunately, we lacked such data. Furthermore, it could arguably be difficult for people with slowly progressive diseases, such as DM1, to perceive the gradual decline in physical functioning. Living with DM1 is a process of constant change and adjustment. The response-shift phenomenon, which includes a change in internal standards, values and conceptualization (39, 40), is part of that process. Thus, the response-shift phenomenon might have influenced patients’ ratings of perceived changes in recent years.
Another possible limitation is that the responsiveness of grip strength measures might have been influenced by the measurement instrument used. The standard Jamar dynamometer and the B&L pinch gauge are not sensitive enough to register subtle changes, the smallest possible change being 0.5 kg. Thus, digital measurement instruments might be more responsive and possibly better for assessing grip and pinch-grip strength over time, both in research and in clinical practice.
We found that the performance-based outcome measures captured changes over the 9-year period. Promising responsiveness was found in the studied outcome measures of mobility (TUG), balance (BBS) and some QMT muscle strength measures when changes were expressed in relative terms. Poorer responsiveness was found in measures of hand weakness (grip and pinch-grip strength) and manual dexterity (PPT). However, further knowledge is needed on measurement errors of measures in the DM1 population to fully interpret the meaningfulness of the longitudinal changes. Finally, it is necessary also to assess responsiveness over a shorter time.
This work was supported by the Einar Belvén Foundation; the Strategic Research Programme in Care Sciences, Karolinska Institutet; the Réseau Provincial de recherche en adaptation-réadaptation (REPAR-FRQS), Canada; and the Fonds de recherche du Québec en Santé, Canada (grant number 22193). CG holds a career salary award (Junior 2 Fonds de recherché du Québec – Santé #31011).


 Click to show fullsize
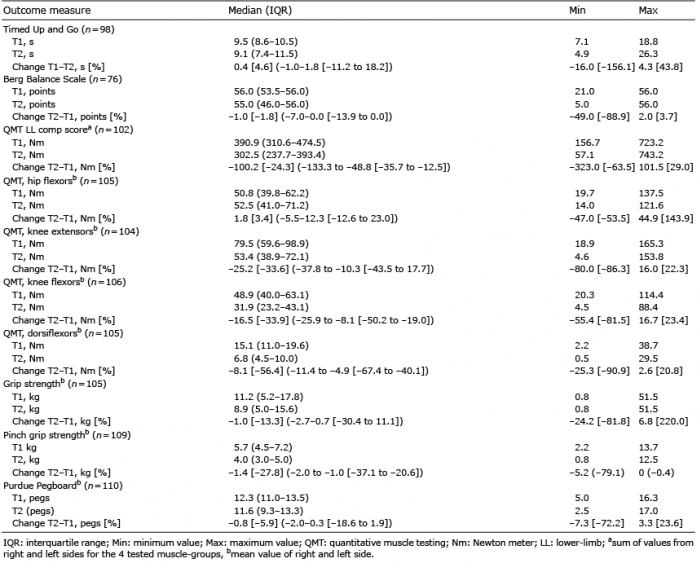 Click to show fullsize
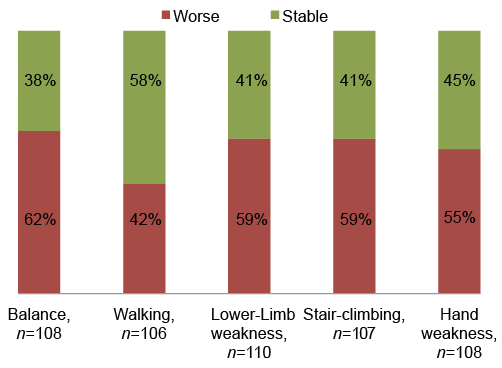 Click to show fullsize
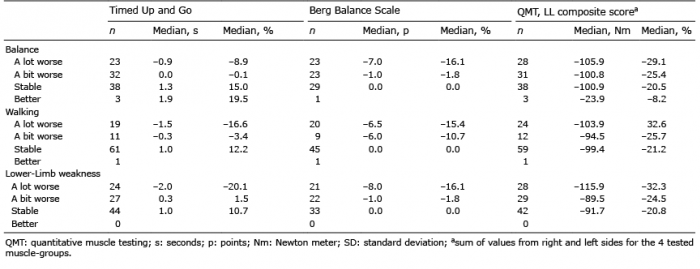 Click to show fullsize
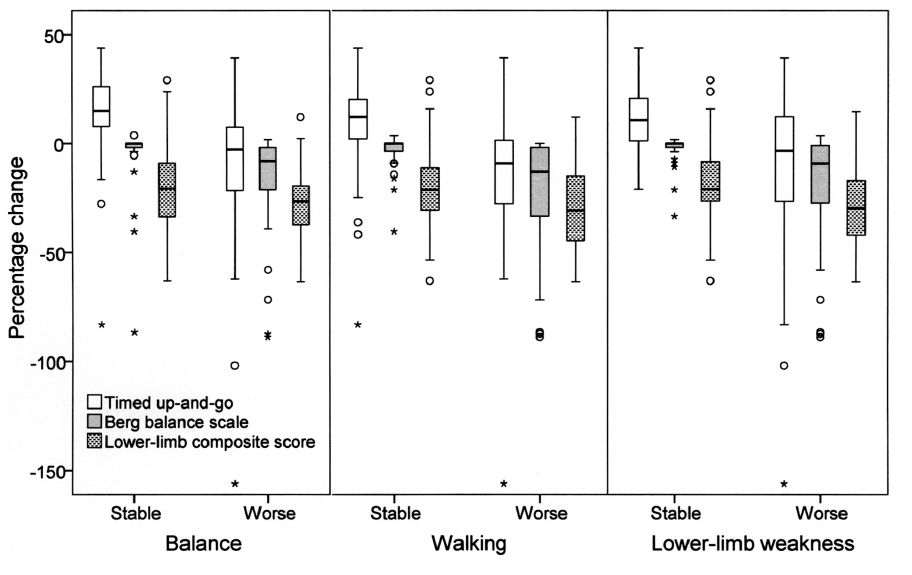 Click to show fullsize
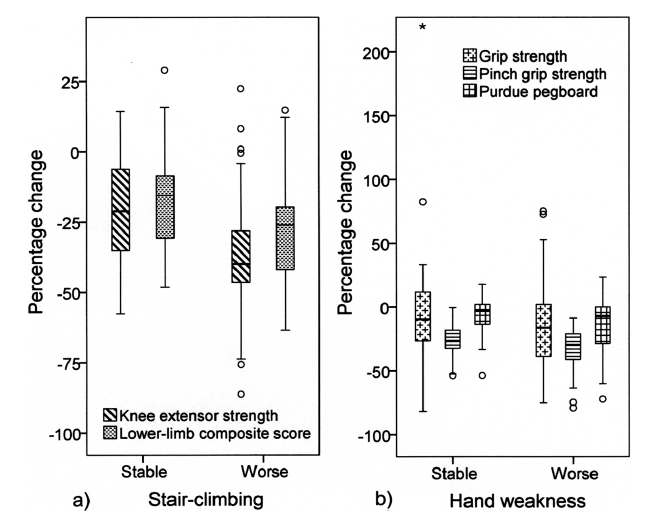 Click to show fullsize
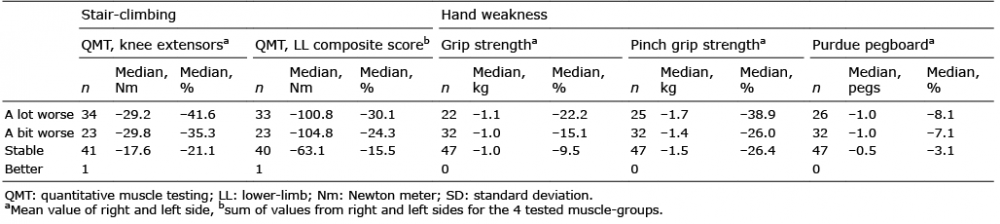 Click to show fullsize
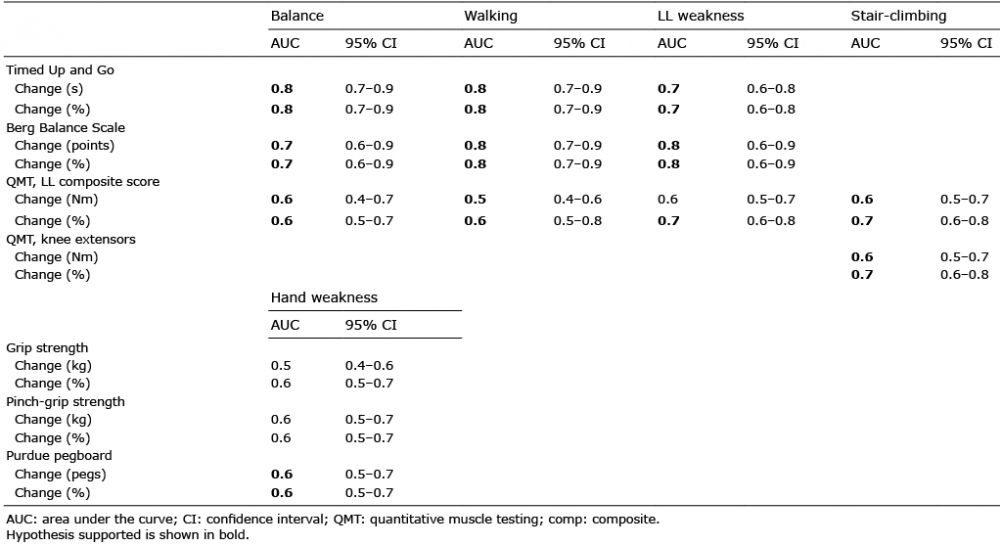 Click to show fullsize
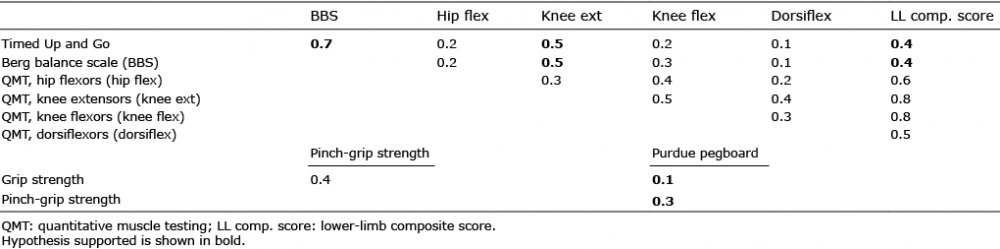 Click to show fullsize