


1Department of Dermatology, Peking University Third Hospital, and 2Department of Dermatology, Aviation General Hospital, Beijing, China
Cutaneous T-cell lymphoma (CTCL) represents a rare group of extranodal T-cell lymphoproliferative diseases. Due to poor clinical outcome of CTCL, there is an urgent need for new and improved therapies. A small molecule, IPA-3, which inhibits p21-activated kinase 1 (PAK1), has shown therapeutic potential in various types of malignancies. In the present study, the anti-tumor effect of IPA-3 and its underlying molecular mechanism was evaluated. High expression of phosphorylated-PAK1 (pho-PAK1) was seen in CTCL lesional skin compared to benign inflammatory dermatoses. IPA-3 could significantly inhibit the proliferation of 3 CTCL lines in a dose- and time-dependent manner. The percentage of apoptotic cells was higher in the treatment group. Further, IPA-3 treatment caused increased EGR1 protein levels and decreased apoptosis-related BCL-2 and pho-BAD protein levels. In summary, inhibition of pho-PAK1 has significant anti-tumor effects in CTCL cells and it can be explored as a future therapeutic option.
Key words: IPA-3; lymphoma; EGR1; BCL-2; pho-BAD.
Accepted Jul 12, 2019; E-published Jul 12, 2019
Acta Derm Venereol.
Corr: Dr. Chunlei Zhang, Department of Dermatology, Peking University Third Hospital, No. 49 North Garden Road, Haidian District, Beijing, 100191, China. E-mail: zhangchunleius@163.com.
IPA-3, a small molecular inhibitor of p21-activated kinase 1 (PAK1) phosphorylation, has anti-tumor activity in multiple cancers. However, its role in cutaneous T-cell lymphoma and the underlying molecular pathogenesis are still unclear. This study investigates the role of IPA-3 on cutaneous T-cell lymphoma cells. Pho-PAK1 overexpression is seen in patients with cutaneous T-cell lymphoma. IPA-3 treatment induces apoptosis and inhibits cell growth by inducing EGR1 expression and simultaneously down-regulating the levels of BCL-2 and pho-BAD. Therefore, pho-PAK1 may be a potential tumor marker and therapeutic target of cutaneous T-cell lymphoma.
Cutaneous T-cell lymphomas (CTCLs) are a group of extranodal non-Hodgkin’s lymphomas that are characterized by cutaneous infiltration of malignant monoclonal T lymphocytes (1). Mycosis fungoides (MF), its leukemic variant, Sézary syndrome (SS), and primary cutaneous CD30+ lymphoproliferative diseases are the major subtypes of CTCL (1, 2). Generally, CTCLs are easily misdiagnosed as benign inflammatory dermatoses (BID) at the early stages owing to various clinical presentations (1). Therefore, for a definitive diagnosis for CTCLs, the National Comprehensive Cancer Network recommend a comprehensive analysis of dermatopathology, immunohistochemistry (IHC), and TCR gene rearrangement in skin biopsy from suspicious lesions (3).
Although there are multiple studies on therapy for CTCLs, no cure is currently known (4). In addition, most available therapeutic options are palliative and inappropriate for patients because of their significant side effects; therefore, new therapeutic options are urgently needed.
The p21-activated kinase 1 (PAK1) is a serine/threonine protein kinase and the main downstream effector of the Rho family of small GTPases (5–7). The PAK1 domain structure contains 7 autophosphorylation sites (Ser21, 57, 144, 149, 199, 204, and Thr423), which regulate its enzymatic activity. Other sites phosphorylated by protein kinases also modulate PAK1 activity and localization (8). Functional studies demonstrate that PAK1 plays a significant role in cell proliferation, motility, apoptosis, and tumor progression (5). Phosphorylated-PAK1 (pho-PAK1) is overexpressed in several malignancies, including extra-mammary Paget’s disease, breast, prostate, and squamous cell carcinomas (9–12). These findings indicate a pivotal role of pho-PAK1 in tumor pathogenesis.
In the present study, we explored the role of pho-PAK1 in CTCLs. Firstly, the expression pattern of pho-PAK1 was compared among CTCL tumor tissues and BID lesions using IHC. IPA-3 was identified as a highly selective, non-ATP competitive inhibitor that targets the autophosphorylation site Thr423 of activated PAK1(13). Further, the inhibitory effect of IPA-3 was verified on CTCL cell lines. Next, the downstream target of pho-PAK1 was determined by Western blotting. The results show that the inhibition of pho-PAK1 has significant anti-tumor effects in CTCL, which can be explored as a potential therapeutic option in the future.
Skin tissues of cutaneous T-cell lymphoma and benign inflammatory dermatoses
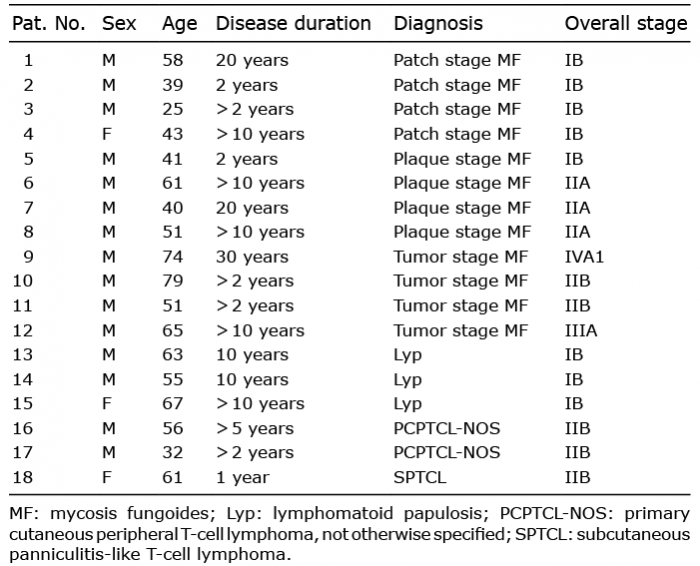
Formalin-fixed, paraffin-embedded tissue blocks of 18 patients diagnosed with different types of CTCL from 2008 to 2016 were retrieved from the clinical databases of the Department of Dermatology, Peking University Third Hospital. The experiments were approved by Clinical Ethics Board of Peking University Third Hospital in accordance with the Declaration of Helsinki principles. All patients signed an informed consent. The characteristics of these patients are listed in Table I. The diagnosis was performed according to an integrated clinical pathological algorithm, based on 2016-WHO classification criteria of lymphoid neoplasms. The diagnosis was later confirmed by 3 independent dermatopathologists (14).
Patients comprised 3 females and 15 males; 12 of the patients were diagnosed with various clinical stages of MF, 3 with lymphomatoid papulosis (Lyp), 2 with primary cutaneous peripheral T-cell lymphoma, not otherwise specified (PCPTCL-NOS), and one with subcutaneous panniculitis-like T-cell lymphoma (SPTCL). Age of the patients ranged from 25–79 years. The disease durations ranged from 2–30 years, with a mean of 9 years. Skin biopsies were also obtained from 20 subjects with BID (chronic dermatitis, n = 16; lichen planus, n = 4) as controls (Table I).
Table I. Detailed characteristics of subjects with cutaneous T-cell lymphoma
Cell lines and reagents
Two human CTCL cell lines, HH (CRL-2105™) and Hut78 (CRM-TIB-161™), were obtained from the American Type Culture Collection (ATCC; Manassas, VA, USA). Another human CTCL cell line, Myla, was a kind gift from Dr. Yang Wang (Department of Dermatology, Peking University First Hospital). The HH cell line was derived from the peripheral blood of a patient with an aggressive CTCL. The Hut78 cell line originated from the peripheral blood of a male patient with SS. The Myla cell line was generated from the plaque tissue of a patient with tumor-stage MF. All cell lines were maintained in RPMI 1640 medium (Gibco, Eggenstein, Germany) supplemented with 10% fetal bovine serum (HyClone Laboratories, Logan, UT) and 1% penicillin-streptomycin solution.
Immunohistochemistry
Paraffin-embedded tumor sections were de-paraffinized in xylene for 30 min and rehydrated in graded ethanol, followed by 3 times washing in phosphate-buffered saline (PBS). Next, the sections were blocked in 3% H2O2 for 15 min at 22–25°C, before the antigen retrieval in microwave oven for 18 min, followed by 3 PBS washes. The tissues were then incubated overnight in pho-PAK1Thr423 antibody (1:50), at 4°C. Rabbit IgG (ab172730, Abcam, USA) was also used as an isotype-matched control to exclude non-specific interactions. Thereafter, the sections were stained with goat anti-rabbit/mouse antibody detection kit (PV-9000D, Zhongshan Golden Bridge, Beijing, China), followed by counterstaining with haematoxylin and eosin. Finally, the tissue slides were scanned under NanoZoomer (NanoZoomer-SQ C13140-01; Hamamatsu, Hamamatsu, Japan). The immunoreactive score was obtained by multiplying the stain-intensity (SI) with the percentage of positively stained cells (PP). The SI was scored as follows: 0 (negative staining), 1 (weak staining), 2 (moderate staining), and 3 (strong staining). PP was graded as 0 (negative), 1 (≤ 10%), 2 (11–50%), 3 (51–80%), and 4 (≥ 81%). The final score of 0–12 was defined as follows: negative (–, score: 0), weak (+, score: 1–4), moderate (++, score: 5–8), and strong (+++, score: 9–12). The scoring was performed independently by 3 dermatopathologists. The detailed scoring system was based on the reported literature (15).
Evaluation of cell viability and survival
Three cell lines (HH, Hut78, and Myla) were seeded in 6-well plates (2×10⁵ cells/ml per well), followed by treatment with 2 to 6.5 μM of IPA-3 for 6, 12, or 24 h. The control cells were treated with dimethyl sulfoxide (DMSO) vehicle. At each time point, 100 μl of the cell suspension was transferred to a 96-well plate and supplemented with 20 μl of MTS reagent (Promega, Madison, WI, USA), followed by an additional incubation for 2 h. The relative cell viability was measured at 490 nm using a 96-well plate spectrophotometer. The IC50 value was calculated using GraphPad Prism5 Software. Each experiment was performed in triplicate and repeated at least 3 times.
Cell cycle analysis by flow cytometry
The cell lines (1×10⁶ cells) were treated with or without IPA-3 (2, 3.5, and 5 μM) for 24 h in 6-well plates. Thereafter, the cells were washed with cold PBS, and fixed in cold 70% ethanol overnight at −20°C. Next, the cells were suspended in 300 μL of PBS, and stained with 10 μl of 7-amino-actinomycin-D (7-AAD) (BD, Franklin Lakes, NJ, USA) in dark for 10 min at 22–25°C. Distribution of the cell-cycle phases was determined with a FACScan flow cytometer (BD Biosciences, USA). For each sample, 10,000-gated events were obtained. Analyses of cell-cycle distribution were performed using Modfit software (BD Biosciences, USA).
Annexin V binding staining
Annexin V binding assay was performed using Annexin V-FITC/7AAD kit (BD Biosciences), according to the manufacturer’s instructions. Briefly, all cell lines (1×10⁶ cells) were incubated with or without IPA-3 (2, 3.5, and 5 μM) in 6-well plates for 24 h. Cells were collected in binding buffer after washing with PBS. Next, the cells were incubated with Annexin V-FITC and 7-AAD for 15 min in dark. Cells were then transferred to FACS tubes and analysed by using FACScan flow cytometer.
Western blotting
Cellular protein was extracted using RIPA lysis buffer with 1 mM phenylmethanesulfonyl fluoride, and the protein concentrations were quantified using a bicinchoninic acid protein assay (PPLYGEN, Beijing, China) kit. Next, the protein samples were subjected to SDS-polyacrylamide gel (12%) electrophoresis, followed by electrotransfer onto nitrocellulose membranes. The membranes were blocked in 2.5% powdered milk in Tris buffered saline with Tween-20 (TBST) at 22°C to 25°C for 1 h, then incubated overnight in primary antibody at 4°C (PPLYGEN). The membranes were then washed thrice with TBST, followed by incubation with 1:10,000 dilution of fluorescently labelled secondary antibodies for 1 h at 22°C to 25°C. The blots were then washed in TBST and imaged on a LI-COR Odyssey® Imaging System. The primary antibodies used in this study included anti-pho-PAK1Thr423 (ab2477, Abcam), anti-EGR1 (4153S, Cell Signaling, Technology, USA), anti-BCL-2 (4223S, Cell Signaling Technology), anti-BAD (ab32445, Abcam, 1:4000), anti-pho-BADSer136 (ab129192, Abcam), anti-Bax (5023S, Cell Signaling Technology), and anti-GAPDH as an internal control (PPLYGEN 1:5000). All antibodies were used in 1:1000 dilutions, unless specified otherwise.
Statistical analysis
All statistical calculations were performed using SPSS (version 23.0) for Windows (SPSS Inc., Chicago, USA). Statistical significance was evaluated by independent samples t-tests, one-way ANOVA or Mann-Whitney U tests. Results were considered statistically significant at p-values < 0.05.
pho-PAK1 is overexpressed in skin tissues of cutaneous T-cell lymphoma patients
To investigate the expression level and localization of pho-PAK1, we performed IHC on all the biopsy samples of CTCL and BID tissues (as mentioned in Table I). As shown in Fig. 1a, infiltrating lymphocytes in the dermis of CTCL tissues showed a positive expression of pho-PAK1. The number of positively stained and overall number of infiltrating lymphocytes in the dermis were found to be higher in tumor tissue than in BID samples. The intensity of specific staining was also stronger in CTCL skin lesions as compared to BID samples. After scoring the data, 77.8% of CTCL samples (14 out of 18), which comprised 83.3% MF, 33.3% Lyp, and 100% PCPTCL-NOS1 and SPTCL cases, showed moderate to strong pho-PAK1 staining. However, only 5% (1 out of 20) of BID cases showed moderate pho-PAK1 staining. Although keratinocytes were also positively stained for pho-PAK1, no significant difference was observed between BID and CTCL samples. In conclusion, the differential staining of pho-PAK1 in lymphocytes can distinguish CTCL from BID samples. The difference in expression of pho-PAK1 in the CTCL and BID samples was statistically significant (**p < 0.01) (Fig. 1b).
Fig. 1. pho-PAK1 expression in cutaneous T-cell lymphoma (CTCL) tissues. (a) Representative images of the pho-PAK1-stained tissue sections of various CTCL and benign inflammatory dermatoses (BID) samples. Compared to control samples, an increased pho-PAK1 expression was observed in different disease entities (original magnification 40×, inset 200×, scale bar; 100 μm). (b) Immunohistochemistry score of pho-PAK1 expression is significantly increased in CTCL skin lesions compared to that of BID samples. ** p < 0.01.
IPA-3 inhibits the proliferation of cutaneous T-cell lymphoma cells
To determine the effect of IPA-3 on cell proliferation, 3 CTCL cell lines (HH, Hut78, and Myla) were treated with or without IPA-3 in a dose and time-dependent manner and subjected to MTS assay. At IPA-3 concentrations of 2 to 6.5 μM for 6, 12, and 24 h, growth inhibition of Hut78 cells increased from 13% to 57%, from 18% to 64%, and from 18% to 81% in a concentration- and time-dependent manner compared with that in the vehicle control (n =3, *p < 0.05, **p < 0.001) (Fig. 2a). Similar results were also seen in HH (from 7% to 58%, from 30% to 74%, and from 35% to 95%) (Fig. 2b) and in Myla cells (from 8% to 32%, from 14% to 48%, and from 25% to 57%) (Fig. 2c). For all MTS assay, vehicle-treated cells were taken as control. Furthermore, HH cells were more sensitive to 24 h treatment with IPA-3, as the IC50 value in HH, Hut78, and Myla cells was 2.95, 3.69, and 4.07 μM, respectively. Next, the inhibitory effect of IPA-3 on the expression levels of pho-PAK1 and PAK1 was determined. As shown in Fig. 2d–f, IPA-3 treatment for 24 h caused down-regulation of pho-PAK1 expression in a dose-dependent manner; whereas, the expression level of PAK1 remained unchanged. In summary, the results show that IPA-3 has an inhibitory effect on the growth of CTCL cell lines.
Fig. 2. Inhibitory effects of IPA-3 on cell proliferation and pho-PAK1 expression in cutaneous T-cell lymphoma (CTCL) cell lines. (a–c) All CTCL cell lines were treated with or without IPA-3 (2, 3.5, 5, and 6.5 μM) for 6, 12, and 24 h. Cell viability was determined using MTS assays performed in triplicate. Cell growth was significantly decreased in the cells treated with IPA-3 as compared to untreated control. (d–f) The inhibitory effect of IPA-3 (2, 3.5, and 5 μM) treatment for 24 h on the expression level of pho-PAK1 was confirmed in three cell lines by western blotting. n = 3; *p < 0.05, **p < 0.01.
IPA-3 induces cell-cycle arrest and promotes cell apoptosis in cutaneous T-cell lymphoma lines
To elucidate whether the IPA-3-mediated growth inhibition is due to cell-cycle arrest and/or apoptosis, all CTCL cell lines were treated with or without IPA-3 at 2–5 μM concentrations for 24 h. Our data showed that IPA-3 treatment resulted in a significant increase in the fraction of Hut78 (35.35–51.32%), HH (37.17–60.58%), and Myla (41.51–66.50%) cells in G0/G1 phase in a dose-dependent manner. Increased numbers of cells in the G0/G1 phase were accompanied by a loss of cells in the S phase (n = 3, *p < 0.05) (Fig. 3a–c). Furthermore, the fraction of Annexin V positive cells was also increased in Hut78 (7.06–26.25%), HH (3.6–27.3%), and Myla cells (9.5–27.5%) after 24 h treatment with IPA-3, as compared to control cells (n = 3, *p < 0.05) (Fig. 3d–f).
Fig. 3. Effects of IPA-3 treatment on cell cycle and apoptosis in cutaneous T-cell lymphoma (CTCL) cell lines. Three cell lines were treated with or without IPA-3 (2, 3.5, and 5 μM) for 24 h. Cell cycle distributions and apoptosis were analysed by flow cytometry. (a–c) CTCL cells showed increased accumulation in G0/G1 with concomitant decrease in S and G2/M phase of cell cycle, in response to IPA-3 treatment. (d–f) A significant increase in the Annexin V positive population was observed in CTCL cell lines in a dose-dependent manner. * p < 0.05; **p < 0.01. Each experiment was repeated thrice with 3 biological replicates.
IPA-3 regulates the expression of cell cycle and apoptosis-related proteins in cutaneous T-cell lymphoma cells
To understand the underlying mechanism of cell cycle arrest and apoptosis in CTCL cells, the expression of proteins related to these processes were estimated in response to IPA-3 treatment. Expression of EGR1, a tumor suppressor protein, increased with IPA-3 treatment. Expression of pho-BADSer136, an inactive form of the pro-apoptotic protein BAD, and of the anti-apoptotic protein BCL-2, were found to be decreased after IPA-3 treatment. The expression levels of total BAD and Bax remained unchanged after the treatment (Fig. 4).
Fig. 4. IPA-3 treatment regulates the expression level of anti- and pro-apoptotic proteins. Cells were treated with 3.5 μM of IPA-3 for 24 h, and protein samples were collected. (a, b) IPA-3 treatment resulted in reduction in pho-BAD and BCL-2 levels, and induction of EGR1 levels. GAPDH was used as a loading control. Results were representative of 1 of 3 independent experiments.
In this study, we demonstrated an overexpression of pho-PAK1 in CTCL skin lesions, which can be inhibited by a small molecule inhibitor, IPA-3. Furthermore, we used 3 different subtypes of CTCL cell lines to evaluate the anti-tumor effects of IPA-3 in vitro and the underlying molecular pathogenesis. HH cell line was derived from a patient with an aggressive CTCL after extensive chemo-therapy. The Hut78 cell line originated from a patient with SS. The Myla cell line was generated from a patient with tumor-stage MF. In CTCL cell lines, IPA-3 treatment caused reduced cell proliferation, induced apoptosis, and arrest of CTCL cells in the G0/G1 phase of cell cycle. Our previous study demonstrated that siRNA-mediated knockdown of PAK1 induces the expression of PUMA and p21 in CTCL cell lines (16). However, IPA-3, which abrogates the phosphorylation of PAK1 at Thr423, acts as an anti-tumorigenic agent via a different molecular mechanism. Our study revealed that inhibition of pho-PAK1 leads to up-regulation of EGR1 with concomitant down-regulation of BCL-2 and pho-BADSer136 (Fig. 5).
Fig. 5. The proposed mechanism for anti-tumour activity of a pho-PAK1 inhibitor in cutaneous T-cell lymphoma (CTCL) cells.
Other than protein-protein interaction, activation and localization of PAK1 is also regulated via autophosphorylation and other kinase-dependent phosphorylation (8). Ser144 and Thr423 are the major PAK1 autophosphorylation sites responsible for its kinase activity (17). In a previous study, we have shown that PAK1 plays an important role in the pathogenesis of CTCL (16). Moreover, several lines of evidence have highlighted a role of Thr423 phosphorylation of PAK1 in various neoplasm progressions (8). Our study also demonstrated an overexpression of pho-PAK1Thr423 in CTCL tissues. This suggests that the pharmacological inhibition of pho-PAK1 may be a promising treatment for CTCL patients.
EGR1 (Early growth response 1), also known as NGFI-A, TIS8, ZIF268, or KROX-24, is a member of the EGR family of transcription factors (18). EGR1 exhibits a dual role of a tumor suppressor or a tumor-promoting factor in various carcinomas, by regulating cell cycle progression, apoptosis and malignant transformations (19–21). EGR1 stimulates cells proliferation in prostate, stomach, and kidney cancer (22–24), whereas it shows a tumor-suppressive activity in breast cancer, melanoma, fibrosarcoma and B cell lymphoma (25–28). Our results also indicate a tumor-suppressive activity of EGR1 in CTCL. As reported earlier, EGR1+/– and EGR1–/– mice develop T-cell lymphoma at a higher rate than wild type mice do (29). Taken together, we are reporting for the first time that IPA-3 induces cell cycle arrest of CTCL cells by up-regulating EGR1.
BAD is a potent pro-apoptotic protein that binds and inactivates two anti-apoptotic proteins BCL-2 or BCL-XL. Phosphorylation of BAD at Ser136/Ser11/Ser155 prevents its heterodimerization with BCL-2 and BCL-XL, thereby promoting cell growth (30). Interestingly, PAK1 promotes cell proliferation by regulating the phosphorylation of BAD (31). Consistent with previous studies (30, 31), we demonstrate that IPA-3 mediated inhibition of pho-PAK1 induces cell apoptosis by decreasing the level of pho-BAD at Ser136, without changing BAD expression.
BCL-2 is an anti-apoptotic protein localised in the outer mitochondrial membrane that can impair cytotoxicity-induced apoptosis (32). High expression of BCL-2 in CTCL causes resistance to chemotherapy, resulting in poor prognosis (33). Further, a balance between the levels of Bax (pro-apoptotic protein) and BCL-2 is critical for the regulation of cell cycle and apoptosis (30, 34). In our study, IPA-3 treatment induced apoptosis at a concentration that did not change the expression of BAX. Nonetheless, there was a significant decrease in BCL-2 expression. Thus, we conclude that inhibition of pho-PAK1 causes apoptosis in CTCL cells by disturbing the BCL-2/BAX ratio.
To summarize, we show that pho-PAK1 at Thr423 is overexpressed in CTCL tissues compared with its level in BID skin lesions. IPA-3, a small molecule inhibitor of pho-PAK1, exhibits a significant inhibitory effect on CTCL progression in vitro. Our preliminary data suggest that Thr423 phosphorylation of PAK1 might be a potential target for CTCL therapy in the future. A limitation of the current study is the fact that we did not use normal, non-transformed lymphocytes as a control. To resolve this problem, we will initiate the recruitment of healthy control subjects to acquire normal, non-transformed lymphocytes as control; CD4+ lymphocytes will be sorted from peripheral blood mononuclear cells to further evaluate the selectivity of the inhibitor on patients with CTCL. In addition, it is noteworthy that 2 of 3 Lyp samples in our study showed weak pho-PAK1 staining, which might be due to heterogeneity within cutaneous lymphomas and smaller sample size. Henceforth, a detailed study is needed to confirm IPA-3 role in vivo and to evaluate the sensitivity of PAK-inhibition in other subtypes of CTCL including Lyp cell lines.
This study was supported by the National Natural Science Foundation of China (grant numbers 81372915 and 81402259).
The authors have no conflicts of interest to declare.


 Click to show fullsize
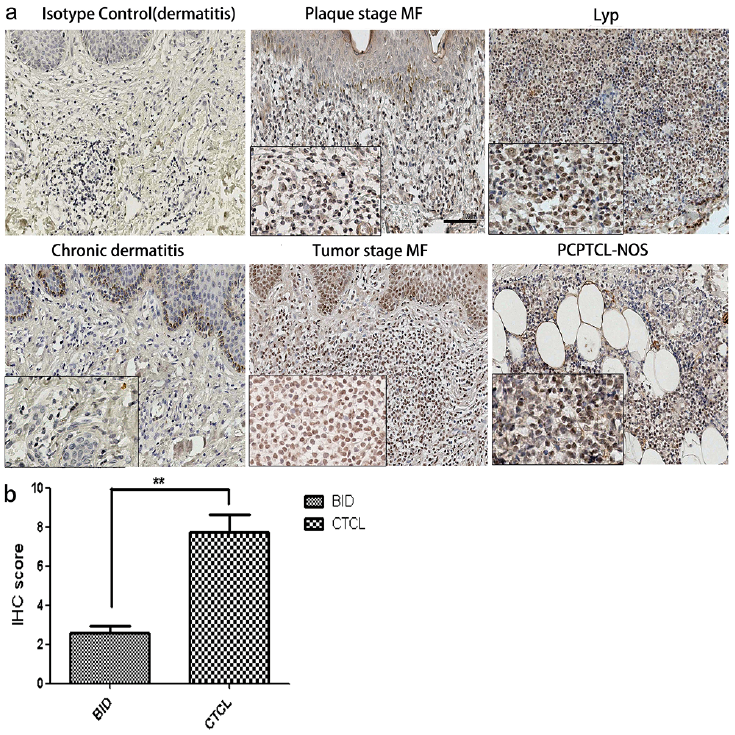 Click to show fullsize
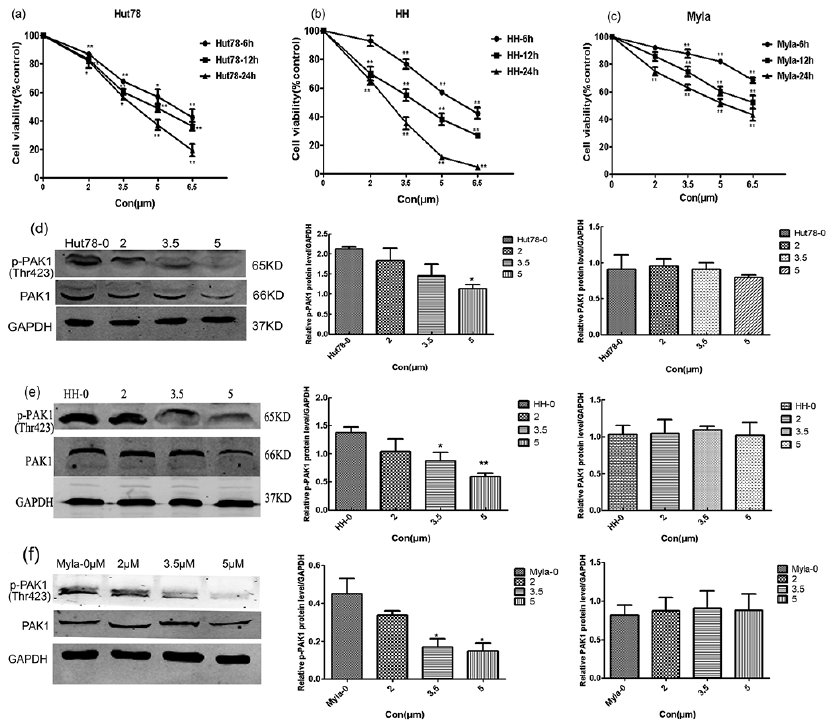 Click to show fullsize
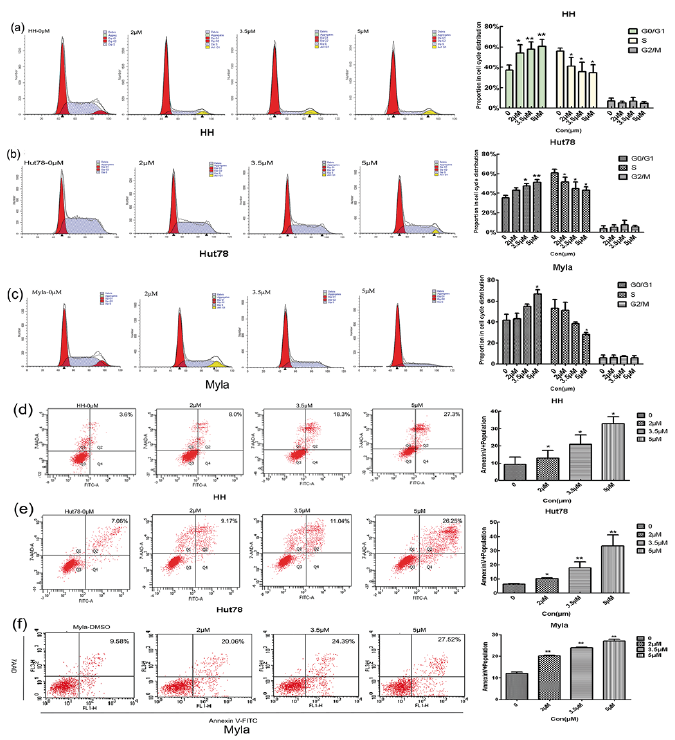 Click to show fullsize
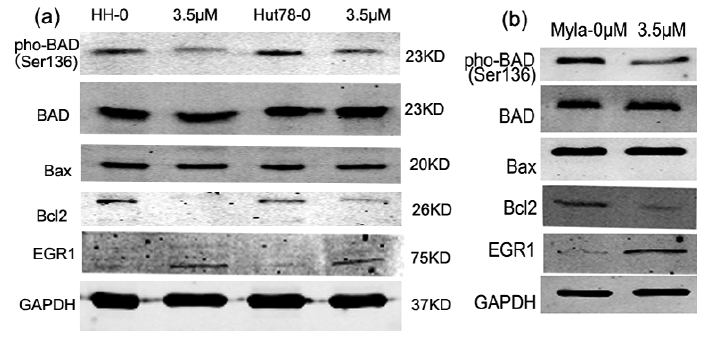 Click to show fullsize
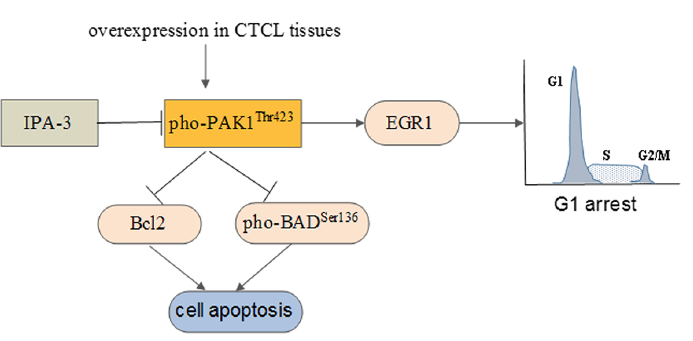 Click to show fullsize