


1Department of Dermatology and Center for Chronic Pruritus, University Hospital Münster, Von-Esmarch-Strasse 58, DE-48149 Münster, Germany, 2Department of Dermatology, University of Rzeszow, Rzeszow, Poland, and 3CVderm, German Center for Health Services Research in Dermatology, Institute for Health Services Research in Dermatology and Nursing, University Medical Center Hamburg-Eppendorf, Hamburg, Germany. *E-mail: sonja.staender@uni-muenster.de
Accepted Oct 3, 2019; E-published Oct 3, 2019
The minimal clinically important difference (MCID) (1) is the smallest beneficial difference perceived by patients on a scale used for scoring (2, 3). Making a systematic investigation of MCID is demanding because it may depend on the method of calculation, response to an instrument, anchor measure reliability, baseline symptom severity, age, socioeconomic status, education, and treatment (3–5).
In a previous study (6), we investigated the overall MCID in chronic pruritus using a visual analogue scale (VAS) and numeric rating scale (NRS). It was found that the MCID corresponded to a 2–3-point decrease in both scales, with no statistically significant difference between them. The second part of the study evaluated the variation in MCID according to baseline pruritus. This study also assessed the influence of sex, pruritus aetiology, skin condition, duration, localization and quality of pruritus on MCID.
The detailed study design is described elsewhere (6). All patients (n = 192) were asked to rate their mean pruritus intensity within 24 h (VAS24h and NRS24h), at baseline (V1), after 5–14 days (V2), and after 28–42 days (V3). At each visit, patients also reported the average (VASaverage) and maximum (VASmax) pruritus intensity within the previous 4 weeks, as well as completed the Dermatology Life Quality Index (DLQI) and Hospital Anxiety and Depression Scale (HADS-A, HADS-D). At V2 and V3, patients completed a MCID questionnaire with 2 questions: (1) Did your pruritus change in comparison with the first visit (yes/no)? (2) If yes, how did your pruritus change (‘’greatly worsened’’, ‘’worsened’’, ‘’improved’’, ‘’highly improved’’, ‘’all gone’’)? The category ‘’improved’’ was the anchor variable used for MCID calculations for follow-up visits vs. baseline (V1–V2 and V1–V3). Among improved patients, MCID was calculated for 4 VAS24h and NRS24h pruritus severity categories (1: 0–2.9 = mild, 2: 3–6.9 = moderate, 3: 7–8.9 = severe, 4: 9–10 = very severe pruritus) and for 2 additional VAS24h categories, i.e. < 7 (weak to moderate pruritus) and ≥ 7 (severe to very severe pruritus).
The statistical analysis was performed using SPSS V22.0 for Windows. All data were evaluated descriptively and delineated with standard statistical measures. Before statistical testing, a Kolmogorov–Smirnov test was used to analyse variable distribution. For abnormally distributed samples, a non-parametric test was used (Mann–Whitney for independent and Wilcoxon test for dependent variables between 2 subgroups; Kruskal–Wallis for independent variables between more than 2 subgroups). Multiple pairwise comparisons were performed using the Dunn procedure. For normally distributed samples, a parametric test was used (t-test to compare differences between 2 subgroups; analysis of variance (ANOVA) for more than 2 independent subgroups). Multiple pairwise comparisons were performed using the Tukey method. The categorical parameter relationships between 2 independent groups were analysed with an χ2 and Fisher’s exact test, and between 2 related groups via McNemar’s test. The statistical significance was defined as p < 0.05.
The study was approved by the local ethics committee (no. 2007-413-f-S) and registered in the German Clinical Trials Register (DRKS) (no. DRKS00005732).
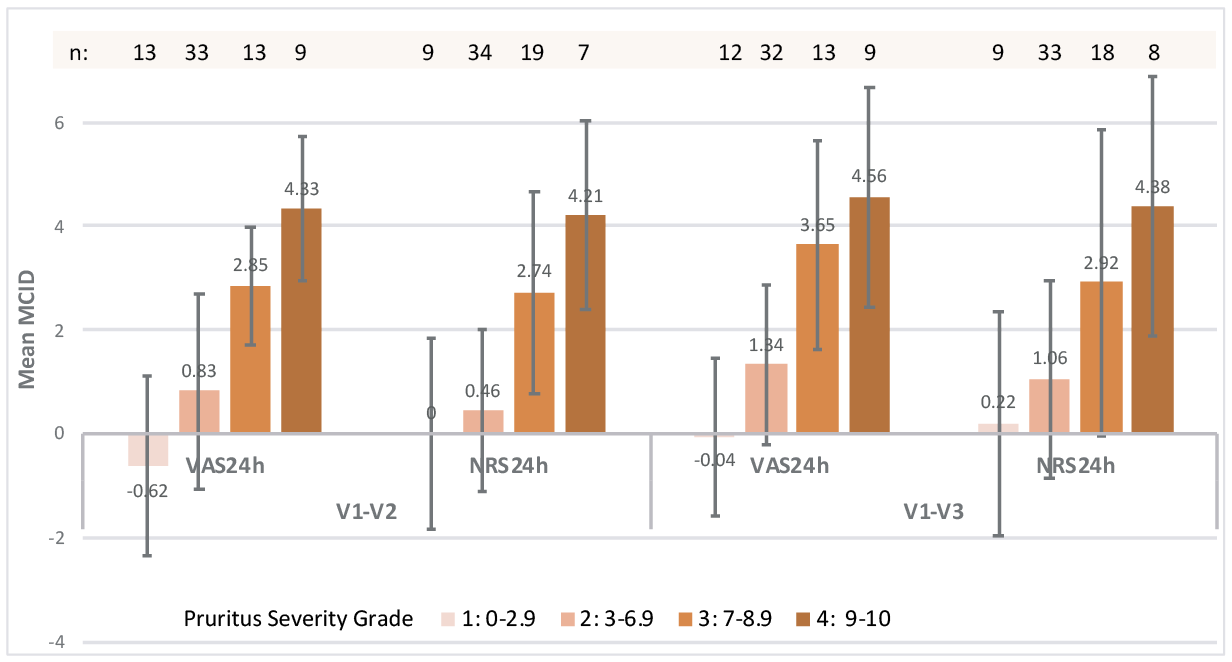
At V2 35.94% (n = 69) and 35.42% (n = 68) at V3 (mean 33 days) reported an improvement of the pruritus vs. during previous visits. In this ‘’improved’’ anchor category, the mean ± SD MCID on VAS24h was 1.40 ± 2.37 (p < 0.001) for V2 vs. V1 (V1–V2) and 1.98 ± 2.50 (p < 0.001) for V3 vs. V1 (V1–V3). The corresponding NRS24h values were 1.41 ±2.13 (p < 0.001) and 1.83 ±2.31 (p < 0.001). Fig. 1 shows the mean MCID for V1–V2 and V1–V3 per severity grade, as rated with the VAS24h and NRS24h (Fig. 1, Table SI).
The differences in VAS24h and NRS24h among the severity categories were statistically significant (p < 0.001) at both time periods.
Fig. 2 shows the mean MCID for V1–V2 and V1–V3, as rated with VAS24h, NRS24h, DLQI, HADS-A, and HADS-D in the categories VAS24h < 7 and ≥ 7. The differences between the categories VAS24h < 7 and VAS24h ≥ 7 were statistically significant considering both the VAS24h (p < 0.001) and NRS24h (p < 0.001) in both time periods. The corresponding differences were statistically insignifican for other measured instruments, except the HADS-D at V1–V2 (p = 0.029).
The mean MCIDs for the ‘’improved’’ anchor by sex, International Forum for the Study of Itch (IFSI) clinical group, aetiological category, localization, quality and duration of pruritus in the time periods V1–V2 and V1–V3, as rated by VASaverage, VASmax, VAS24h and NRS24h, are presented in Tables SII and SIII. In both time periods V1–V2 and V1–V3, the sex differences of the mean MCIDs on VAS24h and NRS24h were insignificant. This was also the case for MCID differences among the 3 IFSI clinical groups, pruritus aetiology, pruritus duration, localization, presence of scratch lesions and pruritus quality. The mean MCID differences were significant between neurological and dermatological categories (VAS24h p = 0.006, NRS24h p = 0.008), neurological and multifactorial (VAS24h p = 0.021, NRS24h p = 0.005) and neurological and pruritus of unclear origin on the NRS24h (p = 0.048) at V1–V3 (VAS24h overall p = 0.013, NRS24h overall p = 0.009), with neurological pruritus showing a larger decrease in intensity.
Fig. 1. Mean minimal clinically important difference (MCID) for visit 2 vs. visit 1 (V1–V2) and for visit 3 vs. visit 1 (V1–V3) per average pruritus severity grade in the 24 h preceding the corresponding visit, as rated by visual analogue scale (VAS24h) and by numeric rating scale (NRS24h).
Fig. 2. Mean minimal clinically important difference (MCID) for visit 2 vs. visit 1 (V1–V2) and for visit 3 vs. visit 1 (V1–V3) for the average pruritus severity categories in the 24 h preceding the corresponding visit VAS24h <7 and ≥7, as rated with a visual analogue scale (VAS24h), numeric rating scale (NRS24h), Dermatology Life Quality Index (DLQI) and Hospital Anxiety and Depression Scale (HADS-A and HADS-D) (+: statistically significant).
The results from the 4 pruritus severity categories revealed that MCID increased alongside the baseline pruritus for both the average pruritus VAS24h and NRS24h. The very severe baseline pruritus (> 9) on the VAS24h had to be reduced by at least 4.56 points, and the severe pruritus (7 to < 9) by at least 3.65, to be of minimal clinical relevance. In comparison, the moderate baseline pruritus (3 to < 7) on VAS24h needed a 1.34 point decrease (Fig. 1, V1–V3). MCID values from the NRS24h were almost identical to those from the VAS24h. Similarly, at V1–V3, MCID in VAS24h < 7 was much smaller (VAS24h = 0.92, NRS24h = 0.88) than in the severe to very severe pruritus category VAS24h ≥ 7 (VAS24h = 4.02, NRS24h = 3.37). These results are analogous with observations from pain studies, where the mean ± SD MCID for a baseline VAS pain < 3.4 was 1.3 ±1.4 and for a baseline VAS pain ≥ 6 it was 2.8 ±2.1 (7). Thus, for both pain and pruritus patients, the MCID seems to be dependent on the initial score values. Also, MCID for the DLQI was higher in patients with a VAS24h ≥7 (3.2–5.1) than those with VAS24h <7 (2.8–4.6), in line with earlier observations of Warlich et al. (8).
Based on earlier pruritus studies (9, 10), we were expecting sex-specific differences in MCID, as rated on VAS24h and NRS24h. However, the subgroup analyses did not confirm this. We also did not observe significant MCID differences for clinical groups, the presence of scratch lesions, aetiology, localization, quality and pruritus duration. It appeared that the mean MCID on both the VAS24h and NRS24h is hardly susceptible to interference. Only the neurological causes, of which there were few in this study, revealed significantly higher MCID values vs. dermatological, multifactorial and unclear causes. The reason for this is uncertain, and might be related to the presence of more difficult to treat pruritus accompanied by neuropathic sensations (burning, stinging, pain).
The study has limitations. The reported MCID scores are the mean scores of a cohort and the corresponding SD are large. At the same time, the number of patients, especially for the time period V1–V3, was rather small. The anchor ‘’improved’’ was possibly affected by the recall bias. In contrast, VAS and NRS measurements should be independent from recall, as they represented the actual day (24 h). The pruritus aetiology was categorized according to IFSI classification and disease categories (e.g. dermatological) and was thus not disease-specific (e.g. atopic dermatitis). Although MCID values did not differ in the clinical groups, except for neurological diseases, in the future it is worth performing studies considering certain diseases, age groups, ethnic groups and sex.
In conclusion, the mean MCID for clinical improvement in pruritus, as rated on a VAS and NRS, appears to be dependent on baseline values. Further evaluation in larger patient populations is required to prove its stability.
The authors have no conflicts of interest to declare.


 Click to show fullsize
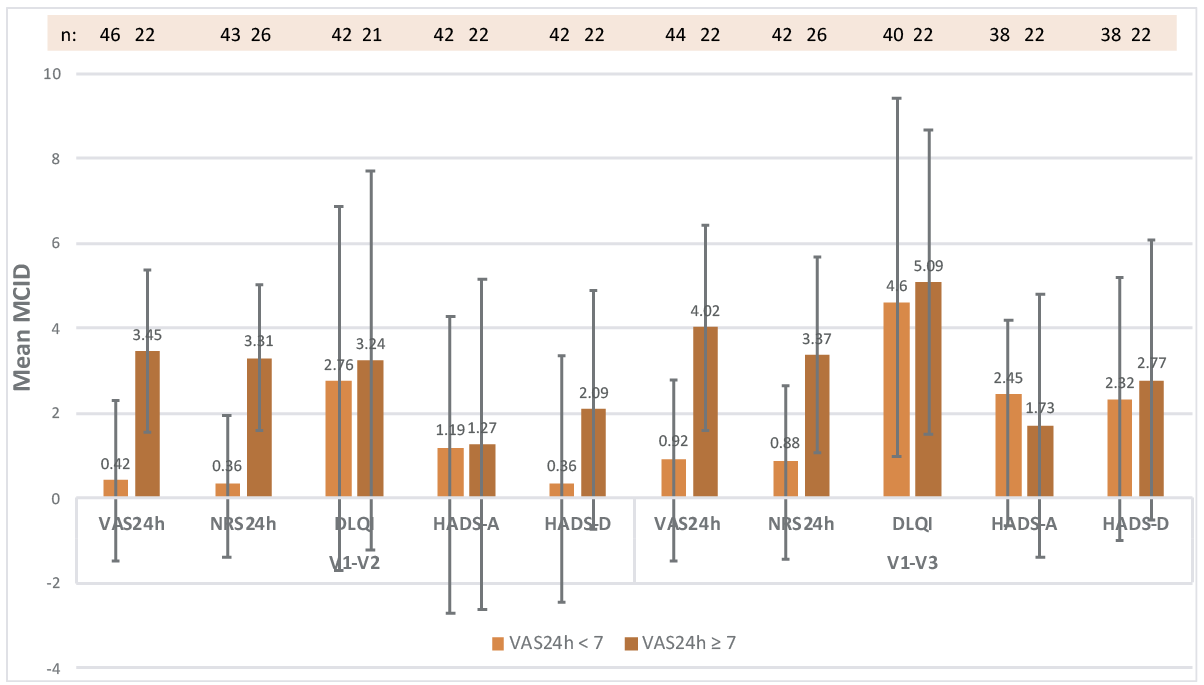 Click to show fullsize