Véronique H. Flamand, OT, MSc1,2*, Hugo Massé-Alarie, PT, MSc1,2 and Cyril Schneider, PhD1,2
From the 1Axe neurosciences du Centre de recherche du CHU de Québec, Clinical Neuroscience and neuroStimulation Laboratory, and 2Department of Rehabilitation, Faculty of Medicine, Université Laval, Québec City, QC, Canada
OBJECTIVE: To conduct a systematic review using validated critical appraisal scales to analyze both the quality and content of the psychometric evidence of spasticity measurement tools in cerebral palsy children and adolescents.
Data Sources: The literature search was performed in 3 databases (Pubmed, CINAHL, Embase) up to March 2012.
Study Selection: To be retained for detailed review, studies had to report on at least one psychometric property of one or many spasticity assessment tool(s) used to evaluate cerebral palsy children and adolescents.
Data Extraction: Two raters independently reviewed admissible articles using a critical appraisal scale and a structured data extraction form.
Data Synthesis: A total of 19 studies examining 17 spasticity assessment tools in cerebral palsy children and adolescents were reviewed. None of the reviewed tools demonstrated satisfactory results for all psychometric properties evaluated, and a major lack of evidence concerning responsiveness was emphasized. However, neurophysiological tools demonstrated the most promising results in terms of reliability and discriminating validity.
CONCLUSIONS: This systematic review revealed insufficient psychometric evidence for a single spasticity assessment tool to be recommended over the others in pediatric and adolescent populations.
Key words: systematic review; reliability; validity; assessment tools; muscle spasticity; cerebral palsy; rehabilitation.
J Rehabil Med 2013; 45: 14–23
Correspondence address: Véronique H. Flamand, OT, MSc, Axe neurosciences du Centre de recherche du CHU de Québec, 2705 Boul. Laurier, Local RC-9800, Québec, Qc, Canada, G1V 4G2. E-mail: veronique.flamand.1@ulaval.ca
Submitted March 9, 2012; accepted August 30, 2012
INTRODUCTION
Spasticity is a neuromuscular consequence of brain damage that is measured in various neurological populations as a velocity-dependent increase in muscle tone and exaggeration of the stretch reflex (SR) (1). Spasticity leads to movement limitations and thus largely contributes to the disruption of motor performance found in children diagnosed with cerebral palsy (CP), a permanent condition originating from a neurological disturbance that occurred in utero or during perinatal development (2). Futhermore, impairment of motor performance in CP disrupts functional achievement of daily activities (3), participation in recreational activities (4) and peer relationships (5). Among various forms of muscle overactivity, spasticity thus represents an important therapeutic target in rehabilitation in the attempt to optimize motor performance and increase the functional gains in children with CP (6).
Quantification of spasticity is of importance to portray the functional capacity of children with CP and to document changes after occupational and physical therapies. This neuromuscular deficit comprises complex spinal and cortical components and yet no consensus has been reached regarding its appropriate measurement. Numerous clinical and neurophysiological measurement tools have been developed for muscle spasticity assessment, but evidence is limited on their psychometric characteristics.
A systematic literature review recently addressed the psychometric properties of clinical assessment scales for spasticity and associated phenomena, and underlined that reliability data was missing for many scales (7). A hundred and ten articles were reviewed, but the procedure did not contain critical appraisal scales for analyzing the quality of the psychometric studies, which in turn would have allowed a more structured approach (8). It is now recognized that systematic reviews should not be limited to a narrative approach. Moreover, the scope of this previous review was not specific to psychometric properties of spasticity assessment tools and included a large range of scales on active and passive function, as well as functional clinical scales with an association with spasticity. Also, this review was not proper to spasticity found in a specific population, either based on a diagnosis (e.g. CP) or an age range (e.g. children and adolescents). Besides, no review was found in the literature addressing measures of spasticity specifically in children and adolescents. Given the growing importance attributed to reliability, validity and responsiveness for the selection of robust assessment tools, the purpose of the present study was to conduct a systematic review using validated critical appraisal scales to analyze both the quality and content of the psychometric evidences of spasticity measurement tools in children and adolescents with CP.
METHODS
The literature search was performed in 3 databases (Pubmed, CINAHL, Embase) using the following keywords and Medical Subject Headings (MeSH terms): (muscle spasticity[MeSH] OR (muscle AND spasticity) OR muscle spasticity OR spasticity) AND (Reproducibility OR Validity OR Validation OR Reliability OR Responsiveness OR Minimal detectable change OR Minimal clinically important difference OR Rasch OR Reproducibility of Results[MeSH] OR Validation Studies as Topic[MeSH] OR Evaluation Studies[Publication Type] OR Validation Studies[Publication Type]) AND (infant[MeSH] OR child[MeSH] OR adolescent[MeSH]). Articles published from late forties to March 2012 were included.
Study selection, quality assessment and data extraction
In order to determine eligibility, the lead author (VHF) reviewed title and abstract of each article for initial selection. Articles that met the following inclusion criteria were retained for full-length examination: [1] evaluated at least one spasticity assessment tool; [2] reported on at least one psychometric property; [3] written in French or English; [4] included children or adolescents (0–18 years old); [5] included participants with a CP diagnosis. Full articles were then screened a second time against the selection criteria to reconfirm eligibility. Two raters (VHF, HM-A) independently reviewed the admissible articles using a critical appraisal scale and a structured data extraction form to collect relevant information on study design (participants and assessment tools included) and on psychometric properties studied (reliability, validity and responsiveness). Definitions of the specific psychometric properties extracted for this systematic review are presented in Table I (based on Portney and Watkins) (9). For the critical appraisal of study design, 12 items (Table II) were rated on a 3-level scale (8). This critical appraisal tool has already been used in systematic reviews focusing on rehabilitation studies and consistently demonstrated high interrater reliability (8, 10–15). After independent evaluation by each rater, the raters compared scores and used a structured approach to reach consensus (reading the facts in the article, and discussing about standards). Studies were approximately rank ordered for quality in Table II. Weighted kappa and intraclass correlation coefficient were used to evaluate pre-consensus interrater agreement on individual items and interrater reliability of the total scores of the appraisal scale, respectively.
|
Table I. Definitions of psychometric properties discussed in this systematic review |
|
|
Psychometric properties |
Definitions |
|
Reliability |
|
|
Relative reliability |
Refers to the degree of consistency of a measurement. |
|
Intraclass correlation coefficient (ICC) |
Is a measure of relative reliability that reflects both correlation and agreement of data. ICC considered poor if ≤ 0.20; fair from 0.21 to 0.40; moderate from 0.41 to 0.60; good from 0.61 to 0.80; excellent if ≥ 0.81. |
|
Intrarater reliability |
Refers to the stability of the data recorded by the same rater across two or more trials. |
|
Interrater reliability |
Concerns the stability of the data recorded by two or more raters who measure the same group of subjects. |
|
Test-retest |
Indicates the extent to which a test is stable and is capable of measuring a variable with consistency when administered repeatedly. |
|
Absolute reliability |
Refers to the stability or precision of the measure. |
|
Standard error of measurement |
Is a measure of absolute reliability that represents the standard deviation of the measurement error. |
|
Coefficient of variation |
Is a measure of absolute reliability that assess the measure stability across repeated trials by looking at the variability which reflects the degree of measurement error. This ratio expresses the standard deviation as a proportion of the mean. |
|
Internal consistency |
Reflects the extent to which items for dichotomous variables are homogeneous and measure various aspects of the same characteristic and nothing else. Kuder-Richardson Formula 20 ≥ 0.90 is deemed acceptable at the group level. |
|
Validity |
|
|
Content validity |
Is studied to indicate the extent to which the universe of content that defines the variable of interest is adequately sampled by the items in the scale. |
|
Known-group validity |
Is studied to indicate the extent to which a tool discriminates between a group known to have a specific characteristic and a group known not to have this characteristic. |
|
Construct validity (convergent) |
Is studied to establish the ability of a tool to measure a priori defined construct and the extent to which it reflects the theoretical components of the construct. |
|
Criterion validity (concurrent) |
Is studied when the test to be validated is compared to a reference standard criterion test (gold standard), when the measurements are taken relatively at the same time (concurrently). |
|
Pearson/Spearman correlation coefficients (r) |
Pearson/Spearman coefficients reflect the degree of correlation and are considered poor if < 0.25; fair from 0.25 to 0.49; moderate to good from 0.50 to 0.75; good to excellent if > 0.75. |
|
Responsiveness |
Represents the ability of a tool to measure true clinical change over time. |
|
Table II. Quality of studies rated with critical appraisal scale of study design for psychometric articles |
||||||||||||
|
|
Evaluation criteriaa (maximal score = 2, minimal = 0) |
|||||||||||
|
Studies |
Item 1 |
Item 2 |
Item 3 |
Item 4 |
Item 5 |
Item 6 |
Item 7 |
Item 8 |
Item 9 |
Item 10 |
Item 11 |
Item 12 |
|
Fosang et al., 2003 (20) |
2 |
2 |
1 |
2 |
0 |
1 |
2 |
2 |
2 |
2 |
2 |
2 |
|
Schmartz et al., 2011 (39) |
2 |
2 |
1 |
2 |
0 |
2 |
2 |
2 |
2 |
1 |
2 |
2 |
|
Aarrestad et al., 2004 (30) |
2 |
1 |
1 |
2 |
0 |
NA |
2 |
2 |
2 |
2 |
2 |
2 |
|
Pierce et al., 2006 (36) |
2 |
2 |
1 |
1 |
0 |
NA |
2 |
2 |
2 |
2 |
2 |
2 |
|
Alhusaini et al., 2010 (18) |
1 |
2 |
2 |
2 |
0 |
NA |
2 |
2 |
2 |
2 |
1 |
2 |
|
Jobin & Levin, 2000 (40) |
1 |
2 |
2 |
2 |
0 |
2 |
1 |
2 |
2 |
2 |
0 |
2 |
|
Boiteau et al., 1995 (37) |
2 |
2 |
1 |
1 |
0 |
2 |
2 |
2 |
1 |
1 |
1 |
2 |
|
Mutlu et al., 2008 (21) |
2 |
2 |
1 |
1 |
0 |
1 |
2 |
2 |
2 |
1 |
2 |
1 |
|
Poon & Hui-Chan, 2009 (26) |
1 |
2 |
1 |
1 |
0 |
2 |
1 |
2 |
2 |
1 |
1 |
2 |
|
Yam & Leung, 2006 (19) |
2 |
1 |
1 |
0 |
0 |
NA |
2 |
2 |
2 |
1 |
1 |
2 |
|
White et al., 2007 (34) |
2 |
1 |
1 |
2 |
0 |
NA |
2 |
0 |
1 |
2 |
2 |
1 |
|
Nordmark & Andersson, 2002 (31) |
2 |
1 |
0 |
2 |
0 |
2 |
1 |
2 |
2 |
1 |
0 |
2 |
|
Clopton et al., 2005 (17) |
1 |
1 |
1 |
1 |
0 |
1 |
2 |
2 |
2 |
1 |
2 |
1 |
|
Jethwa et al., 2010 (25) |
1 |
1 |
1 |
1 |
0 |
NA |
2 |
2 |
1 |
1 |
1 |
2 |
|
Gracies et al., 2010 (22) |
0 |
2 |
1 |
1 |
0 |
2 |
1 |
2 |
2 |
1 |
0 |
2 |
|
Dvir et al., 1990 (35) |
1 |
1 |
1 |
0 |
0 |
NA |
2 |
2 |
2 |
1 |
0 |
2 |
|
Mackey et al., 2004 (23) |
1 |
2 |
1 |
0 |
0 |
2 |
2 |
2 |
1 |
0 |
0 |
2 |
|
van den Noort et al., 2009 (38) |
1 |
1 |
2 |
1 |
0 |
NA |
1 |
1 |
1 |
1 |
1 |
0 |
|
Kohan et al., 2010 (41) |
0 |
1 |
0 |
0 |
0 |
NA |
1 |
0 |
0 |
0 |
0 |
0 |
|
aItem 1: relevant background on psychometric properties and research question; Item 2: inclusion/exclusion criteria; Item 3: specific psychometric hypothesis; Item 4: appropriate scope of psychometric properties; Item 5: appropriate sample size; Item 6: appropriate retention/follow-up; Item 7: specific descriptions of the measures (administration, scoring, interpretation procedures); Item 8: standardization of methods; Item 9: data presented for each hypothesis or purpose; Item 10: appropriate statistical tests; Item 11: appropriate secondary analyses; Item 12: conclusions/clinical recommandations supported by analyses and results. NA: not applicable. |
||||||||||||
Description of the assessments
Many different types of assessment tools are addressed in this review. In order to facilitate the thorough discussion, the tools are grouped into 3 categories according to their nature: clinical scales, biomechanical and neurophysiological assessment tools.
Clinical assessment tools
Ashworth and Modified Ashworth Scales. The Ashworth and Modified Ashworth Scales (AS and MAS) are respectively 5- and 6-point ordinal scales qualifying the resistance (tone increase) of muscles to passive movement (16–21).
Tardieu and Modified Tardieu Scales. The Tardieu and Modified Tardieu Scales (TS and MTS) qualify the resistance of spastic muscles to passive stretching at three different velocities on a 6-point ordinal rating scale and measure two resulting joint angles using a goniometer: the angle of catch at which a muscle response (stretch reflex) is provoked by the fast velocity stretch (R1) and the angle of full passive range of motion obtained with low speed stretching (R2). The R2 minus R1 (R2–R1) value is thought to describe the level of dynamic contracture in the joint (18–20, 22–24).
Hypertonia Assessment Tool. The Hypertonia Assessment Tool (HAT) is a standardized 7-item assessment of the three types of pediatric hypertonia, i.e. spasticity (2 items), dystonia (3 items), and rigidity (2 items). Rating consists of scoring 0 (negative) or 1 (positive) for each item, a positive score for at least one item of the subgroup confirming the presence of this subtype of hypertonia (25).
Composite Spasticity Scale. The Composite Spasticity Scale comprises 3 measures: [1] a 5-point scale to grade Achilles tendon jerk; [2] a modified 8-point Ashworth Scale to quantify resistance to full-range passive ankle dorsiflexion at a fast speed; [3] a 4-point scale to grade clonus. The sum of the 3 scores (ranging from 0 to 16) reflects the status of ankle plantar flexors tone, thus describing spasticity as mild for scores from 0 to 9, moderate from 10 to 12, or severe for scores of 13 to 16 (26, 27).
Biomechanical assessment tools
Myotonometer. The Myotonometer (Neurogenic Technologies Inc, Missoula, MT, USA) is a recently developed portable electronic device that allows the quantification of muscle tone or stiffness (at rest) and muscle strength (during muscle contraction) by measuring the amount of muscle-tissue displacement per unit force applied by a hand-held probe pressed onto the muscle. This device provides a quantification of the level of severity of the spastic condition by analyzing/comparing both measurements (28–30).
Wartenberg pendulum test. The pendulum test quantifies lower limb hypertonia. The patient is in supine position with the leg maintained in full extension by the evaluator at the edge of the table. The test specifically consists of releasing the leg to drop and swing freely from the horizontal position. Recordings of muscle activity (surface electromyography) and knee angle (electrogoniometer) enables to measure different variables related to the swinging of the leg: the R2 ratio [amplitude of the first swing/amplitude of the final position], the R1 ratio [amplitude of the first swing/amplitude of the rebound angle], the maximal velocity of the first swing (Vmax), and the swing time, i.e. the time between the peaks (31–33).
Three-dimensional pendulum test (3D-pendulum). With a 3D motion analysis system, more variables from the pendulum test can be collected, such as the oscillation frequency (34).
Dynamometry. The resistive force of muscles is recorded with a simple uniaxial hand-held dynamometer (myometer) (35) or an isokinetic dynamometer (36) as the targeted muscle is passively stretched at a low then a high velocity (the therapist is passively moving the involved joint at different velocities towards the antagonist movement) (37).
Measures using goniometry. The passive range of movement (PROM) measured by goniometry is the angular distance that a joint can be moved by the therapist (no effort from the patient) from a position of relative muscle shortening to a position of relative muscle lengthening at slow velocity (to minimize the stretch reflex) (20, 38).
The angle of catch (AOC) is the angle at which a fast passive muscle stretching is abruptly stopped by a sudden increase of muscle activity and resistance (38).
Inertial sensors. Lightweight inertial sensors (containing accelerometers, gyroscopes, magnetic sensors) positioned on the proximal and distal segments of a joint can track motion during fast passive muscle stretching and provide an accurate measure of the AOC (38).
Stiffness tool with robotic-assisted gait orthosis. The stiffness tool (L-STIFF, implemented to a driven gait orthosis Lokomat; Hocoma AG, Volketswill, Switzerland) measures mechanical stiffness and produced torques in hip and knee during controlled passive movements at 3 different velocities during robotic-assisted gait training with partial body weight support (39).
Neurophysiological assessment tools
Electromyography (EMG). From maximal isometric voluntary contractions of dorsiflexors and/or plantarflexors (EMG recordings and apparatus at the ankle), mean maximal torque and co-contraction ratios are analyzed (26).
Tonic stretch reflex testing. Mechanical displacements of the joint (e.g. produced by a torque motor at different velocities) (40) provokes passive stretches of a given muscle group and EMG recordings enable the physiological measure of the stretch reflex threshold angles and velocities (26).
Hoffmann reflex of soleus muscle (H-reflex). The soleus H-reflex, the electrical analog of the stretch reflex, is obtained by anodal stimulation of the posterior tibial nerve (innervating soleus fibers) at the popliteal fossa. Small intensities of stimulation preferentially activate Ia fibers that excite alpha-motoneurons, thus giving rise to a reflex response in the soleus (myotatic reflex loop or H-wave as recorded by EMG at a mean of 30–33 ms after the stimulus depending on the subject’s height). Higher intensities also directly activate axons of alpha-motoneurons and give rise to direct activation of soleus (M-wave recorded 8–10 ms after the stimulation, M for ‘motor response’). The ratio of the maximal amplitudes of H-wave and M-wave (Hmax/Mmax) informs on the level of spinal excitability (41).
RESULTS
A total of 19 articles meeting all admissibility criteria were included (see Fig. 1 and Tables II and III). Overall, interrater reliability of the critical appraisal scale was good (intraclass correlation coefficient (ICC) = 0.92, 95% confidence interval = 0.80–0.97), with agreement on individual items ranging from moderate to excellent (κ = 0.44–1.0), except for items 7 and 8 with poor to fair agreement (κ = 0.35 and 0.20, respectively).
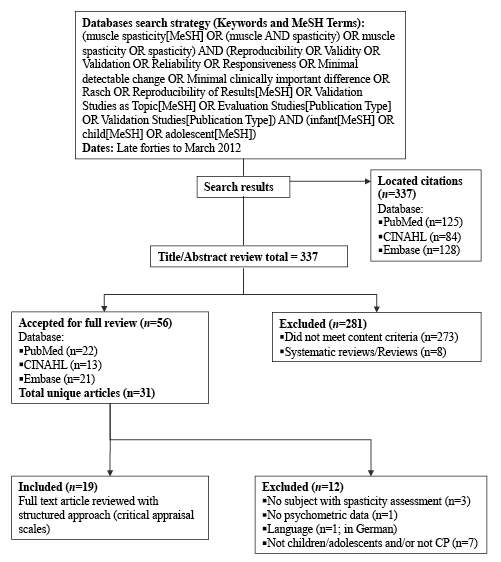
Fig. 1. Flowchart of the research strategy and systematic review evidence. MeSH: Medical subject headings; CINAHL: Cumulative index to nursing and allied health literature; CP: cerebral palsy.
|
Table III. Summary of studies |
||||
|
Studies |
Assessment tool(s) evaluated |
Population |
n |
Properties evaluated |
|
Dvir et al., 1990 (35) |
Myometer |
Children with CP (10 boys) from centers for child development and neurology. 7 quadri, 6 di. Age range: 3–5 years. |
13 |
Reliability |
|
Boiteau et al., 1995 (37) |
Myometer and isokinetic dynamo |
Children with CP. 7 di, 3 hemi. Mean age: 4.7 years. |
10 |
Reliability |
|
Jobin & Levin, 2000 (40) |
SR threshold |
Children with CP from schools for children with special needs and pediatric rehabilitation centers in Montreal, Canada. 10 hemi, 3 quadri, 1 di. Mean age: 11.1 years. Comparison group: children without CP (4 boys). Age range: 7–12 years. |
14 & 8 |
Reliability, validity |
|
Nordmark & Andersson, 2002 (31) |
Wartenberg pendulum test |
Children with CP (12 boys) with spastic diplegia who were selected for SDR between March 1996 and September 1999. Mean age: 4.3 years. GMFCS level I:1, level II:4, level III:4, level IV:10, level V:1. Comparison group: non-disabled children (7 boys). Mean age: 5.5 years. |
20 & 14 |
Reliability, validity, respons. |
|
Fosang et al., 2003 (20) |
MAS, MTS, PROM |
Children with CP (7 boys) from a local special school for children with physical disabilities and from CP clinics at the Royal Children’s Hospital, Melbourne, Australia. Mean age: 6 years 4 month. GMFCS level I:4, level II:1, level III:4, level IV:4, level V:5. |
18 |
Reliability |
|
Aarrestad et al., 2004 (30) |
Myotonometer |
Children with CP (6 boys) recruited following referral from local physicians and physical therapists. 5 hemi, 4 di, 1 quadri. Mean age: 8.3 years. |
10 |
Reliability |
|
Mackey et al., 2004 (23) |
MTS |
Children with CP (6 boys) with spastic hemiplegia from orthopaedic and neurological clinic lists and local schools with physical therapy units. Mean age: 9 years. GMFCS range: levels I and II. |
10 |
Reliability |
|
Clopton et al., 2005 (17) |
MAS |
Children (7 boys) with spasticity from the Lubbock Independent School District (LISD), Pediatric Therapy, Inc., the Early Childhood Intervention Program of LISD, the South Plains Rehabilitation Center, and the Owens-White Outpatient Rehabilitation Center in Lubbock, TX. 8 quadri, 5 di, 2 developmental delay, 2 traumatic brain injury. Mean age: 7 years.a |
17 |
Reliability |
|
Pierce et al., 2006 (36) |
Isokinetic dynamo |
Children with CP (7 boys) receiving care from the Shriners Hospitals for Children in Philadelphia, PA. 9 di, 5 hemi, 1 quadri. Mean age: 10.7 years. GMFCS level I:8, level II:2, level III:4, level IV:1. |
15 |
Reliability |
|
Yam & Leung, 2006 (19) |
MAS, MTS |
Children with CP (7 boys) from departments of Physiotherapy and Paediatrics and Adolescent Medicine in Alice Ho Miu Ling Nethersole Hospital, Hong Kong. 11 di, 4 tri, 2 hemi. Mean age: 7 years 9 month. GMFCS level I:9, level II:5, level III:3. |
17 |
Reliability |
|
White et al., 2007 (34) |
3D-pendulum test |
Children with CP with spastic diplegia. Mean age: 12 years. GMFCS level I:5, level II:4, level III:1. Comparison group: 10 healthy children. Mean age: 14 years. |
10 & 10 |
Reliability, validity |
|
Mutlu et al., 2008 (21) |
AS, MAS |
Children with CP (27 boys) with spastic diplegia. Mean age: 52.9 month. GMFCS level I:9, level II:20, level III:18. |
38 |
reliability |
|
Poon & Hui-Chan, 2009 (26) |
Composite Spasticity Scale, SR ratio, EMG analyses |
Study 1: Children with CP (5 boys) with spastic diplegia from 5 special schools in Hong Kong. Mean age: 10 years 2 month. GMFCS level II:4, level III:4. Comparison group: typically developing children (6 boys) recruited from a community center. Mean age: 8 years 10 month. Study 2: Children with CP (32 boys) from 5 special schools in Hong Kong. 54 di, 7 hemi. Mean age: 10 years 8 month. GMFCS level I:6, level II:27, level III:28. |
8 & 9; 61 |
Reliability, validity |
|
van den Noort et al., 2009 (38) |
Goniometer and inertial sensors |
Validation study: 1 healthy subject (26 y old). Goniometry study: Children with CP. Age range: 5–14 years. GMFCS range: levels I–IV. |
1; 20 |
Validity |
|
Alhusaini et al., 2010 (18) |
AS, TS |
Children with CP (17 boys) from the Physical Disability Service of The Children’s Hospital at Westmead, Australia. Mean age: 7 years. GMFCS range: levels I and II. |
27 |
Validity |
|
Gracies et al., 2010 (22) |
TS |
Phase 1: Children with CP (3 boys) from the neurology clinic at Texas Scottish Rite Hospital for Children. 2 di, 2 quadri, 1 hemi. Mean age: 10 years. Phase 2: Children with CP (7 boys) from the neurology clinic at Texas Scottish Rite Hospital for Children. 5 di, 5 para, 2 tri, 3 hemi. Mean age: 8 years. |
5; 15 |
Reliability |
|
Jethwa et al., 2010 (25) |
HAT |
Item reduction stage: Children with CP (19 boys) from a tertiary-level hypertonia clinic at a paediatric rehabilitation center. Mean age: 8 years 2 month. GMFCS level I:7, level II:5, level III:7, level IV:7, level V:8. Reliability and validity evaluation: Children with CP (15 boys) from a tertiary-level hypertonia clinic at a paediatric rehabilitation center (Ontario, Canada). Mean age: 10 years 8 month. GMFCS level I:4, level II:3, level III:7, level IV:4, level V:7. |
34; 25 |
Reliability, validity |
|
Kohan et al., 2010 (41) |
MAS |
Children with CP (4 boys) with hemiplegia. Age range 4–6 years. |
11 |
Validity |
|
Schmartz et al., 2011 (39) |
L-STIFF |
Children with CP (5 boys) from the in- and outpatient setting of the Rehabilitation Centre Affoltern am Albis, University Children’s Hospital Zurich, Switzerland. 7 quadri, 1 hemi, 1 di, 1 spastic dyskinetic. Age range: 4.0–14.5 years. GMFCS level II:1, level III:5, level IV:2, level V:1 (no data for 1 child). |
10 |
Reliability, respons. |
|
aStudy included because > 75% of the population has a diagnosis of CP. CP: cerebral palsy; quadri: quadriparesic CP; di: spastic diparesic CP; hemi: hemiparesic CP; tri: triparesic CP; para: paraparesic CP; dynamo: dynamometer; SR: stretch reflex; SDR: selective dorsal rhizotomy; GMFCS: Gross Motor Function Classification System; respons.: responsiveness; (M)AS: (Modified) Ashworth Scale; (M)TS: (Modified) Tardieu Scale; PROM: passive range of movement; EMG: electromyography; HAT: Hypertonia Assessment Tool; L-STIFF: stiffness tool (implemented to a robotic-assisted gait orthosis). |
||||
Validity
Content validity. The HAT is the only clinical tool for which content validity was reported (25). In the item generation stage, a pool of 14 items was produced from discussion with members of the National Institutes of Health Task Force on Childhood Motor Disorders, from small group sessions, and from individual interviews with professionals experienced in pediatric hypertonia. Afterwards, the item reduction stage was based on internal consistency of items and on individual item validation (i.e. items that had > 50% agreement with the type of hypertonia diagnosed by the pediatric neurological examination were retained). The final revised version of the HAT comprises 7 items in total.
Criterion validity. Very little evidence exists on the concurrent criterion validity of spasticity assessment tools. Alhusaini et al. (18) compared both the AS and TS with a combination of EMG and biomechanical measurements (considered a reference standard derived through laboratory measures). They showed a significantly good agreement (κ = 0.73, p < 0.001) of the TS with the laboratory measures (in correctly identifying the presence of spasticity in the ankle plantarflexors) but a marginally fair agreement (κ = 0.24, p = 0.057) of the AS with the laboratory measures. The spasticity subscale of the HAT was also tested for concurrent validity and moderate to good agreement with the neurological diagnosis made by a specialist were reported (prevalence-adjusted bias-adjusted Kappa (PABAK) range 0.57–0.74) (25). Finally, Jobin & Levin (40) observed that lower values of elbow flexors SR thresholds were marginally associated with higher levels of clinical spasticity measured with a modified version of the Composite Spasticity Scale (r = 0.39, p > 0.05).
Convergent construct validity
Clinical assessment tools. The R2 measured with the TS during slow velocity stretch correlated with PROM measured with laboratory measures (Pearson r = 0.49, p = 0.009), thus making the authors suggest that the TS is able to characterize the severity of contracture (18).
Biomechanical assessment tools. Evidence on construct validity supports that the relative swing time measured by the pendulum test was distinct from, but somewhat related to, gross motor function (Table V) (31). van den Noort et al. (38) evaluated correlations between the AOC measured after repositioning with a goniometer, the AOC measured by inertial sensors simultaneously to the goniometer and the AOC measured by inertial sensors as the angle of maximal joint angular deceleration during fast passive stretch (considered the true AOC) for 3 muscles. Higher correlations were observed between measures with the goniometer and the inertial sensors collected simultaneously as well as between both measures with the inertial sensors (0.65 ≤ r ≤ 0.95) compared to correlations between measures with the goniometer and true AOC (0.43 ≤ r ≤ 0.70).
Neurophysiological assessment tools. Poon & Hui-Chan (26) found fair correlations between stretch reflex and EMG measurements (0.27 ≤ r ≤ 0.48). Among others, they observed that children with more hyperactive plantarflexor stretch reflex (as denoted by larger soleus SR expressed in percentage of M-response areas) also had larger plantarflexion co-contraction ratios and smaller plantar- and dorsiflexion torques. Finally, the only paper reporting no significant correlation between the MAS and the H-reflex did not mention the types of coefficients calculated, the values obtained, nor the benchmarks to which they referred, and thus presented an evident lack of methodological quality (41).
Known-group validity
Overall, evidence supports the ability of the pendulum test and neurophysiological tools (SR and EMG analyses) to differentiate between CP and typically developing children (Table V). Nordmark & Andersson (31) detected significant differences between CP preoperatively and typically developing children for all 4 parameters of the pendulum test (p < 0.001). White et al. (34) also detected such differences for all 13 variables measured with the 3D-pendulum test (p < 0.001 to p < 0.01). Poon & Hui-Chan (26) reported that stretch reflex and EMG measurements were able to detect differences between CP and typically developing children during both dorsi- and plantarflexion movements (Table V). Finally, Jobin & Levin (40) reported that elbow flexor muscles presented SR at all 7 velocities of torque motor-induced passive stretches in children with CP whereas no EMG response was obtained in children without CP, even at the higher velocity tested.
|
TableV. Validity of assessment tools for spasticity. |
|
|
Tools |
Known-group validity |
|
Pendulum test |
Detected differences between CP preoperatively (mean R2 ratio = 1.03 and 1.10, mean R1 ratio = 1.51 and 1.88, mean Vmax = 244 and 260o/s, mean relative swing time = 0.50 and 0.59 s) and non-disabled children for both legs (mean R2 ratio = 1.86 and 1.82, mean R1 ratio = 4.01 and 3.78, mean Vmax = 388 and 392o/s, mean relative swing time = 1.00 and 1.00 s, p < 0.001). |
|
3D-pendulum test |
Detected differences between CP (mean max knee flexion angular v = 201.82o/s; mean time to max knee flexion angular v = 0.23 s; mean number of oscillations = 4.3; mean duration of knee motion = 2.60 s; mean oscillation frequency = 1.89 Hz; mean sagittal plane integral = 25.08o/s; mean transverse plane integral = 5.75o/s; mean frontal plane integral = 8.39o/s; mean difference A0 [rest knee angle – start knee angle] = 44.00o; mean difference A1 [max knee angle – start knee angle] = 49.78o; mean relaxation index R1 = 1.93; mean ratio R2 [A1/A0] = 1.08; mean normalized relaxation index R2n [A1/(1.6 × A0)] = 0.68) and able-bodied children (292,51o/s; 0.34s; 6.9; 6.60 s; 1.05 Hz; 84.51o/s; 12.25o/s; 24.95o/s; 61.14o; 105.14o; 4.16; 1.73; 1.08; p < 0.01).a |
|
SR ratio |
Detected larger ratios [soleus SR/M-response area] for CP (mean value = 108.7%) compared to typically developing children (mean value = 9.6%, p = 0.001). |
|
EMG analyses |
Detected smaller max torques but larger EMG co-contraction ratios for CP (mean values = 0.1–0.2 Nm/kg, 35.0–35.8%) compared to typically developing children (mean values = 0.4–1.0 Nm/kg, 13.9–18.9%, p = 0.001–0.004). |
|
SR threshold (λ) |
Elbow flexor muscles responded to stretch at all velocities in children with CP but not in children without CP (no EMG responses even at the higher velocity). |
|
Tools |
Convergent construct validity |
|
TS |
The R2 measured with TS during the slow velocity stretch correlates with the PROM determined using laboratory measures (Pearson r = 0.49, p = 0.009). |
|
Pendulum test |
Preoperatively, the R2 ratio correlates with the quadriceps reflex (right leg: Spearman r = –0.626, p = 0.003; left leg: Spearman r = –0.566, p = 0.014), the relative swing time correlates with the GMFCS (Spearman r = –0.584, p = 0.007), the relative swing time correlates with the GMFME (Spearman r = 0.614, p = 0.004). |
|
SR ratio and EMG analyses |
Larger ratios [soleus SR/M-response areas] were correlated to larger plantarflexion co-contraction ratios (Pearson r = 0.28, p = 0.03) and both smaller plantar- and dorsiflexion torques (r = –0.48, p = 0.001 and r = –0.27, p = 0.04, respectively). Larger plantarflexion co-contraction ratios were correlated to smaller plantarflexion torques (r = –0.47, p = 0.001). Smaller plantarflexion torques were correlated to smaller dorsiflexion torques (r = 0.48, p = 0.001). |
|
Goniometer and inertial sensors (IS) |
The AOC measured after repositionning with the goniometer highly correlates with the AOC measured by the IS simultaneously to the goniometer for the hamstrings (Pearson r = 0.95), soleus (r = 0.84) and gastrocnemius (r = 0.71). |
|
The AOC measured by the IS simultaneously to the goniometer highly correlates with the AOC measured by the IS as the angle of max joint angular deceleration during the fast passive stretch (i.e. the true AOC) for the soleus (Pearson r = 0.75) and gastrocnemius (r = 0.71), and moderately for the hamstrings (r = 0.65). |
|
|
The AOC measured after repositionning with the goniometer fairly correlates with the AOC measured by the IS as the angle of max joint angular deceleration during the fast passive stretch (i.e. the true AOC) for the gastrocnemius (Pearson r = 0.43), and moderately for the hamstrings (r = 0.56) and soleus (r = 0.70). |
|
|
Tools |
Criterion validity (concurrent) |
|
AS |
Lack of agreement between AS and laboratory measures (PEA = 81.5%, κ = 0.24, p = 0.057) to identify the presence of spasticity. |
|
TS |
TS can identify the presence of spasticity (PEA = 88.9%, κ = 0.73, p < 0.001) and contracture (PEA = 77.8%, κ = 0.503, p = 0.008) when compared to laboratory measures. |
|
HAT |
Statistical agreement of the spasticity subscale compared with the neurological diagnosis made by a paediatric neurologist with expertise in movement disorder was adequate (PABAK ranging from 0.57–0.74). |
|
SR threshold (λ) |
Correlation between λ and clinical spasticity (measured with a modified version of the Composite Spasticity Scale) did not reach a significant level (r = 0.39, p > 0.05). |
|
aData of the right leg described. CP: cerebral palsy; v: velocity; SR: stretch reflex; EMG: electromyography; TS: Tardieu scale; PROM: passive range of movement; GMFCS: Gross Motor Function Classification System; GMFME: Gross Motor Function Measure, dimension E; AOC: angle of catch; AS: Ashworth scale; PEA: percentage exact agreement; HAT: Hypertonia Assessment Tool; PABAK: prevalence-adjusted bias-adjusted Kappa. |
|
Reliability
Intrarater reliability. Jethwa et al. (25) reported excellent intrarater reliability of the spasticity subscale of the HAT (PABAK = 1.0). Mutlu et al. (21) reported intrarater ICC scores ranging from fair to excellent (0.31–0.83) for the AS and MAS (Table IV). However, Clopton et al. (17) found good intrarater reliability of the MAS only for the hamstrings (ICC = 0.80), whereas moderate for all other muscles (elbow flexors, hip adductors, quadriceps, gastrocnemius, soleus; ICCs = 0.54–0.67), while Fosang et al. (20) reported fair to excellent ICCs (0.21–0.85). The later also reported moderate to excellent intrarater reliability for PROM measured with a goniometer and for MTS (ICCs ranges 0.55–0.97 and 0.38–0.93, respectively), with comparable standard errors of measurements for PROM and MTS (SEMs = 2.1–9.6o) (20). Mackey et al. (23) investigated the intrarater reliability of the MTS for the assessment of biceps spasticity, in particular the elbow joint angles R1 and R2 measured by 3D-kinematic analysis. They determined the median absolute difference between two measures taken in the same session and between measures taken in two different sessions (range 3–130), with measurement errors of up to 25–300 in some participants at the fastest velocity. Gracies et al. (22) used agreement rates to express the intrarater reliability of the TS for experienced raters without formal training, for nonexperienced raters after training and for experienced raters after training (77 ± 13%, 80 ± 14%, 90 ± 8%, respectively). Aarrestad et al. (30) reported excellent intrarater reliability for the use of the myotonometer to assess spasticity of the biceps brachii and medial gastrocnemius muscles (ICCs ranges 0.82–0.99 and 0.88–0.99, respectively). Pierce et al. (36) found excellent reliability of the isokinetic dynamometer for measuring spasticity of knee flexors and extensors at high velocity muscle stretching (ICCs = 0.80–0.84), and fair to moderate reliability for 2 slower movement velocities (ICCs = 0.31–0.51). The authors stated that the 95% limits of agreement of Bland-Altman plots contained most data points (93.3%), but that these limits were wide. Finally, Boiteau et al. (37) have shown good to excellent intrarater reliability using both a myometer and an isokinetic dynamometer to measure the resistance of ankle plantarflexors (ICCs ranges 0.791–0.901 and 0.838–0.841, respectively), and also reported relatively low coefficients of variation (CVs 13.2–13.9% and 11.8–12.8%, respectively).
|
Table IV. Reliability of assessment tools for spasticity |
|||||||||||||||||||||||
|
Relative reliabilitya |
Absolute reliability |
||||||||||||||||||||||
|
Intrarater |
Interrater |
Test-retest |
Intrarater SEM |
Interrater SEM |
Test-retest CVs (in %) |
||||||||||||||||||
|
Range |
n |
# |
|
Range |
n |
# |
|
Range |
n |
# |
|
Range |
n |
# |
|
Range |
n |
# |
|
Range |
n |
# |
|
|
AS |
0.31–0.82 |
30 |
1 |
0.54–0.80 |
38 |
1 |
|||||||||||||||||
|
MAS |
0.21–0.85 |
75 |
4 |
0.27–0.87 |
90 |
4 |
|||||||||||||||||
|
TS |
49–100c |
20 |
1 |
43–100c |
20 |
1 |
|||||||||||||||||
|
MTS |
0.38–0.93 |
18 |
1 |
0.22–0.74 |
35 |
2 |
2.1–9.6o |
18 |
1 |
4.2–9.6o |
18 |
1 |
|||||||||||
|
Spasticity subgroup of HAT |
1.0b |
25 |
1 |
0.65b |
25 |
1 |
|||||||||||||||||
|
Composite Spasticity Scale |
0.97 |
8 |
1 |
||||||||||||||||||||
|
PROM with gonio |
0.55–0.97 |
18 |
1 |
0.62–0.78 |
18 |
1 |
3.2–9.3o |
18 |
1 |
5.3–7.8o |
18 |
1 |
|||||||||||
|
Pendulum |
3–47 |
14d |
1 |
||||||||||||||||||||
|
3D-pendulum |
0.60–0.98 |
20e |
1 |
||||||||||||||||||||
|
Myometer |
0.79–0.90 |
10 |
1 |
0.77–0.94 |
13 |
1 |
13.2–13.9g |
10 |
1 |
||||||||||||||
|
Isokinetic dynamometer |
0.31–0.86 |
25 |
2 |
11.8–12.8g |
10 |
1 |
|||||||||||||||||
|
Myotonometer |
0.82–0.99 |
10 |
1 |
0.74–0.99 |
10 |
1 |
|||||||||||||||||
|
L-STIFF |
0.83–0.97 |
9 |
1 |
f0.018– 0.085Nm/o |
9 |
1 |
9.5–43.5h |
9 |
1 |
||||||||||||||
|
EMG analyses |
0.78–0.96 |
17e |
1 |
||||||||||||||||||||
|
SR threshold λ |
0.73 |
14 |
1 |
1.2–37 |
14 |
1 |
|||||||||||||||||
|
SR ratio |
|
|
|
|
|
|
|
|
0.91–0.97 |
17e |
1 |
|
|
|
|
|
|
|
|
|
|
|
|
|
aRelative reliability values reported are ICCs, if not otherwise specified. bPABAK or cpercentage agreement expressed in % (not ICCs), dOnly non-disabled children and emixed CP and non-disabled children, fTest-retest SEM (and not intrarater) and gIntrarater CVs (and not test-retest), hCoefficient of variation of the method error. SEM: standard error of the measure; CV: coefficient of variation; n: number of participants; #: number of studies; AS: Ashworth scale; MAS: Modified Ashworth scale; TS: Tardieu scale; MTS: Modified Tardieu scale; HAT: Hypertonia Assessment Tool; PROM: passive range of movement; gonio: goniometer; EMG: electromyography: SR: stretch reflex. |
|||||||||||||||||||||||
Interrater reliability. Interrater reliability was reported to be good for the spasticity subscale of the HAT (PABAK = 0.65) (25), and moderate to good for the AS (ICCs = 0.54–0.80) (21). The interrater reliability of the MAS was assessed in more studies and was shown to be fair to moderate (ICCs = 0.27–0.56) (20), moderate to good (ICCs = 0.41–0.73) (19), or good to excellent (ICCs = 0.61–0.87) (21). More precisely, Clopton et al. (17) distinctly assessed the interrater reliability of the MAS for different muscles and found good ICCs for the elbow flexors and hamstrings (both 0.79), moderate for the gastrocnemius (ICC = 0.45), and fair for other muscles (hip adductors, quadriceps, soleus; ICCs = 0.33–0.40). Reliability of the MTS was found to be fair to good (ICCs = 0.17–0.74) (19), or moderate to good (ICCs = 0.55–0.74) (20). Fosang et al. (20) also reported good interrater reliability for PROM measured with a goniometer (ICCs = 0.62–0.78), and comparable SEMs for PROM and MTS (ranging from 4.2 to 9.6o). Gracies et al. (22) used agreement rates to express the interrater reliability of the TS for experienced raters without formal training, for nonexperienced raters after training and for experienced raters after training (66 ± 15%, 74 ± 16%, 81 ± 13%, respectively). Good to excellent interrater reliability was reported for the myometer measuring the resistance to ankle dorsiflexion (ICCs = 0.77–0.94) (35). Finally, Aarrestad et al. (30) found good to excellent reliability of the myotonometer for the assessment of spasticity in the biceps brachii (ICCs = 0.74–0.99), whereas excellent reliability when the myotonometer was used for the medial gastrocnemius muscles (ICCs = 0.84–0.99).
Test-retest reliability. Test-retest reliability refers to studies in which the rater was considered not to have an influence on data or if it was not specified whether the same or multiple rater(s) performed the assessment in both test and retest. Reproducibility was reported to be excellent for the L-STIFF (ICCs = 0.83–0.97) (39), as well as for the Composite Spasticity Scale, the plantarflexion SR analyses and the EMG measurements in both CP and typically developing children (ICCs = 0.78–0.97) (26). SEM and CV of the method error (CVME) were also reported as absolute reliability indices for the L-STIFF, and indicated 0.028–0.085 Nm/o and 9.5–23.0% of test-retest variability in hip as well as 0.018–0.064 Nm/o and 13.3–43.5% in knee measurements (39). Nordmark & Andersson (31) expressed the test-retest reliability of the 4 parameters of the Wartenberg pendulum test in typically developing children with CVs (ranging from 3–47%), and reported that the relative swing time displayed the lowest CVs (3 and 4% depending on the leg). Good to excellent reliability was found for all 13 variables measured with the 3D-pendulum test in both CP and able-bodied children (ICCs = 0.60–0.98) (34). Jobin & Levin (40) stated that the kinematics (velocity and angular displacement) and the elbow flexors EMG response onsets were highly reproducible for a given velocity of stretch (correlations between individual pairs of velocity and angle traces, r = 0.99–1.0); they also provided CVs for threshold angles and velocities at the fastest stretch (respectively 1.2–37.0% and 3.6–31.4%) and wrote that similar stability of dynamic thresholds was found for each velocity of stretch. Finally, they observed good test-retest reliability for the SR threshold λ (ICC = 0.73).
Internal consistency. The initial Kuder-Richardson Formula 20 (KR-20) for the spasticity items of the HAT demonstrated moderate internal consistency (α = 0.58), and elimination of Item 12 in the item reduction stage increased the internal consistency index (KR-20α = 1.0) (25).
Responsiveness
Only two studies evaluated the responsiveness of spasticity assessment tools in children and adolescents with CP, thus providing very limited evidence overall. Changes in scores were analyzed using a pre-/post-intervention design, but global ratings of change and responsiveness indices (such as effect size and standardized response mean) were not used. Precisely, Schmartz et al. (39) (first study) used one-tailed Wilcoxon signed rank test to determine statistical changes before and after a single session of robotic-assisted gait training and found significant decrease of muscle stiffness for 20 out of 24 hip and knee measurements with the L-STIFF (p < 0.01), with the most important reductions noted in the more severely disabled children. According to the authors, almost all stiffness reductions can be considered real changes after the intervention because they exceeded the measurement error. Nordmark & Andersson (31) (second study) used paired two-tailed Student t-test and demonstrated significant improvements in all 4 parameters of the pendulum test 6 months after selective dorsal rhizotomy when compared to preoperative values (p < 0.001).
Administration burden
Administration burden refers to the time taken to complete an assessment or to analyze the results. No specific report on this characteristic was found for the spasticity assessment tools included in this review, but two studies briefly tackled the question. It was mentioned that data acquisition with the myotonometer required less than 5 min (30), and that the myometer was simpler, cheaper, and required less time for data collection and analysis than a computer-controlled dynamometer (37).
DISCUSSION
This systematic review focused on evaluating the quality and content of the psychometric properties of spasticity assessment tools in children and adolescents with CP. To this end, validated critical appraisal scales were used to review the 19 studies that met the eligibility criteria. The methodological quality was moderate to adequate for the majority of the studies. The small sample size of all studies was the most limiting factor in terms of quality of study design. It is noteworthy that no study included had an excellent rating on the quality scale. The review comprised many types of tools, from ordinal clinical scales to biomechanical and neurophysiological tests. Thus, our systematic review provides a comprehensive and accurate view of the measurement properties of all those types of spasticity assessments in children and adolescents with CP.
Overall, the systematic review points out that little evidence exists on psychometric properties of spasticity assessment tools in the CP population. None of the reviewed tools demonstrated satisfactory results for all evaluated psychometric properties. Relative reliability was the most studied property, and for most tools, data on absolute reliability, validity and responsiveness were insufficient. The major lack of evidence concerns responsiveness that was addressed in only two studies. In addition, these two studies did not use global ratings of change, thus only tested changes that were statistically significant, and did not inform on the sensitivity to changes ‘clinically significant’. Data are also missing for the administration burden of the tools.
Contrasting results have been observed for the relative reliability of clinical ordinal scales such as the AS, MAS, TS and MTS, and mostly low to moderate ICCs were reported (17, 19, 21). These rating scales are single item scales, which generate scores that are ordinal, not interval data. For example, a degree of spasticity described grade 3 on the MAS (considerable increase in muscle tone) is not necessarily three times greater than a grade 1 (slight increase in muscle tone), thus illustrating that the ranges between the scores are not in equal proportions (non-linear). Single item scales are often ambiguous because the actual ‘interval’ across the grades is not determined (42), thus these artificial ranges have an impact on reliability. Moreover, inappropriate mathematical manipulation of the ordinal data may provide statistical results that are misleading (43). Indeed, in the present review, studies about the ordinal AS, MAS, TS and MTS used ICCs, which is of concern because relative reliability of ordinal data should preferably be assessed with Kappa statistic (9). In addition, anatomical and biomechanical factors of muscles and joints seemed to have an impact on reliability, based on ICCs variations depending on the muscle groups tested (17, 21). Training of the raters also seemed to have an impact on reliability (22). The psychometric properties of these spasticity scales are also highly questioned in adult neurological populations and were even demonstrated to lack reliability and validity (24). As an example, Kumar et al. (44) concluded that the MAS is not a valid ordinal level measure of spasticity in patients with stroke. In fact, the substantial difficulties related to spasticity quantification may be due to the complex nature of spasticity itself. Poor validity thus arises because it is not obvious to represent such a complex construct with a single question ‘Rate the increase in muscle tone’ (42). Such ordinal scales might not be specific and accurate enough to assess the neuromuscular characteristics of the spasticity phenomenon. In addition, there are no standardized guidelines for the use of these scales in clinical settings that would help reduce potential sources of misinterpretation and thus enhance fidelity (45). Therefore, additional psychometric studies are needed to assess whether these ordinal scales can provide valid information on the different spinal and cortical components of spasticity. The biomechanical and neurophysiological tools such as the Pendulum test, the dynamometers, and the stretch reflex and EMG analyses did present higher relative reliability than previous ordinal scales. Finally, even if data on absolute reliability were missing, at that point, the only tools with acceptable response stability were the myometer and isokinetic dynamometer.
Data on all types of validity are currently missing. For known-group validity, the Pendulum test and stretch reflex and EMG analyses were able to detect significant differences between CP and typically developing children. Otherwise, concerning convergent construct validity and concurrent criterion validity, mostly moderate relations (0.5 < r < 0.7) were observed when comparing data collected with different types of spasticity assessment tools, thus denoting that these tools were distinct from each other, but somewhat related to similar neuromuscular components.
As for responsiveness, the only information provided is that the Pendulum test and the L-STIFF detected statistically significant changes before and after an intervention aimed at reducing spasticity (31, 39). There is an evident need for studies with global ratings of change and with responsiveness indices (such as effect size or standardized response mean) to inform on the ability of spasticity assessment tools to detect clinically meaningful changes over time in the CP pediatric population.
In conclusion, a large number of spasticity assessment tools have been developed, each differing in terms of parameters and spasticity components measured. In a clinical setting, spasticity is still typically assessed by measuring the resistance to imposed passive movement of the limb through the available range of motion, as done with the MAS and MTS (21). These scales present however a substantial lack of good psychometrics. Indeed, the use of ordinal scales as outcome measures in research and clinical practice has come under increased scrutiny in recent years, and the suggestion that they give an outcome of poor accuracy and reliability is gaining support (42). Although there is currently insufficient psychometric evidence to recommend one tool over the others, the present systematic review highlighted that the neurophysiological assessments of spasticity were the most promising in terms of reliability and discriminating validity. However, their applicability for clinical use remains an issue (cost, equipment, time required). Nevertheless, combining different tools with ‘good to excellent’ psychometric properties might be a solution for a more complete portrait and more valid quantification of spasticity. For example, and on the basis of the present reviewed data, it would be interesting to evaluate the psychometrics of the combined recordings of EMG (stretch reflex, co-contractions, H-reflex), electrogoniometric (PROM, AOC) and myometric data (resistance to passive stretch), that could inform on instantaneous changes of muscular, neural and biomechanical components of spasticity. Given the importance of spasticity assessment for accurate evaluation of the functional capacity and appropriate intervention in children and adolescents with CP, studies with larger sample sizes are required to validate these tools in this specific pediatric population. Future research should also pursue the efforts to address all psychometric properties of spasticity assessment tools, with a special focus on responsiveness.
ACKNOWLEDGEMENTS
The authors gratefully thank Drs Jean-Sébastien Roy and Luc Noreau for constructive comments on a draft of the manuscript. Véronique H Flamand is supported by the Fonds de la Recherche en Santé du Québec (PhD studentship) and Hugo Massé-Alarie is supported by a PhD studentship from Université Laval (Faculty of Medicine and research funds from the senior author).
REFERENCES

