Franco Franchignoni, MD1, Andrea Giordano, PhD2, Gianpaolo Ronconi, MD3, Alessia Rabini, MD3 and Giorgio Ferriero, MD1
From the Units of 1Occupational Rehabilitation and Ergonomics and 2Bioengineering, Salvatore Maugeri Foundation, Clinica del Lavoro e della Riabilitazione, IRCCS, Veruno (NO) and 3Department of Geriatrics, Gerontology and Physiatrics, University Hospital “Agostino Gemelli”, Catholic University of the Sacred Heart, Rome, Italy
OBJECTIVE: To analyse in patients with Parkinson’s disease the psychometric performance of the Activities-specific Balance Confidence scale (ABC) and its 3 short versions, using both a classical test theory approach and Rasch analysis.
METHODS: A sample of 217 patients with Parkinson’s disease was assessed by ABC and the 3 short versions: Berg Balance Scale, Fear of Falling Measure, and the Unified Parkinson’s Disease Rating Scale.
RESULTS: Cronbach’s α was 0.95 in ABC, and ranged from 0.88 to 0.90 in its short versions. At Rasch analysis the 11 original rating categories were collapsed to 5 levels. In ABC 15 out of 16 items fitted the Rasch model. The ABC showed high correlation only with Fear of Falling Measure (r = 0.85), and excellent correlation with its short versions (r > 0.93). The 3 short versions showed a limited range of item difficulty estimates, low reliability levels, floor effect, a mismatch between mean item difficulty and mean ability of the patients.
CONCLUSION: In patients with Parkinson’s disease: (i) the ABC has an adequate unidimensionality; (ii) the selection of its items is satisfactory, although there is room for some minor refinement; (iii) the 0–10 rating scale should be simplified, and a 5-level response format seems able to improve the measurement qualities of the scale; (iv) the 3 short versions showed some psychometric limitations in comparison with the ABC.
Key words: balance confidence; fear of falling; Parkinson’s disease; psychometrics.
J Rehabil Med 2014; 46: 00–00
Correspondence address: Franco Franchignoni, Scientific Institute of Veruno, Salvatore Maugeri Foundation, Via Revislate 13, I-28010 VERUNO (NO), Italy. E-mail: franco.franchignoni@fsm.it
Accepted Jan 10, 2014; Epub ahead of print Mar 28, 2014
Introduction
Postural instability is a key feature of advanced Parkinson’s disease (PD) (1), often leading to falls with dramatic consequences (2). Balance impairment can also induce psychological reactions, such as reduced balance confidence and increased fear of falling. Balance confidence (a construct exploring fall-related self-efficacy) and fear of falling may be protective if they interfere only with hazardous activity and increase caution in performing daily living tasks. On the other hand, they can be maladaptive if their effect is to restrict mobility, independence and social participation, leading to further deconditioning, functional decline and poorer quality of life (3). Therefore, balance confidence is a construct that needs to be clearly understood, accurately measured, and requires timely, appropriate management within fall risk assessment and fall prevention programmes (4).
Balance confidence is often analysed with the Activities-specific Balance Confidence scale (ABC) (5), which has been shown to have sound psychometric properties in older adults (5, 6) and people with lower-limb amputations (7, 8) and stroke (9). In subjects with PD, the ABC has only recently been validated (10), by means of a Classical Test Theory approach, while the short versions of ABC proposed for PD (11–13) have undergone only preliminary validation.
However, the Classical Test Theory approach does not take into account some standard criteria and attributes (concerning both single items and total score) that need to be considered when evaluating the measurement properties of a tool (14). Rasch analysis is being increasingly recommended in the development and evaluation of clinical tools for healthcare to verify if they comply with the theoretical requirements of measurement, including dimensionality analysis and item-level scale evaluation (15).
The aim of this study was to analyse the psychometric properties of the ABC and its 3 short versions in subjects with PD, using both Classical Test Theory and Rasch analysis, in order to determine whether fundamental measurement properties are satisfied and to provide insights into the optimal use of these questionnaires.
Methods
Patients
Participants were a consecutive sample of 217 patients with PD (mean age 71 years, age range 48–83 years; mean disease duration 8 years, range 1–23 years; patients with motor fluctuations 57%; 46% males) referred to our Rehabilitation Institute. The diagnosis of PD was made by a neurologist according to the UK PD Society Brain Bank criteria (16). Patients scoring below 24 on the Mini-Mental State Examination (MMSE) were excluded. All patients were tested in the morning, 60–120 min after their first morning drug intake.
The study was approved by the local ethics committee. Participants were informed about the experimental protocol and gave written consent prior to data collection.
Assessments
Patients were assessed with the ABC (5), a self-report 16-item questionnaire that asks people to score their perceived level of balance confidence when performing common indoor and outdoor activities of daily living. Each item was scored on an 11-level rating scale, from 0% (no confidence) to 100% (full confidence in performing the activity without losing balance). The total ABC score is the mean sum of the individual item scores. The translation and cultural adaptation of the Italian version of the ABC was carried out through a process based on international guidelines (17) that included pilot testing (with cognitive debriefing) and expert analysis, with no major problem being found.
From the responses to ABC, we derived the scores for the 3 ABC short versions proposed in the literature for patients with PD: a 6-item version by Peretz et al. (ABC-6P) (11); a 6-item version by Oude Nijhuis et al. (ABC-6ON) (12); and a 5-item version by Lohnes & Earhart (ABC-5L) (13).
In order to evaluate the construct validity of the ABC, the following instruments were also used:
Berg Balance Scale (BBS) (18). The BBS is a 14-item scale evaluating the ability to maintain balance in different positions, postural changes and movements. Each item is scored on a 5-point ordinal scale, ranging from 0 (unable to perform) to 4 (normal performance).
Fear of Falling Measure (FFM) (19, 20). The FFM is a self-administered questionnaire composed of 19 items representing a continuum of daily living activities (from the least to the most likely ones) that could evoke concern about falling. The common question is “How worried would you be if you were to perform the following activity?”. Each item is rated on a 3-point ordinal scale (from 0 = not at all worried to 2 = very worried).
Unified Parkinson’s Disease Rating Scale (UPDRS) (21, 22). The UPDRS is the most widely used scale for rating PD patients. Only sections on activities of daily living (UPDRS-ADL; range 0–52), motor examination (UPDRS-ME; range 0–108), modified Hoehn & Yahr staging (HY), and Schwab & England’s ADL scale (SE) were considered in the present study.
Statistical analysis
Classical Test Theory. The internal consistency of ABC was assessed by means of: (i) Cronbach’s coefficient alpha (alpha values > 0.70 are recommended for group level comparison, whereas a minimum of 0.85–0.90 is desirable for individual judgments) (23); (ii) the Spearman’s rank correlation coefficients (rs), to examine to what degree each item was correlated with the total score, omitting that item from the total (item-total correlation).
In addition, we analysed the convergent and discriminant validity of the ABC and its short versions, hypothesizing that we would find the following correlations (Spearman’s rank coefficient rs, corrected for ties): (i) a fair to moderate correlation (rs from 0.35–0.60) with both clinical and functional PD-specific measures, and balance (BBS) (13); (ii) a good to excellent correlation (rs > 0.70) with FFM, due to the established link of balance confidence with fear of falling (5); (iii) an excellent correlation (rs > 0.85) between ABC and its short versions (13).
Then, before applying Rasch methods we assessed whether the ABC scale was “sufficiently unidimensional” to permit unbiased scaling of individuals on a common latent trait (14), one of the main assumptions of Rasch models. Given the unclear factorial structure of responses to the scale, we investigated dimensionality using an exploratory approach (FACTOR version 8.1) (24): (i) parallel analysis was applied to identify the number of dimensions present in the data; (ii) exploratory factor analysis (for ordinal data was then used to evaluate the contribution of each item to the factors (a loading > 0.3 was considered to be significant, given the sample size) (25). The presence of a single salient factor was considered sufficient to proceed with Rasch analysis.
Rasch analysis. An introduction to Rasch analysis and related concepts can be found in dedicated textbooks (14, 26). The matrix of single raw scores for each subject underwent Rasch analysis (rating scale model) through the WINSTEPS software, v. 3.68.2 (26, 27).
We started with a diagnostic assessment of the ABC rating categories to investigate whether the response levels to each item in the scale were being used effectively and consistently according to Linacre (28), verifying if there were: (i) at least 10 cases per category; (ii) an even distribution of category use; (iii) a monotonic increase in both the mean measures of persons getting a given score/category, and thresholds (thresholds, sometimes also called step calibrations, are the ability levels at which the response to either of 2 adjacent categories is equally likely, i.e. they represent the transition from one category to the next); and (iv) category outfit mean-square values less than 2.
If necessary, categories were reconsidered and different patterns of categorization were compared, looking not only at the above indicators of category diagnostics, but also at best reliability indices, and attempting to select those representing the best compromise between statistical performances and clinical meaningfulness. Based on this assessment and following standardized procedures (14, 28) we collapsed some adjacent categories and re-coded response levels. After rating scale modifications, internal construct validity was analysed by evaluating the fit of individual items to the latent trait as per the Rasch model. Infit and outfit mean-square statistics for each item were calculated. Given the sample size, values between 0.8 and 1.2 were considered as indicators of acceptable fit (26), while the estimation of item difficulty was considered stable, with an alpha of 0.01, within ± 0.5 logits (29).
Scale reliability was evaluated in terms of person separation reliability, an index similar to Cronbach’s alpha: for the range 0–1, coefficients > 0.80 are considered as good (14).
A principal component analysis on the standardized residuals was then used to analyse the following issues:
• The proportion of variance attributable to both the Rasch factor and the first residual factor (as a confirmation of the unidimensionality of the scale). The following criteria were used to determine whether additional factors were likely to be present in the residuals: a cut-off of 50% of the variance, explained by the Rasch factor, and eigenvalue of the first residual factor smaller than 3 (26).
• The local independence between items. High correlation (> 0.30) of residuals for 2 items indicates that they may not be locally independent, either because they duplicate some feature of each other or because they both incorporate some other shared dimension (30). In addition, we performed a differential item functioning analysis to examine the stability of item hierarchy across the following subsamples: males vs females, younger (< 73 years) vs older (> 73 years) subjects (73 years being the median age of the sample). The a priori hypothesis was that we would not find differential item functioning between the analysed groups. Differential item functioning was investigated, calibrating the scale for each group separately in order to obtain an estimate of the item difficulties in each group, using as anchor values the person calibrations on the entire sample, then performing pairwise t-tests between the 2 sets of item difficulties (2-sided, α < 0.05 with Bonferroni correction depending on the number of comparisons). Further technical aspects of our statistical analyses can be found elsewhere (31).
All of these Rasch analysis procedures were also performed on the 3 ABC short versions: ABC-6P (11), ABC-6ON (12) and ABC-5L (13).
Results
Score distribution
Table I summarizes the median and interquartile range (25th–75th percentile) for each scale analysed (ABC, ABC-6P, ABC-6ON and ABC-5L).
|
Table I. Median (and 25th–75th percentile) for Activities-specific Balance Confidence (ABC) Scale and its short versions, Fear of Falling Measure, Berg Balance Scale, and PD-specific scales, in the study population (n = 217) |
|
|
Outcome measure (possible score range) |
Median (25th–75th percentile) |
|
ABC Scale (0–100) |
51 (34–67) |
|
6-item ABC by Peretz (ABC-6P) (0–100) |
33 (17–52) |
|
6-item ABC by Oude Nijhuis (ABC-6ON) (0–100) |
35 (17–57) |
|
5-item ABC by Lohnes (ABC-5L) (0–100) |
32 (14–52) |
|
Fear of Falling Measure (0–38) |
20 (10–26) |
|
Berg Balance Scale (0–56) |
46 (41–52) |
|
UPDRS-ADL (0–52) |
16 (12–20) |
|
UPDRS-ME (0–108) |
36 (26–45) |
|
Hoehn & Yahr scale (0–5) |
2.5 (2–3) |
|
Schwab & England’s ADL scale (0–100) |
80 (70–80) |
|
UPDRS-ADL: Unified Parkinson’s Disease Rating Scale version part II – Activities of Daily Living; UPDRS-ME: UPDRS version part III – Motor Examination. |
|
No floor or ceiling effect was found in the ABC, while in its short versions some patients scored at the bottom level: n = 5 in ABC-6P; n = 6 in ABC-6 ON; n = 8 in ABC-5L.
Classical Test Theory
Cronbach’s α was 0.95 in ABC, 0.88 in ABC-5L, 0.89 in ABC-6P and 0.90 in ABC-6ON. The item-to-total correlations in the 4 scales are reported in Table II.
|
Table II. Item-to-total correlation (Spearman between each item with the total score, omitting that item from the total) of ABC and its short versions |
|||||
|
Activity |
Item-to-total correlation |
||||
|
ABC |
ABC-6P |
ABC-6ON |
ABC-5L |
||
|
1 |
Walk around the house |
0.67 |
|||
|
2 |
Walk up and down stairs |
0.56 |
|||
|
3 |
Pick up a slipper from the floor |
0.63 |
|||
|
4 |
Reach at eye level |
0.69 |
|||
|
5 |
Reach while standing on your tiptoes |
0.77 |
0.73 |
0.71 |
0.70 |
|
6 |
Stand on a chair to reach |
0.72 |
0.72 |
0.72 |
0.73 |
|
7 |
Sweep the floor |
0.69 |
|||
|
8 |
Walk outside to nearby car |
0.65 |
|||
|
9 |
Get in and out of a car |
0.76 |
|||
|
10 |
Walk across a parking lot |
0.76 |
|||
|
11 |
Walk up and down a ramp |
0.78 |
|||
|
12 |
Walk in a crowded mall |
0.73 |
0.75 |
||
|
13 |
Walk in a crowd or get bumped |
0.77 |
0.71 |
0.73 |
0.70 |
|
14 |
Ride an escalator holding the rail |
0.66 |
0.64 |
||
|
15 |
Ride an escalator not holding the rail |
0.74 |
0.78 |
0.80 |
0.77 |
|
16 |
Walk on icy sidewalks |
0.64 |
0.67 |
0.68 |
0.68 |
|
ABC-6P: the 6-item version of ABC by Peretz et al. (11); ABC-6ON: the 6-item version of ABC by Oude Nijhuis et al. (12); ABC-5L: the 5-item version of ABC by Lohnes & Earhart (13). |
|||||
As expected, the ABC and its short versions showed a low correlation with SE (r = 0.27–0.29) and HY (r = 0.32–0.34), moderate correlation with UPDRS-ADL (r = 0.36–0.37), UPDRS-ME (r = 0.39–0.41) and BBS (r = 0.46–0.49), and a high correlation with FFM (r = 0.82–0.85). The correlation between the 16-item ABC and its short versions was excellent (for all, r > 0.94).
In ABC, parallel analysis identified a single factor (eigenvalue = 5.32) which accounted for 59% of the variance, and exploratory factor analysis showed that all items loaded meaningfully to the factor, with loadings between 0.41 (item #2) and 0.68 (item #11). Similar positive results were obtained in the 3 short versions (Table III).
|
Table III. Results of exploratory factor analysis for 1-factor model in the ABC and its 3 short versions, showing the contribution of each item to the factor |
|||||
|
Activity |
Factor loadings (1-factor model) |
||||
|
ABC |
ABC-6P |
ABC-6ON |
ABC-5L |
||
|
1 |
Walk around the house |
0.56 |
|
|
|
|
2 |
Walk up and down stairs |
0.41 |
|
|
|
|
3 |
Pick up a slipper from the floor |
0.51 |
|
|
|
|
4 |
Reach at eye level |
0.54 |
|
|
|
|
5 |
Reach while standing on your tiptoes |
0.59 |
0.57 |
0.55 |
0.54 |
|
6 |
Stand on a chair to reach |
0.58 |
0.70 |
0.68 |
0.70 |
|
7 |
Sweep the floor |
0.56 |
|
|
|
|
8 |
Walk outside to nearby car |
0.51 |
|
|
|
|
9 |
Get in and out of a car |
0.68 |
|
|
|
|
10 |
Walk across a parking lot |
0.62 |
|
|
|
|
11 |
Walk up and down a ramp |
0.68 |
|
|
|
|
12 |
Walk in a crowded mall |
0.63 |
|
0.63 |
|
|
13 |
Walk in a crowd or get bumped |
0.62 |
0.59 |
0.62 |
0.59 |
|
14 |
Ride an escalator holding the rail |
0.50 |
0.50 |
|
|
|
15 |
Ride an escalator not holding the rail |
0.68 |
0.76 |
0.75 |
0.73 |
|
16 |
Walk on icy sidewalks |
0.48 |
0.68 |
0.69 |
0.71 |
|
Variance % |
59 |
85 |
89 |
89 |
|
|
ABC-6P: 6-item version of ABC by Peretz et al. (11); ABC-6ON: 6-item version of ABC by Oude Nijhuis et al. (12); ABC-5L: 5-item version of ABC by Lohnes & Earhart (13). Variance %: variance explained by the factor (percentage). |
|||||
Rasch analysis. Some rating categories (i.e. response options) in ABC did not comply with the pre-set criteria for category functioning (mean measures, thresholds, etc.). For this reason, the 11 original rating categories were combined in different ways until the criteria were best met. This was obtained by rescaling as follows: 0 = 0; 1–3 = 1; 4–6=2; 7–9 = 3; 10 = 4. The 5 resulting categories roughly represent the following levels: 0 = No confidence; 1 = Low confidence; 2 = Moderate confidence; 3 = High confidence; 4 = Complete confidence.
Fifteen out of the 16 ABC items fitted the model (infit and outfit MnSq between 0.8 and 1.2).
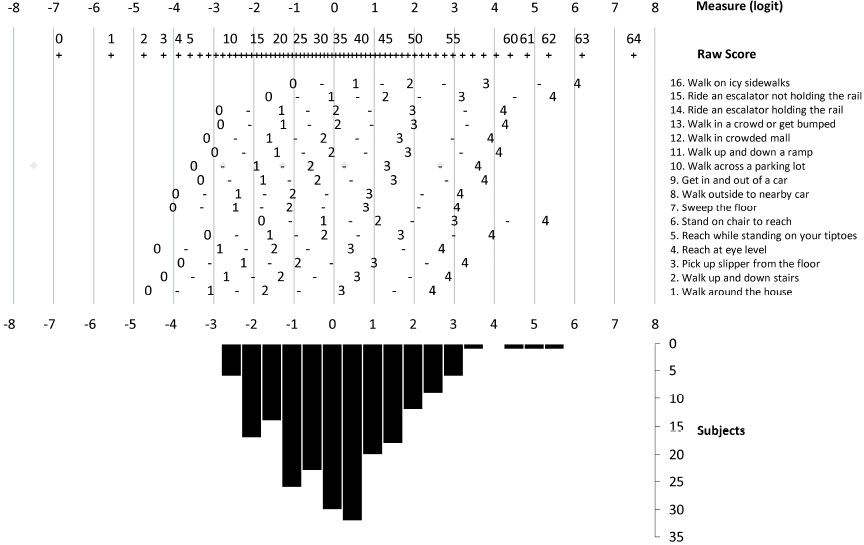
Only item 2 “Walk up or down stairs” (infit MnSq = 1.27; outfit MnSq = 1.29) was underfitting (i.e. had unexpectedly high variability), but after removal of the 2 most unexpected responses the misfit disappeared (infit MnSq = 1.18; outfit MnSq = 1.17); no item was overfitting, i.e. none showed an overly predictable pattern (Table IV). On the basis of the item calibrations, it was possible to construct a conversion table (Table V) and a Rasch nomogram (Fig. 1) to transform the raw scores of the ABC into linear estimates of balance confidence.
|
Table IV. Summary of Rasch analysis of Activities-specific Balance Confidence scale, containing item calibration and fit information |
|||
|
Measure (SE) |
Fit (MnSq) |
||
|
Infit |
Outfit |
||
|
1. Walk around the house |
–1.77 (0.10) |
1.03 |
0.99 |
|
2. Walk up and down stairs |
–1.05 (0.10) |
1.18 |
1.17 |
|
3. Pick up slipper from the floor |
–0.76 (0.10) |
1.18 |
1.15 |
|
4. Reach at eye level |
–1.25 (0.10) |
0.97 |
0.92 |
|
5. Reach while standing on your tiptoes |
0.47 (0.10) |
0.84 |
0.83 |
|
6. Stand on chair to reach |
1.48 (0.09) |
0.99 |
0.95 |
|
7. Sweep the floor |
–0.82 (0.09) |
1.00 |
0.96 |
|
8. Walk outside to nearby car |
–0.82 (0.10) |
1.03 |
1.04 |
|
9. Get in and out of a car |
–0.25 (0.09) |
0.85 |
0.82 |
|
10. Walk across a parking lot |
–0.28 (0.09) |
0.94 |
0.88 |
|
11. Walk up and down a ramp |
0.20 (0.09) |
0.83 |
0.81 |
|
12. Walk in crowded mall |
0.12 (0.08) |
1.01 |
0.99 |
|
13. Walk in a crowd or get bumped |
0.46 (0.09) |
0.89 |
0.87 |
|
14. Ride an escalator holding the rail |
0.43 (0.09) |
1.19 |
1.16 |
|
15. Ride an escalator not holding the rail |
1.59 (0.09) |
0.98 |
0.93 |
|
16. Walk on icy sidewalks |
2.25 (0.10) |
1.12 |
0.99 |
|
“Measure” is the estimate (or calibration) of the item difficulty, in parenthesis its standard error (SE). Positive measures mean more difficult items. The higher the item estimate, the less likely it is for any subject to gain a high score (i.e. to rate high confidence in performing the activity without losing balance). “Infit” is a t standardized information-weighted mean square (MnSq) fit statistic, “Outfit” is a t standardized outlier-sensitive MnSq fit statistic. |
|||
The 3 ABC short-forms showed disordered thresholds similar to those in the ABC. After the same category re-coding used for the full-length scale, all items fitted the Rasch model.
|
Table V. Raw score to measure estimate conversion table for the Activities-specific Balance Confidence scale, based on the original sample calibrations. Measures on complete test |
||||||||
|
Raw score |
Measure |
SE |
Raw score |
Measure |
SE |
Raw score |
Measure |
SE |
|
0 |
–6.82 |
1.87 |
22 |
–1.13 |
0.32 |
44 |
1.12 |
0.35 |
|
1 |
–5.51 |
1.06 |
23 |
–1.03 |
0.32 |
45 |
1.25 |
0.36 |
|
2 |
–4.7 |
0.78 |
24 |
–0.93 |
0.32 |
46 |
1.38 |
0.37 |
|
3 |
–4.21 |
0.64 |
25 |
–0.83 |
0.31 |
47 |
1.52 |
0.38 |
|
4 |
–3.84 |
0.57 |
26 |
–0.73 |
0.31 |
48 |
1.66 |
0.38 |
|
5 |
–3.55 |
0.51 |
27 |
–0.64 |
0.31 |
49 |
1.81 |
0.39 |
|
6 |
–3.31 |
0.48 |
28 |
–0.54 |
0.31 |
50 |
1.97 |
0.4 |
|
7 |
–3.1 |
0.45 |
29 |
–0.44 |
0.31 |
51 |
2.14 |
0.41 |
|
8 |
–2.91 |
0.42 |
30 |
–0.35 |
0.31 |
52 |
2.32 |
0.43 |
|
9 |
–2.73 |
0.41 |
31 |
–0.25 |
0.31 |
53 |
2.5 |
0.44 |
|
10 |
–2.57 |
0.39 |
32 |
–0.15 |
0.31 |
54 |
2.7 |
0.45 |
|
11 |
–2.43 |
0.38 |
33 |
–0.06 |
0.31 |
55 |
2.92 |
0.47 |
|
12 |
–2.28 |
0.37 |
34 |
0.04 |
0.31 |
56 |
3.15 |
0.49 |
|
13 |
–2.15 |
0.36 |
35 |
0.14 |
0.32 |
57 |
3.4 |
0.51 |
|
14 |
–2.02 |
0.35 |
36 |
0.24 |
0.32 |
58 |
3.67 |
0.54 |
|
15 |
–1.9 |
0.35 |
37 |
0.34 |
0.32 |
59 |
3.98 |
0.57 |
|
16 |
–1.78 |
0.34 |
38 |
0.44 |
0.32 |
60 |
4.33 |
0.62 |
|
17 |
–1.67 |
0.34 |
39 |
0.55 |
0.33 |
61 |
4.75 |
0.68 |
|
18 |
–1.56 |
0.33 |
40 |
0.66 |
0.33 |
62 |
5.29 |
0.8 |
|
19 |
–1.45 |
0.33 |
41 |
0.77 |
0.34 |
63 |
6.12 |
1.07 |
|
20 |
–1.34 |
0.32 |
42 |
0.88 |
0.34 |
64 |
7.42 |
1.86 |
|
21 |
–1.24 |
0.32 |
43 |
1 |
0.35 |
|||
|
SE: standard error. |
||||||||
Table VI shows subjects’ ability levels, reliability indices, and principal component analysis of the standardized residuals, for ABC scale and its 3 short versions. Rasch analysis of the ABC showed a normal distribution of subject ability (balance confidence) and a very good sample-item matching (mean subject ability = –0.07), whereas in the 3 short versions the mean subject ability was clearly lower (–1.31 to –1.63 logits) than the mean difficulty (0 logits) for the items, indicating less than ideal targeting. In addition, Fig. 1 shows the threshold map for ABC items, and the distribution of the subjects according to their ability (i.e. balance confidence).
|
Table VI. Main results regarding Rasch analysis of Activities-specific Balance Confidence scale (ABC) scale and its 3 short versions, after rating scale modifications (from 0–11 to 0–4 levels): subject ability and item difficulty estimates, reliability indices, and principal component analysis of the residuals after the extraction of the Rasch factor. In Rasch analysis, subject ability and item difficulty are expressed in logit units, a logit being the natural logarithm of the ratio (odds) of mutually exclusive alternatives (e.g. pass vs fail or higher response vs lower response): zero logits represents mean item difficulty, and movement in a positive or negative direction along the continuum indicates greater and lesser item difficulty, respectively |
||||
|
ABC scale (16 items) |
6-item ABC Peretz |
6-item ABC Oude Nijhuis |
5-item ABC Lohnes |
|
|
Subject ability, mean (range) |
–0.07 (–2.97 to 5.41) |
–1.36 (–6.20 to 4.30) |
–1.31 (–6.18 to 4.35) |
–1.63 (–6.58 to 4.24) |
|
Person separation reliability (Cronbach’s alpha) |
0.93 (0.94) |
0.84 (0.88) |
0.85 (0.89) |
0.82 (0.87) |
|
Range of item difficulty estimates |
–1.79 to 2.24 |
–1.14 to 1.35 |
–1.19 to 1.51 |
–1.44 to 1.35 |
|
Variance explained by the Rasch factor |
64.0 |
68.1 |
70.6 |
70.9 |
|
Eigenvalue of the first residual factor |
2.2 |
1.4 |
1.5 |
1.5 |
No correlation of standardized residuals was greater than 0.30 in the 4 scales, except for that between item #9 “Get into or out of a car” and item #11 “Walk up or down a ramp” (r = 0.36) in ABC.
None of the ABC items displayed differential item functioning across age groups and gender; the lowest p-values obtained (Bonferroni-adjusted significance level p < 0.003) were as follows: younger vs older in item 6 “Stand on chair to reach” (p = 0.06); males vs females in item 2 “Walk up and down stairs” (p = 0.03).
Discussion
This is the first study to analyse the measurement assumptions and properties of the ABC using a combination of Classical Test Theory and Rasch analysis methods. Such comprehensive psychometric assessment is critical to guide the use and interpretation of this scale in clinical practice and research (14, 15).
According to our study, the ABC showed sound psychometric properties, although there is room for some minor refinement aimed at improving its measurement qualities.
Our patients reported a limited confidence in their ability to maintain balance during activities of daily living (as measured with the ABC). Previous studies in patients with PD reported both higher (13, 32) and similar levels of balance confidence (33, 34). However, our clinical examination and tests were completed when patients were performing at their best, whereas ABC and FFM (patient-reported outcomes) report the overall patient experience with balance confidence and fear of falling, respectively, and more than half of our patients had motor fluctuations.
The excellent internal consistency of the ABC items is close to those reported in community-dwelling seniors (5), and people with lower-limb amputation (7), stroke (9), and PD (12, 35), where values ranged from 0.93 to 0.97. Similarly, the Cronbach alphas of the short versions are in line with those reported in the literature (9, 11, 12).
Parallel analysis and exploratory factor analysis showed that ABC items (and those of its short versions) were unidimensional enough to proceed with Rasch analysis. This result is in agreement with those recorded in different populations (3, 8), and is confirmed by the subsequent Rasch analysis, including the principal component analysis on the standardized residuals. Similar results for both consistency and dimensionality were obtained for each of the 3 short versions, not surprisingly, considering the good item homogeneity of the ABC.
As for external construct validity, our expectations were confirmed showing in all scales: (i) a low to moderate correlation with clinical and functional PD-specific measures, and with balance (as measured with BBS); (ii) a high correlation with fear of falling, and between the ABC and its short versions (5, 13, 18).
According to rating scale diagnostics performed with Rasch analysis, our subjects were able to discern appreciably only 5 levels of “balance confidence” (instead of the original 11 categories) and, thus, it might be appropriate to simplify the item format. Similarly, Arnadottir et al. (6) and Sakakibara et al. (8), using Rasch analysis, found that the best solution for ABC was a simplified 5-option response format. This is not the first time that an 11-level (from 0 to 10) numeric rating scale has failed to demonstrate appropriate functioning (36, 37).
All items fitted the Rasch model in all ABC versions; only item #2 “Walk up or down stairs” was initially underfitting, but when the unexpected responses of 2 subjects were removed all items fitted well. This suggests that this misfit was idiosyncratic to these 2 subjects (and not systematic to the item), and probably happened because they answered regarding their general difficulty of performing the task rather than their balance confidence in performing it (10). Moreover, only 2 items in ABC (items #9 “Get into or out of a car” and #11 “Walk up or down a ramp”) were flagged as potentially not locally independent, either because they duplicate some feature of each other or because they both incorporate some other shared dimension.
Part of the validation of a scale involves determining whether the hierarchical ordering of the items is consistent with theoretic or clinical expectations. Our item hierarchy (calculated via Rasch analysis) was close to previously reported item hierarchies (based on mean or 25th-percentile values). In particular, the 5 activities in which people were least confident in maintaining balance were (in descending order of difficulty): #16 “Walk on icy sidewalks”, #15 “Escalator not holding rail”, #6 “Stand on chair to reach”, #5 “Reach on tiptoes”, and #13 “Bumped” (see Table IV). This is in line with previous studies in PD patients and explains why the 3 short ABC versions (11–13), all developed selecting those items scoring lowest (i.e. most challenging to postural control), include these 5 items. Unfortunately, in all 3 short scales (11–13) their selection criteria also represented a limit because: (i) the mean balance confidence for the sample was clearly lower than the mean difficulty for the items, indicating that the item difficulty was not well matched to the ability of the patients analysed in the sample; (ii) the range of item difficulty estimates was more limited than in ABC; (iii) the reliability levels were lower than in ABC; (iv) a slight (< 4%) floor effect was present. As a consequence, persons with low balance confidence are scored less precisely with the short versions. To better estimate people with low balance-confidence, it is important also to maintain items with low to moderate difficulty in short versions, as in the original ABC (where a very good sample-item matching and a symmetrical distribution of subject ability was demonstrated).
Overall, our findings provide evidence for the potential psychometric superiority of the full version of the ABC over its short versions, although further research into this field is warranted. When comparing short and long forms of a questionnaire, time and cost issues should also be considered. However, in our opinion, an item reduction or modification of ABC can only be taken into consideration provided that it does not significantly corrupt the main technical characteristics of the original scale (38), or that it improves user-friendliness (39).
Care should be taken in generalizing these results to different groups or settings, because the selection criteria of our convenience sample may represent a threat to the external validity of the study. Confirmation of our category reduction scheme is also warranted. But, sample size (217 subjects), the straightforward results of factor analysis, and the Rasch reliability indexes should give confidence in the stability of our solutions, concerning both factorial structure and item placement (i.e. its difficulty level) in the hierarchical map.
Furthermore, we cannot exclude that some specific characteristics of the Italian version of the ABC could have influenced some results, although the translation and cultural adaptation followed international guidelines (17) and did not need any major local adjustment.
In conclusion, our main results show that in patients with PD:
• the ABC has adequate unidimensionality;
• the selection of its items is satisfactory (also in terms of coverage and technical quality), although there is room for some minor refinement;
• the 0–10 rating scale should be simplified. A 5-level response format seems able to improve the measurement qualities of the scale (without decreasing its reliability indexes). Nevertheless, further analysis of the actual performance of the 5 rating categories is needed (14);
• according to Rasch analysis, the 3 ABC short versions showed some minor psychometric limitations in comparison with the ABC (e.g. a more limited range of item difficulty estimates, lower reliability levels, a slight floor effect, a mismatch between mean item difficulty and mean ability of the patients analysed in the sample).
To our knowledge, the present study is the first to investigate the dimensionality and main metric properties of the ABC in patients with PD based on stringent psychometric criteria. It supports the ABC’s usefulness for measuring the construct “balance confidence” in these patients, while it illustrates the psychometric strengths and weaknesses of its short versions (11–13), and provides a basis for further research aimed at optimizing the measurement qualities of these questionnaires.
References

