Diana C. Sanchez-Ramirez, PT, MPH, PhD1,2, Marike van der Leeden, PhD3,4,
Martin van der Esch, PhD3, Leo D. Roorda, MD, PT, PhD3, Sabine Verschueren, PhD5,
Jaap van Dieën, PhD2,6, Willem F. Lems, MD, PhD7,8 and Joost Dekker, PhD3,4,9
From the 1Injury Prevention Centre, University of Alberta, School of Public Health, Edmonton, Canada,
2MOVE Research Institute Amsterdam, Faculty of Human Movement Sciences, VU University Amsterdam,
3Amsterdam Rehabilitation Research Center, Reade, 4VU University Medical Center, Department of Rehabilitation Medicine, Amsterdam, The Netherlands, 5KU Leuven, Department of Rehabilitation Sciences, Belgium, 6King Abdulaziz University, Jeddah, Saudi Arabia, 7VU University Medical Center, Department of Rheumatology, 8Jan van Breemen Research Institute, Reade and 9VU University Medical Center, Department of Psychiatry, Amsterdam, The Netherlands
OBJECTIVE: To examine the association between changes in knee muscle strength (extensor and flexor muscles separately, and mean values) and changes in activity limitations in patients with established knee osteoarthritis at 2 years.
METHODS: Data from 186 patients with knee osteoarthritis, part of the Amsterdam Osteoarthritis cohort, were gathered at baseline and at 2-year follow-up. Strength of the knee extensor and flexor muscles were assessed using an isokinetic dynamometer. Activity limitations were assessed using the Western Ontario and McMaster University Osteoarthritis Index (WOMAC) – Physical Function subscale, the Get Up and Go test (GUG), and the 12-steps stairs test. Univariate and multivariate linear regression analyses were used to assess the association between changes in muscle strength and changes in activity limitations, adjusting for relevant confounders and baseline activity limitations.
RESULTS: There was an overall 16% increase in mean knee muscle strength (p < 0.001), 19% increase in knee extensor muscle strength (p < 0.001), and 17% increase in knee flexor muscle strength (p < 0.001) at 2 years. Increased mean knee muscle strength and knee flexor muscle strength were associated with better self-reported physical function (WOMAC) (b = –5.7, p = 0.03 and b = –6.2, p = 0.05), decreased time on the GUG (b = –1.2, p = 0.003 and b = –1.4, p = 0.05) and decreased time on the stairs test (b = –4.4, p < 0.001 and b = –6.6, p < 0.001). Increased extensor muscle strength was associated only with decreased time on the stairs test (b = –2.7, p < 0.001).
CONCLUSION: Increased knee muscle strength, mainly in the knee flexors, was associated with decreased activity limitations in patients with knee osteoarthritis at 2 years. Thus, differences in muscle strength may partially explain the between-patients variability in activity limitations.
Key words: knee osteoarthritis; muscle strength; activity limitations.
J Rehabil Med 2015; 47: 00–00
Correspondence address: Diana C. Sanchez-Ramirez, University of Alberta, School of Public Health-Injury Prevention Centre, RTF 3-100A, T6G 2E1 Edmonton, Canada. E-mail: diana.sanchez@ualberta.ca
Accepted Mar 3, 2015; Epub ahead of print May 11, 2015
INTRODUCTION
Osteoarthritis (OA), the most common form of arthritis affecting the synovial joints, is considered a major cause of pain and activity limitations (1). Activity limitations are defined as difficulties in performing daily activities (2). Previous studies have shown a slow increase in activity limitations over time in patients with OA (3), while others have found no change, or even a decrease in activity limitations in this group of patients (4, 5). Nevertheless, there is high between-patients variability in the course of activity limitations in patients with OA, which requires further explanation (6, 7).
Muscle strength is considered a relevant determinant of activity limitations in patients with knee OA (5). The cross-sectional relationship between low muscle strength and activity limitations has been reported extensively (5, 8). Moreover, earlier studies have shown baseline muscle strength in patients with OA as a potential predictor for activity limitations in the long term (4, 6, 9, 10). The longitudinal association between a decrease in muscle strength and an increase in activity limitations has been studied in 2 observational studies, with conflicting results (4, 11), and in one clinical trial, which failed to control for relevant confounders (12). Overall, there is scarce evidence about the longitudinal association between muscle strength and activity limitations, in the absence of a well-defined intervention, in patients with established knee OA. Testing the longitudinal association between muscle strength and activity limitations in knee OA is a direct and necessary extension beyond cross-sectional research in this area.
Previous studies have focused mainly on the association of knee extensor muscle strength and activity limitations. There has been little research into the role of knee flexor muscle strength in activity limitations in patients with OA. However, in this group of patients an appropriate strength of the knee extensor and flexor muscles is important for stability of the knee and prevention of joint stress (13).
The aim of this study is to examine the association between changes in knee muscle strength (extensor and flexor muscles separately, and averaged) and changes in activity limitations in patients with established knee OA at 2 years. We hypothesized that, in patients with established OA, an increase in strength of the knee extensor and flexor muscles, as well as an increase in mean knee muscle strength, would be associated with a decrease in activity limitations in the long term.
PATIENTS AND METHODS
Patients
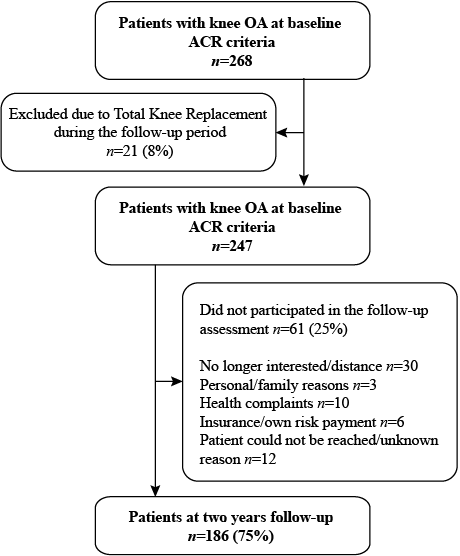
A total of 186 patients from the Amsterdam Osteoarthritis (AMS-OA) cohort (127 females, 59 males) with unilateral or bilateral diagnosis of knee OA according to the American College of Rheumatology (ACR) criteria (15) were included in this study. The AMS-OA is a cohort of patients with OA of the knee and/or hip (16, 17), who have been referred to an outpatient rehabilitation centre (Reade, Centre for Rehabilitation and Rheumatology, Amsterdam, The Netherlands) (14, 18). In the present study, the group of patients was defined as established knee OA due to the combination of confirmed diagnosis of knee OA according to ACR criteria and the presence of OA-related problems that led patients to seek specialized care. Patients were assessed by rheumatologists, radiologists and rehabilitation physicians. Exclusion criteria were rheumatoid arthritis or any other form of inflammatory arthritis (i.e. crystal arthropathy, septic arthritis, spondyloarthropathy), and total knee replacement during the follow-up period. Two years after the baseline assessment patients were invited to the follow-up assessment (Fig. 1) . Demographic, radiographic, clinical, psychosocial and biomechanical factors related to OA were assessed at baseline and at 2-year follow-up. The assessment of muscle strength and physical performance was completed by the same 2 trained movement scientists following an established and approved protocol. At follow-up, the data collectors did not have information on baseline assessment. Only patients who completed the assessment at both time-points were included in the study. All patients provided written inform consent according to the Declaration of Helsinki. The study was approved by the Reade Institutional Review Board.
Measures
Muscle strength. Knee muscle strength was assessed concentrically using an isokinetic dynamometer (EnKnee, Enraf-Nonius, Rotterdam, Netherlands) at baseline and at 2-year follow-up (18). Patients carried out an initial practice attempt to familiarize them with the required movements. The patients performed 3 maximal test repetitions to measure the isokinetic strength of the knee extensor muscles (mainly quadriceps) and knee flexor muscles (mainly hamstrings) for each knee, at 60°/s. The mean values of knee muscle strength (knee extensor and flexor combined, as well as mean knee extensor and mean flexor muscle strength (separate) per leg were calculated (Nm) and divided by the patient’s weight (kg) (19). This measure (in Nm/kg) has shown an excellent intra-rater reliability (intraclass correlation coefficient (ICC) 0.93) in patients with knee OA (20). Muscle strength parameters were averaged over the 2 legs, due to the fact that 132 (71%) patients included in the study had OA in both knees and muscle strength in the 2 legs was highly correlated in our group of patients (r = 0.82, p = 0.01). In addition, optimal muscle strength in both legs is required for an appropriate performance of ambulatory activities of daily living.
Activity limitations. Activity limitations were assessed using the Western Ontario and McMaster Universities Osteoarthritis physical function index subscale (WOMAC-PF), a self-reported questionnaire, and 2 physical performance tests (the Get Up and Go test (GUG) and the stairs test).
The WOMAC questionnaire was used to evaluate self-reported activity limitations, stiffness and pain in patients with OA (21). It has 5 items related to pain and 2 related to stiffness. The physical function (PF) section comprises 17 items, each scored 0–4, giving a possible total score of 0–68. Higher scores represent more activity limitations. A validated Dutch version of WOMAC (22) was used in this study.
The GUG test (23, 24) was performed with patients sitting on a high standard chair (seat height 49 cm). Patients were instructed to stand up without the help of the arms on the command “go”, and walk 15 m along an unobstructed corridor as quickly as possible, without running. The chronometer was stopped when they reached a mark on the floor. All patients were wearing walking shoes. Patients who normally used walking devices were allowed to use them during the test. A longer time (s) taken to perform the test was considered a greater activity limitation.
In the stairs test (18), patients were instructed to climb 12 stairs (16 cm high), 1 stair at a time, as fast as possible, without running. Patients were encouraged not to use the handrail, but were not prohibited from doing so for safety. Once they reached the top, the chronometer was stopped while they turned around. Subsequently and following the same instructions, after a signal, the chronometer started again while the subjected descended the stairs. Both times (in s) were recorded independently and then added to calculate the time for the whole task. All patients were wearing comfortable walking shoes. A longer time performing the test was considered a higher activity limitation.
Potential confounders. Demographic data (i.e. age and gender) were recorded. Information related to comorbidities was collected with the Cumulative Illness Rating Scale (CIRS) (25). This instrument allows information to be gathered related to 13 body systems, scoring from 0 (none) to 4 (extremely severe) according to the severity of the condition. The number of diseases on which the patients scored a severity of 2 or higher was calculated and incorporated in the analyses. Body mass index (BMI) was calculated as body mass in kg divided by height in m2 (kg/m2). C-reactive protein (CRP) (mg/l) levels were measured in serum from patients’ blood samples and processed immunoturbidimetrically using CRPLX test kits (26–28) and the Roche Cobas-6000 analyser. Non-steroidal anti-inflammatory drug (NSAID) use was dichotomized (yes/no). Pain level was assessed using the WOMAC pain subscale (21). In addition, at 2-year follow-up the patients were asked if they had received physiotherapy at any institution or if they took part in a study involving physical therapy intervention during the past 2 years.
Statistical analysis
Descriptive statistics were used to characterize the study population at baseline and at 2-year follow-up. Percentages were used for categorical variables, medians (interquartile ranges (IQRs)) and means (standard deviations (SDs)) for continuous variables. McNemar tests and paired t-tests were used to analyse the differences in the distribution of the variables at baseline and at 2-year follow-up.
The baseline to 2-year follow-up change score was calculated for knee muscle strength (extensor and flexor muscles separately, and averaged) and activity limitations (WOMAC-PF, GUG and stairs test). The association between change in muscle strength (Nm/kg) and change in activity limitations was analysed using linear regression (analysis of covariance) (29). First, regression analyses were used to explore the association between change in muscle strength and change in activity limitations at 2-year follow-up, adjusting for baseline activity limitations (crude models) (29). Secondly, relevant confounding was defined as 10% change in the crude regression coefficient of the central determinant, after adjustment for an additional variable (30). The confounding effect of other variables possibly affecting the association between muscle strength and activity limitations (i.e. age, gender, change in comorbidities, change in NSAID use, change in BMI, change in CRP levels, change in WOMAC pain and physical therapy treatment) was evaluated based on a 10% difference between crude and adjusted regression coefficient. Thirdly, fully adjusted multivariable regression models including all relevant confounding variables were analysed.
Statistical significance was accepted at p-values < 0.05. All analyses were performed using SPSS software, version 18.0 (SPSS, Chicago, IL, USA).
RESULTS
Patients
A total of 268 patients with knee OA who completed the baseline assessment were invited to participate in the follow-up evaluation. Eight percent (n = 21) of the patients were excluded from the study due to total knee replacement. From the eligible patients who met the inclusion criteria at follow-up (n = 247), 25% (n = 61) declined the invitation for various reasons. Fig. 1 shows the patient flow during the study. There were no significant differences in baseline characteristics between the groups of patients who were and were not part of the 2-year follow-up assessment (Table I).
|
Table I. Patients’ baseline characteristics (n = 247) |
||
|
|
Follow-up assessment completed |
|
|
Yes (n = 186) |
No (n = 61) |
|
|
Age, years, mean (SD) |
61 (7.3) |
62 (8.6) |
|
Radiographic OA K/L score ≥ 2, n (%) |
131 (71) |
44 (73) |
|
BMI, kg/m², mean (SD) |
29.3 (5.6) |
28.8 (4.6) |
|
CRP, mg/l, mean (SD) |
3.4 (5.4) |
2.5 (2.2) |
|
Comorbidities count (CIRS ≥ 2), mean (SD) |
0.8 (0.9) |
0.6 (0.9) |
|
NSAIDs (yes), n (%) |
33 (18) |
7 (12) |
|
Knee muscle strength, Nm/kg, mean (SD)a |
0.91 (0.4) |
0.96 (0.4) |
|
Knee extensor muscle strength, Nm/kg, mean (SD) |
1.08 (0.4 |
1.15 (0.5) |
|
Knee flexor muscle strength, Nm/kg, |
0.73 (0.3) |
0.78 (0.3) |
|
WOMAC pain score (0–20), mean (SD) |
7.9 (3.8) |
7.9 (3.0) |
|
WOMAC stiffness score (0–8), mean (SD) |
3.7 (1.7) |
4.1 (1.5) |
|
WOMAC physical function score (0–68), mean (SD) |
28.6 (13.4) |
29.8 (11.4) |
|
GUG, s, mean (SD) |
11.1 (3.8) |
10.8 (2.3) |
|
Stairs test, s, mean (SD) |
9.1 (3.5) |
9.4 (5.9) |
|
aMean knee extensor and flexor muscle strength. Baseline characteristics were not significantly different between subgroups. OA: osteoarthritis; K/L: Kellgren/Lawrence; SD: standard deviation; CIRS: Cumulative Illness Rating Scale; NSAIDs: non-steroidal anti-inflammatory drugs; WOMAC: Webster Ontario and McMaster Osteoarthritis index; GUG: Get Up and Go test. |
||
Descriptives
Demographic and clinical characteristics of the patients who participated at baseline and at 2-year follow-up (n = 186) are shown in Table II. Sixty-eight percent of the study group (n = 127) were women. Mean age at baseline was 61 years (SD 7.3). In the study group, there was an overall 16% increase in mean knee muscle strength mean (0.08 Nm/kg (SD 0.2); p < 0.001), 19% increase in knee extensor muscle strength (0.11 Nm/kg (SD 0.3); p < 0.001) and 17% increase in knee flexor muscle strength (0.06 Nm/kg (SD 0.2); p < 0.001) at 2 years. At the follow-up assessment, the time for completing the stairs test decreased in the study group (p = 0.039) and there was a borderline significant decrease in WOMAC-PF score (p = 0.053). However, there was no statistically significant change in mean time for completing the GUG test (p = 0.871) at 2 years.
|
Table II. Characteristics of the study population (n = 186) |
||||||
|
|
Baseline |
|
Two-year follow-up |
p |
||
|
n |
|
|
n |
|
||
|
Age, years, mean (SD) |
186 |
61 (7.3) |
|
– |
– |
– |
|
Female, n (%) |
186 |
127 (68) |
|
– |
– |
– |
|
Radiographic OA, K/L score ≥ 2, n (%) |
184 |
130 (70) |
|
186 |
123 (66) |
0.13 |
|
K/L score 2 |
|
58 (31) |
|
|
55 (29) |
|
|
K/L score 3 |
|
52 (28) |
|
|
31 (17) |
|
|
K/L score 4 |
|
20 (11) |
|
|
37 (20) |
|
|
BMI, kg/m2, mean (SD) |
185 |
29.3 (5.5) |
|
186 |
29.3 (5.4) |
0.26 |
|
Comorbidities count (CIRS ≥ 2), mean (SD) |
184 |
0.8 (1.0) |
|
175 |
1.1 (1.0) |
0.00 |
|
NSAIDs (yes), n (%) |
185 |
30 (16) |
|
186 |
38 (20) |
0.23 |
|
CRP, mg/l, mean (SD) |
183 |
3.4 (5.4) |
|
184 |
2.9 (3.1) |
0.21 |
|
Knee muscle strength, Nm/kg, mean (SD)a |
177 |
0.92 (0.4) |
|
183 |
0.98 (0.4) |
0.00 |
|
Knee extensor muscle strength, Nm/kg, mean (SD) |
179 |
1.1 (0.5) |
|
185 |
1.2 (0.5) |
0.00 |
|
Knee flexor muscle strength, Nm/kg, mean (SD) |
181 |
0.7 (0.3) |
|
184 |
0.8 (0.3) |
0.00 |
|
WOMAC pain score (0–20), mean (SD) |
183 |
7.9 (3.8) |
|
185 |
7.0 (4.3) |
0.01 |
|
WOMAC stiffness score (0–8), mean (SD) |
179 |
3.7 (1.7) |
|
186 |
3.5 (2.0) |
0.02 |
|
WOMAC physical function score (0–68), mean (SD) |
183 |
28.6 (13.4) |
|
186 |
27.0 (15.3) |
0.05 |
|
GUG, s, mean (SD) |
185 |
11.0 (3.6) |
|
185 |
10.9 (5.0) |
0.87 |
|
Stairs test, s, mean (SD) |
185 |
15.1 (8.8) |
|
181 |
13.7 (7.3) |
0.04 |
|
PT treatment during the past 2 years (yes), n (%) |
– |
No information |
|
186 |
149 (80) |
– |
|
aMean knee extensor and flexor muscle strength. OA: osteoarthritis; K/L: Kellgren/Lawrence, CRP: C-reactive protein, PT: physiotherapy; SD: standard deviation; CIRS: Cumulative Illness Rating Scale; NSAIDs: non-steroidal anti-inflammatory drugs; WOMAC: Webster Ontario and McMaster Osteoarthritis index; GUG: Get Up and Go test; BMI: body mass index. |
||||||
Associations between changes in muscle strength and changes in activity limitations at 2 years
Tables III–V show the crude associations between change in knee muscle strength and change in activity limitations at 2 years. Increases in mean knee muscle strength and knee flexor muscle strength were significantly associated with a decrease in WOMAC-PF score, and a decrease in time (s) performing the GUG and the stairs test. After the addition of one possible confounder at the time to the crude models, comorbidities change, NSAIDs change and WOMAC pain change were identified as relevant confounders (i.e. more than 10% change in the crude model regression coefficient for the change in muscle strength). In the multivariable model, adjusted for all relevant confounders, increases in mean knee muscle strength and knee flexor muscle strength were still strongly associated with a decrease in WOMAC-PF score, and a decrease in time performing the GUG and the stairs test. In the crude models, an increase in knee extensor muscle strength was significantly associated with a decrease in WOMAC-PF score and a decrease in time performing the stairs test. However, in the fully adjusted models, increase in knee extensor muscle strength was only associated with a decrease in time performing the stairs test.
|
Table III. Association between knee muscle strength change and changes in activity limitations over 2 years |
||||||||||||
|
|
WOMAC-PF score (0–68) |
|
GUG test (s) |
|
Stairs test (s) |
|||||||
|
b |
95% CI |
p-value |
|
b |
95% CI |
p-value |
|
b |
95% CI |
p-value |
||
|
1 |
Crude Model |
|
|
|
|
|
|
|
|
|
|
|
|
|
KMS change |
–9.5 |
–16.7, –2.3 |
0.01 |
|
–1.8 |
–3.0, –0.5 |
0.01 |
|
–4.4 |
–6.5, –2.3 |
< 0.001 |
|
2 |
Adjusted Models |
|
|
|
|
|
|
|
|
|
|
|
|
|
KMS change + gender |
–9.4 |
–16.6, –2.2 |
0.01 |
|
–1.7 |
–2.9, –0.5 |
0.01 |
|
–4.4 |
–6.5, –2.3 |
< 0.001 |
|
|
KMS change + age |
–9.2 |
–16.3, –2.2 |
0.01 |
|
–1.8 |
–3.0, –0.6 |
0.004 |
|
–4.4 |
–6.5, –2.3 |
< 0.001 |
|
|
KMS change + BMI change |
–9.1 |
–16.3, –1.9 |
0.01 |
|
–1.8 |
–3.0, –0.5 |
0.01 |
|
–4.4 |
–6.5, –2.3 |
< 0.001 |
|
|
KMS change + CRP change |
–9.3 |
–16.5, –2.0 |
0.01 |
|
–1.7 |
–3.0, –0.5 |
0.01 |
|
–4.3 |
–6.5, –2.2 |
< 0.001 |
|
|
KMS change + comorbidities change |
–9.4 |
–17.0, –1.9 |
0.01 |
|
–1.4* |
–2.5, –0.3 |
0.01 |
|
–4.2 |
–6.5, –2.0 |
< 0.001 |
|
|
KMS change + NSAIDs change |
–9.1 |
–16.3, –1.9 |
0.01 |
|
–1.6* |
–2.8, –0.4 |
0.01 |
|
–4.4 |
–6.5, –2.3 |
< 0.001 |
|
|
KMS change + WOMAC pain change |
–5.7* |
–10.9, –0.5 |
0.03 |
|
–1.5* |
–2.5, –0.4 |
0.01 |
|
–4.2 |
–6.2, –2.2 |
< 0.001 |
|
|
KMS change + PT treatment |
–9.3 |
–16.7, –2.0 |
0.01 |
|
–1.7 |
–3.0, –0.5 |
0.01 |
|
–4.3 |
–6.4, –2.2 |
< 0.001 |
|
3 |
Fully Adjusted Model |
|
|
|
|
|
|
|
|
|
|
|
|
|
KMS change |
–5.7B1 |
–10.9, –0.5 |
0.03 |
|
–1.2B2 |
–2.3, –0.1 |
0.03 |
|
–4.4B3 |
–6.5, –2.3 |
< 0.001 |
|
Linear regression analysis using change in knee muscle strength (KMS) (mean extensor and flexor) as independent factor. Changes in WOMAC-PF (Webster Ontario and McMaster Osteoarthritis index – Physical Function), Get Up and Go test (GUG), time walking up and down a lap of 12 stairs as dependent variables. b: regression coefficient; CI: confidence interval; CRP: C-reactive protein; NSAIDs: non-steroidal anti-inflammatory drugs; PT: physiotherapy. All models were adjusted for baseline activity limitations (analysis of covariance). *Factor affects the coefficient 10% or more. Reduce patient numbers in the multivariate linear regression analyses due to random data missing in the outcome measure or selected variables. 1: Crude Model; 2: Adjusted Model for relevant confounders; 3: Full Adjusted Model for factors affecting the crude coefficient 10% or more: B1Adjusted for WOMAC pain change and baseline WOMAC-PF; B2Adjusted for comorbidities change, NSAIDS change, WOMAC pain change and baseline GUG test; B3Adjusted for baseline stairs test. |
||||||||||||
|
Table IV. Association between knee extensor muscle strength change and changes in activity limitations over 2 years |
||||||||||||
|
|
WOMAC-PF score (0–68) |
|
GUG test (s) |
|
Stairs test (s) |
|||||||
|
b |
95% CI |
p-value |
|
b |
95% CI |
p-value |
|
b |
95% CI |
p-value |
||
|
1 |
Crude Model |
|
|
|
|
|
|
|
|
|
|
|
|
|
Knee extensor muscle strength (EMS) change |
–5.9 |
–11.2, –0.7 |
0.03 |
|
–0.9 |
–2.0, 0.1 |
0.08 |
|
–2.7 |
–4.2, –1.1 |
0.001 |
|
2 |
Adjusted Models |
|
|
|
|
|
|
|
|
|
|
|
|
|
EMS change + gender |
–6.0 |
–11.2, –0.7 |
0.03 |
|
–1.0* |
–2.0, 0.1 |
0.07 |
|
–2.7 |
–4.2, –1.1 |
0.001 |
|
|
EMS change + age |
–5.9 |
–11.1, –0.7 |
0.03 |
|
–0.9 |
–2.0, 0.1 |
0.08 |
|
–2.7 |
–4.2, –1.1 |
0.001 |
|
|
EMS change + BMI change |
–5.7 |
–11.0, –0.4 |
0.03 |
|
–0.9 |
–1.9, 0.2 |
0.10 |
|
–2.6 |
–4.2, –1.1 |
0.001 |
|
|
EMS change + CRP change |
–5.1* |
–10.5, 0.3 |
0.06 |
|
–0.8* |
–1.9, 0.3 |
0.15 |
|
–2.7 |
–4.3, –1.1 |
0.001 |
|
|
EMS change + comorbidities change |
–5.6 |
–11.0, –0.2 |
0.04 |
|
–0.9 |
–1.9, 0.1 |
0.09 |
|
–2.6 |
–4.2, –1.0 |
0.002 |
|
|
EMS change + NSAIDs change |
–5.7 |
–11.0, –0.4 |
0.03 |
|
–0.9 |
–1.9, 0.2 |
0.10 |
|
–2.7 |
–4.2, –1.1 |
0.001 |
|
|
EMS change + WOMAC pain change |
–3.8* |
–7.5, 0.01 |
0.05 |
|
–0.9 |
–2.0, 0.1 |
0.07 |
|
–2.6 |
–4.1, –1.1 |
0.001 |
|
|
EMS change + PT treatment |
–5.8 |
–11.1, –0.4 |
0.04 |
|
–0.9 |
–2.0, 0.1 |
0.09 |
|
–2.6 |
–4.1, –1.0 |
0.001 |
|
3 |
Fully Adjusted Model |
|
|
|
|
|
|
|
|
|
|
|
|
|
EMS change |
–2.8B1 |
–6.6, 1.0 |
0.15 |
|
–0.8B2 |
–1.9, 0.2 |
0.12 |
|
–2.7B3 |
–4.2, –1.1 |
0.001 |
|
Linear regression analysis using change in knee extensor muscle strength as independent factor. Changes in WOMAC-PF (Webster Ontario and McMaster Osteoarthritis index-Physical Function), Get Up and Go test (GUG), time walking up and down a lap of 12 stairs as dependent variables. b: regression coefficient; CI: confidence interval; CRP: C-reactive protein; NSAIDs: non-steroidal anti-inflammatory drugs; PT: physiotherapy. All models were adjusted for baseline activity limitations (analysis of covariance). *Factor affects the coefficient 10% or more. Reduce patient numbers in the multivariate linear regression analyses due to random data missing in the outcome measure or selected variables. 1: Crude Model; 2: Adjusted Model for relevant confounders; 3: Fully Adjusted Model for factors affecting the crude coefficient 10% or more: B1Adjusted for CRP change, WOMAC pain change and baseline WOMAC-PF; B2Adjusted for gender, CRP change and baseline GUG test; B3Adjusted for baseline stairs test. |
||||||||||||
|
Table V. Association between knee flexor muscle strength change and changes in activity limitations over 2 years |
||||||||||||
|
|
WOMAC-PF score (0–68) |
|
GUG test (s) |
|
Stairs test (s) |
|||||||
|
b |
95% CI |
p-value |
|
b |
95% CI |
p-value |
|
b |
95% CI |
p-value |
||
|
1 |
Crude Model |
|
|
|
|
|
|
|
|
|
|
|
|
|
Knee flexor muscle strength (FMS) change |
–13.9 |
–22.3, –5.5 |
0.001 |
|
–1.9 |
–3.4, –0.4 |
0.01 |
|
–7.3 |
–10.3, –4.4 |
< 0.001 |
|
2 |
Adjusted Models |
|
|
|
|
|
|
|
|
|
|
|
|
|
FMS change + gender |
–13.8 |
–22.3, –5.4 |
0.001 |
|
–1.9 |
–3.4, –0.4 |
0.01 |
|
–7.4 |
–10.4, –4.5 |
< 0.001 |
|
|
FMS change + age |
–13.6 |
–21.9, –5.3 |
0.001 |
|
–1.9 |
–3.4, –0.4 |
0.01 |
|
–7.3 |
–10.3, –4.4 |
< 0.001 |
|
|
FMS change + BMI change |
–13.4 |
–21.9, –5.0 |
0.002 |
|
–1.9 |
–3.4, –0.4 |
0.01 |
|
–7.3 |
–10.3, –4.3 |
< 0.001 |
|
|
FMS change + CRP change |
–12.8 |
–21.2, –4.5 |
0.003 |
|
–1.7* |
–3.2, 0.2 |
0.03 |
|
–7.1 |
–10.1, –4.2 |
< 0.001 |
|
|
FMS change + comorbidities change |
–14.7 |
–23.7, –5.8 |
0.001 |
|
–2.0 |
–3.4, –0.6 |
0.01 |
|
–7.5 |
–10.8, –4.3 |
< 0.001 |
|
|
FMS change + NSAIDs change |
–13.1 |
–21.3, –4.7 |
0.003 |
|
–1.6* |
–3.0, –0.1 |
0.03 |
|
–7.3 |
–10.3, –4.3 |
< 0.001 |
|
|
FMS change + WOMAC pain change |
–6.2* |
–12.3, –0.1 |
0.05 |
|
–1.8 |
–3.1, –0.5 |
0.01 |
|
–6.6* |
–9.5, –3.7 |
< 0.001 |
|
|
FMS change + PT treatment |
–14.1 |
–22.8, –5.3 |
0.002 |
|
–1.9 |
–3.4, –0.3 |
0.02 |
|
–7.2 |
–10.3, –4.2 |
< 0.001 |
|
3 |
Fully Adjusted Model |
|
|
|
|
|
|
|
|
|
|
|
|
|
FMS change |
–6.2B1 |
–12.3, –0.1 |
0.05 |
|
–1.4B2 |
–2.9, 0.01 |
0.05 |
|
–6.6B3 |
–9.5, –3.7 |
< 0.001 |
|
Linear regression analysis using change in knee flexor muscle strength as independent factor. Changes in WOMAC-PF (Webster Ontario and McMaster Osteoarthritis index-Physical Function), Get Up and Go test (GUG), time walking up and down a lap of 12 stairs as dependent variables. b: regression coefficient; CI: confidence interval; CRP: C-reactive protein; NSAIDs: non-steroidal anti-inflammatory drugs; PT: physiotherapy. All the models were adjusted for the baseline activity limitations (analysis of covariance). *Factor affects the coefficient 10% or more. Reduce patient numbers in the multivariate linear regression analyses due to random data missing in the outcome measure or selected variables. 1: Crude Model; 2: Adjusted Model for relevant confounders; 3: Fully Adjusted Model for factors affecting the crude coefficient 10% or more: B1Adjusted for WOMAC pain change and baseline WOMAC-PF; B2Adjusted for CRP change, NSAIDS change and baseline GUG test; B3Adjusted for WOMAC pain change and baseline stairs test. |
||||||||||||
Possible effect of physical therapy
Additional analysis revealed that the association between increase in muscle strength and decrease in activity limitations occurred among those subjects who had received physical therapy interventions, and not among subjects who did not receive physical therapy (Table VI).
|
Table VI. Association between knee muscle strength change and changes in activity limitations over 2 years (n = 186) |
|||||||||||
|
|
WOMAC-PF score (0–68) |
|
GUG test (s) |
|
Stairs test (s) |
||||||
|
b |
95% CI |
p-value |
|
b |
95% CI |
p-value |
|
b |
95% CI |
p-value |
|
|
Subjects reporting PT treatment (n = 149) |
|||||||||||
|
Knee muscle strength (FMS) change |
–10.3 |
–18.1, –2.4 |
0.011 |
|
–1.7 |
–3.2, –0.4 |
0.010 |
|
–4.4 |
–6.8, –2.1 |
< 0.001 |
|
Knee extensor muscle strength (FMS) change |
–6.9 |
–12.8, –1.1 |
0.020 |
|
–1.0 |
–2.2, 0.2 |
0.095 |
|
–2.9 |
–4.6, –1.2 |
0.001 |
|
Knee flexor muscle strength (FMS) change |
–14.5 |
–23.8, –5.1 |
0.003 |
|
–2.0 |
–3.7, –0.3 |
0.021 |
|
–7.1 |
–10.5, –3.8 |
< 0.001 |
|
Subjects not reporting PT treatment (n = 37) |
|||||||||||
|
Knee muscle strength (FMS) change |
–3.9 |
–25.7, 17.7 |
0.714 |
|
–1.7 |
–4.7, 1.2 |
0.239 |
|
–2.9 |
–8.5, 2.8 |
0.308 |
|
Knee extensor muscle strength (FMS) change |
–0.9 |
–14.7, 12.9 |
0.901 |
|
–0.8 |
–2.7, 1.0 |
0.396 |
|
–1.0 |
–4.5, 2.6 |
0.576 |
|
Knee flexor muscle strength (FMS) change |
–10.7 |
–37.3, 15.8 |
0.417 |
|
–1.2 |
–5.1, 2.6 |
0.507 |
|
–3.8 |
–10.9, 3.2 |
0.278 |
|
Linear regression analysis using change in knee muscle strength (KMS) as independent factor. Changes in WOMAC-PF (Webster Ontario and McMaster Osteoarthritis index-Physical Function), Get Up and Go test (GUG), time walking up and down a lap of 12 stairs as dependent variables. b: regression coefficient; CI: confidence interval; CRP: C-reactive protein; NSAIDs: non-steroidal anti-inflammatory drugs; PT: physiotherapy. All models were adjusted for baseline activity limitations (analysis of covariance). |
|||||||||||
DISCUSSION
This study showed an association between increase in muscle strength and a decrease in activity limitations in patients with established knee OA at 2 years. This association suggests that muscle strength may partially explain the between-patients variability in the course of activity limitations. To the best of our knowledge, and based on a thorough review of the literature, this is the first observational study to describe the longitudinal association between knee muscle strength (extensor and flexor muscles separately, and averaged) and activity limitations in patients with established knee OA.
This study represents an extension of evidence from previous cross-sectional, prediction models and intervention studies (4–6, 9, 10, 12), which have previously reported an association between knee muscle strength and activity limitations. The additional value of the current observational study is the longitudinal association between knee extensor and flexor muscles strength separately, as well as mean knee muscle strength, with activity limitations in patients with established knee OA. A longitudinal association was found for increases in mean knee muscle strength and in knee flexor muscles strength, and a decrease in all the measures of activity limitations assessed. However, increase in knee extensor muscle strength was associated only with a decrease in the stairs tests, which is a highly demanding performance activity. Moreover, the overall association found in the present study was confirmed in another longitudinal study carried out by our research group in patients with early OA (31).
Eighty percent of the study population reported having received some type of physical therapy intervention during the 2-year follow-up. This could explain the overall increase in muscle strength and decrease in activity limitations in the study group at 2 years. This interpretation is in line with the observation that the association between increase in muscle strength and decrease in activity limitations was limited to those subjects who had received physical therapy interventions. Previous evidence has suggested that muscle weakness may precede activity limitations in patients with knee OA (7, 10); with improvement seen after muscle strengthening interventions (32–36). The linear relationship between increased muscle strength and decreased activity limitations might be explained by the important role of muscle function in the knee joint. The muscles around the knee control the stop/start of the joint motion, add stability and redistribute joint load. In addition, appropriate co-contraction of the knee extensor and flexor muscles allows the upright position to be maintained, compensating for gravity during standing or while performing activities (4). Besides the direct association between improvement in muscle strength and decrease in activity limitations, which can probably be explained by the participation of 80% of the study group in some kind of physical therapy, it is possible that indirect pathways may also have influenced this relationship. For example, it is probable that an improvement in muscle strength might contribute to an increase in self-confidence, resulting in better performance of activities.
The strength of the association between change in muscle strength and change in activity limitations was moderate (stairs test r = –0.26, p = 0.001 and GUG tests r = –0.23, p = 0.005). However, given the small changes in strength and activity limitations, the observed association is of considerable interest. There was stronger association between change in mean knee muscle strength and change in performance-based tests (stairs test r = –0.26, p = 0.001 and GUG test r = –0.23, p = 0.005) than with changes in self-reported activity limitations (WOMAC-PF r = –0.16, p = 0.031). This may be due to the influence of additional psychosocial factors potentially involved in a self-reported measure such as WOMAC-PF. Increase in knee extensor muscle strength was associated with better performance on the stairs test at 2 years, while increase in knee flexor muscle strength was associated not only with better performance tests, but also with a decrease in self-reported activity limitations at 2-year follow-up. Knee flexor muscles are usually weaker than knee extensor muscles (37). This strength imbalance is partly due to the larger size of the main knee extensor muscles (quadriceps) compared with the main flexors muscles (hamstrings). Although more attention has commonly been given to the assessment of knee extensor muscles due to their leading role within activity limitations (38–40), the findings of the present study suggest a relevant involvement of knee flexor muscles in activity limitations over time in patients with OA, highlighting the importance of incorporating training of these muscles in intervention programmes.
Study limitations and strengths
Some limitations of this study must be taken into account. First, 25% of patients dropped out the study at follow-up. However, the relevant baseline characteristics were not statistically different between patients who completed and did not complete the follow-up assessment (Table I), which makes us believe that this loss of patients at follow-up did not impact the results of our study. It is possible that the patients who did not attend the follow-up assessment might have had a decline in their overall condition, including a decrease in muscle strength and an increase in activity limitations, which might have prevented them from visiting the assessment centre. On the other hand, the opposite may also have occurred: patients who experienced an improvement in their condition might no longer be interested in taking part in the study. The loss of patients may thus have caused either an under- or over-estimation of our results. Secondly, it was not possible to collect exact information about the quantity or kind of physical therapy treatment received by the patients. This was because the physical therapy reported did not necessarily take place at our rehabilitation centre. Therefore, only dichotomous information about receiving therapy or not (yes/no) was available.
A significant positive change in muscle strength was observed in the group of patients who received (n = 149) compared with the group who did not receive (n = 37) physical therapy during the follow-up period (data not shown). However, as the group who did not receive physical therapy was very small, no separate analyses were presented. Nevertheless, this potential confounder was considered in the study, and the crude coefficient was not affected after adjusting the model for physical therapy treatment. Key strengths of our study are the large number of patients with knee OA (n=186) studied and a longitudinal design.
Further research
From a clinical perspective, the results of this study support muscle strength training interventions in patients with knee OA. Previous intervention studies have found muscle strength training interventions to be effective to decrease activity limitations in patients with knee OA (32–36). However, the optimal type and amount of exercise to be implemented require further definition. In addition, these results highlight the importance of training both knee extensor and flexor muscles within the intervention programmes. Overall, in patients with OA, optimal delivery of muscle strength training might contribute to a decrease in activity limitations and to a subsequent decrease in participation restrictions. However, further longitudinal observational-studies are needed to test these hypotheses in a larger group of patients with established knee OA. We also suggest incorporating multiple assessment times over a longer follow-up period in order to determine the progression of the changes and the associations.
In conclusion, an increase in knee muscle strength, mainly in the knee flexor muscles, was associated with a decrease in activity limitation in patients with knee OA after 2 years. These results suggest that muscle strength may partially explain the between-patient variability in activity limitations over time.
ACKNOWLEDGEMENTS
This research was funded by the European Commission through MOVE-AGE, an Erasmus Mundus Joint Doctorate programme (2011–0015). The study sponsor had no involvement in the study. The authors would like to thank J. Bruinsma-Sier and A. Bus for their help in contacting the patients.
REFERENCES

