


1Department of Dermatology, University Hospital of Brest, 2Laboratoire Interactions Epitheliums Neurones (LIEN), University of Brest, Brest, France, and 3Department of Dermatology, Charité Universitaetsmedizin, Berlin, Germany
Sensitive skin is commonly assessed on the basis of self-reports from patients, and sometimes questionnaires, such as the Sensitive Scale-10, are used. The severity of sensitive skin follows a continuum, from the absence of sensitive skin to very sensitive skin. The aims of this cross-sectional study were to compare subjects with and without symptomatic sensitive skin and to propose diagnostic criteria for sensitive skin. A total of 160 women, between 18 and 65 years of age, with and without sensitive skin, and without any associated skin diseases, were recruited. Mean age was 41 years old. Fifty-five percent of participants reported having “very sensitive” or “sensitive” skin. In the sensitive skin group, the participants mainly experienced skin irritability (100%), tautness (97.5%), discomfort (90%) and redness (90%). According to the receiver operating characteristic curve, a Sensitive Scale-10 (SS-10) cut-off value of 12.7 can be used to detect sensitive skin (with a sensitivity of 72.4% and specificity of 90.3%).
Key words: sensitive skin; reactive skin; BoSS scale; Sensitive Scale; SS-10 score, itch.
Accepted Jan 5, 2021; Epub ahead of print Jan 11, 2021
Acta Derm Venereol 2021; 101: adv00373.
doi: 10.2340/00015555-3741
Corr: Emilie Brenaut, Department of Dermatology, University Hospital, FR-29609 Brest cedex, France. E-mail: emilie.brenaut@chu-brest.fr
Sensitive skin is commonly assessed on the basis of self-reports from patients, and sometimes questionnaires, such as the Sensitive Scale 10 (SS-10), are used. The severity of sensitive skin follows a continuum, from the absence of sensitive skin to very sensitive skin. On the basis of the results of this study of 160 healthy women volunteers, it is proposed that a score greater than 13 on the SS-10 can be used as the cut-off to diagnose sensitive skin, and a score greater than 5 can be used as the cut-off to diagnose slightly sensitive skin.
Sensitive skin is common in the general population. The special interest group (SIG) on sensitive skin within the International Forum for the Study of Itch (IFSI) characterized sensitive skin as the occurrence of unpleasant sensations (stinging, burning, pain, pruritus and tingling sensations) in response to stimuli that normally do not provoke such sensations. The skin can appear normal or be accompanied by erythema (1)in patients, and among subjects suffering from itch. The International Forum for the Study of Itch (IFSI. Sensitive skin affects approximately half of the population and is more frequent in women than in men (2, 3). This chronic relapsing-remitting syndrome can have a significant impact on quality of life.
Pathophysiological mechanisms have been debated, and several hypotheses coexist (4) burning, pain, pruritus and tingling sensations. Sensitive skin can be considered a decrease in the tolerance threshold of the skin due to impaired barrier function and abnormalities in the cutaneous nervous system, making the skin hyper-reactive (5). Sensitive skin can therefore be the clinical expression of neurogenic inflammation and can be modulated by many factors. Triggering factors of sensitive skin can be physical (ultraviolet, heat, cold and wind), chemical (cosmetics, water and pollutants), and occasionally psychological (stress) (6). A recent meta-analysis showed that the most important triggering factor is the use of cosmetics, with an odds ratio (OR) >7 (6). However, data on the exact amount of consumption of cosmetic products among the population with sensitive skin are not available. In this context, the SENSICOS study was designed, by us, to assess the relationship between the use of cosmetics and sensitive skin.
In addition, skin is frequently not sensitive, but can be slightly, moderately or severely sensitive. Scales have been proposed to assess the severity of sensitive skin. These assessment tools have shown that there is large variability among individuals, and that there is no clear delineation between individuals without sensitive skin and those with sensitive skin. The IFSI SIG on sensitive skin reported that a defined cut-off was required, as well as proper tools to assess the severity of sensitive skin (1)in patients, and among subjects suffering from itch. The International Forum for the Study of Itch (IFSI. Sensitive skin is largely a subjective syndrome. Consequently, it is mainly diagnosed and assessed by interviews. In a large number of studies, subjects have often been asked if they have “very sensitive, sensitive, slightly sensitive or no sensitive skin at all”. The Sensitive Scale-10 (SS-10) is a scale used to evaluate the severity of sensitive skin; it includes 10 items, and results in a score called the SS-10 score (7). To date, no cut-offs have been defined to diagnose sensitive skin, which might be helpful for researchers conducting studies on sensitive skin as well as clinicians.
The aim of this study was to compare the characteristics of subjects with and without very symptomatic sensitive skin according to the SS-10 score. In addition, the study aimed to define cut-offs for the diagnosis of sensitive skin.
This monocentric prospective study was performed in the dermatology department of the University Hospital of Brest. Participants were recruited in 3 ways: an e-mail to the employees of the hospital; an announcement in a free local newspaper; and word-of-mouth among the researcher’s acquaintances. In the announcement, it was stated that the study was open to women between 18 and 65 years of age, with and without sensitive skin, regardless of their level of use of cosmetics.
Inclusion criteria were: women between 18 and 65 years old without any facial skin diseases. Exclusion criteria were: males, women aged less than 18 years or more than 65 years, individuals with a facial skin disease (e.g. eczema, rosacea, acne, psoriasis, seborrheic dermatitis), and individuals who refused to participate. A total of 160 subjects were recruited to the study.
The subjects were invited to visit the dermatology department for an appointment with a dermatologist. An information letter was given to all of them, providing information about the aim of the study and the methods. The definition of sensitive skin proposed by the IFSI was explained (4)burning, pain, pruritus and tingling sensations. The subjects did not receive any compensation. A clinical examination was performed to confirm the absence of a skin disease to ensure that the subjects met the inclusion criteria. A variety of data were recorded: whether patients had a history of atopic dermatitis; their skin phototype; their facial erythema (rated from 0 to 10); and their skin type (normal, oily, dry or mixed skin).
Then, all subjects completed different questionnaires on the following sociodemographic factors and factors related to the burden of sensitive skin.
Sociodemographic parameters
The sociodemographic factors included age, location of residence, weight, height, hormonal status, smoking status, and socio- professional category.
Sensitive skin on the face
The following question about sensitive skin and a question about the frequency of sensitive skin symptoms were asked to the volunteers: “Is your skin very sensitive, sensitive, slightly sensitive, not sensitive at all?”
SS-10 was used to evaluate 10 signs felt on the face within the last 3 days (skin irritability, stinging, burning, sensations of heat, tautness, itching, pain, skin discomfort, flushes, redness) on a scale from 0 (no intensity) to 10 (unbearable intensity). The final score (SS-10) varied between 0 and 100 (7).
The triggering factors of sensitive skin, the location, and duration of symptoms were also assessed.
Burden of sensitive skin
The Burden of Sensitive Skin questionnaire (BoSS) was used to evaluate the impact of sensitive skin (8). It consists of 14 items that are assessed on a scale from 0 (never) to 4 (constantly) and address 3 dimensions: personal care, daily life, and appearance. The total score ranges from 0 to 56.
Descriptive statistics were presented as the means and standard deviations (SDs) for the quantitative variables and as percentages for the qualitative variables. For group comparisons, the Mann–Whitney U test or the Kruskal–Wallis test were applied, as appropriate. A correlation analysis (Pearson’s correlation coefficient) was used to assess the link between the scores for the 10 items of the SS-10 and the final SS-10 score. p < 0.05 indicated statistical significance. Statistical analyses were performed using XLSTAT 2019.1 (Addinsoft, Paris, France). To determine the cut-offs of sensitive skin, receiver operating characteristic (ROC) curves were drawn, and the sensitivity and specificity were calculated.
The study was registered on ClinicalTrials.gov with the title “Impact of Exposure to Cosmetics on Sensitive Skin (SENSICOS)”; identifier NCT03958968. The study protocol was approved by the ethics committee (29BRC18.0078).
Recruitment and subjects
A total of 160 women volunteers were included between July and October 2019. Concerning recruitment, 38% of the subjects were acquaintances of the team members, 36% saw the announcement in the newspaper, and 26% saw the e-mail sent to the hospital employees. The mean ± SD age of the participants was 41 ± 13 years (range 19–65). The distribution of participants from the city of Brest (51%) and the peri-urban and rural areas around Brest (49%) was fairly balanced. Concerning the socio-professional categories, 34% of the participants were employees, 29% were managers, 14% were classified as having intermediate professions, and 14% were students. The mean ± SD body mass index (BMI) was 23 ± 4 kg/m2. Regarding hormonal status, 6% of participants were peri-menopausal, and 24% were menopausal. Concerning smoking status, 80% were non-smokers, 14% reported smoking fewer than 10 cigarettes a day, 3% reported smoking more than 10 cigarettes a day, and 3% used electronic cigarettes. Most of the participants had phototypes II and III (43% each). Thirty-four percent had mixed skin, 28% had normal skin, 28% had dry skin and 10% had oily skin. A history of atopic dermatitis was present in 8.1% of participants. The facial erythema score was evaluated by the dermatologist to be 0 for 22% of the subjects, 1 for 18%, 2 for 28%, 3 for 15%, 4 for 10% and ≥ 5 for 9%.
Distribution of sensitive skin
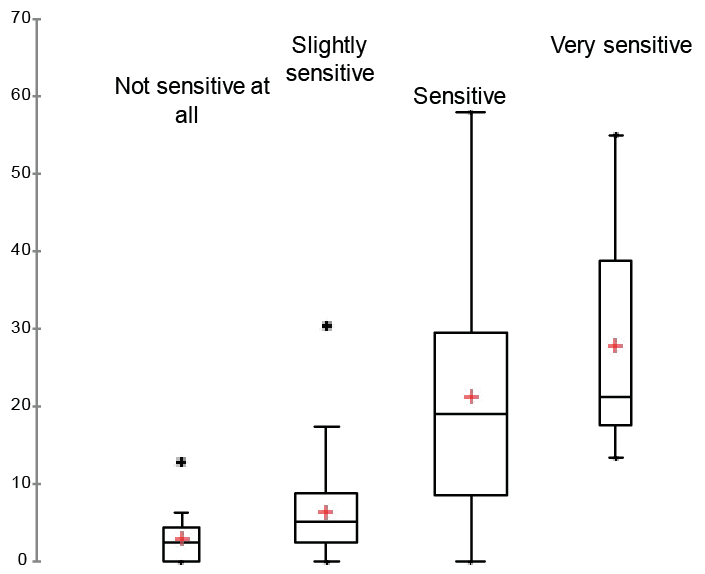
Regarding the presence of sensitive skin on the face, 9% of participants reported having “very sensitive skin”, 46% reported having “sensitive skin”, 34% reported having “slightly sensitive skin” and 11% reported having “skin that is not sensitive at all”. The mean ± SD SS-10 score was 14.8 ± 14.4 (range 0–58). The mean SS-10 score was 27.8 ± 14.7 for the “very sensitive” group, 21.4 ± 14.9 for the “sensitive” group, 6.4 ± 5.7 for the “slightly sensitive” group, and 2.9 ± 3.4 for the “not sensitive at all” group. SS-10 scores in each group are shown in Fig. 1. A Kruskal–Wallis statistical test was performed between the 4 groups. The group “very sensitive” had a SS-10 statistically different from the group “slightly sensitive” (p < 0.01) and “not sensitive (p < 0.01), but not from the group “sensitive” (p = 0.11). The SS-10 of the group “slightly sensitive” was statistically different from the group “sensitive” (p < 0.01). The SS-10 of the group “slightly sensitive” was not statistically different from the group “not sensitive” (p = 0.06).
Fig. 1. Sensitive Scale 10 (SS-10) score stratified by category of sensitive skin (n = 160).
Groups according to the Sensitive Scale-10 score
To compare subjects with and without sensitive skin, 2 separate groups of 40 women were created on the basis of the SS-10 score: the group with the lowest SS-10 scores was called the “non-sensitive skin group”, and the group with the highest scores was called the “sensitive skin group”. The distribution of the SS-10 in the sample and the 2 groups are shown in Fig. 2. The mean ± SD SS-10 score was 1.5 ± 1.5 in the non-sensitive skin group (scores between 0 and 4) and 35.9 ± 10.6 in the sensitive skin group (scores between 21.4 and 58). A statistically significant difference was observed in the scores between the 2 groups (p < 0.0001, Mann–Whitney U test).
Fig. 2. Distribution of the Sensitive Scale 10 (SS-10) among the sample and creation of the 2 groups: the 25% with the lowest and the highest SS-10 scores (n = 160).
Characteristics of sensitive skin
Among the subjects from the sensitive skin group, sensitive skin was present for more than 10 years for 70% of subjects, for 5–10 years for 10%, for 3–5 years for 10%, and for 1–3 years for 7.5%; none of the subjects had sensitive skin for less than one year. The location of the sensitive skin was as follows: the entire face for 25% of subjects, the cheeks for 72.5%, the nose and around the eyes for 37.5% each, the forehead for 35%, the scalp for 30%, the chin for 22.5%, and the ears for 7.5%. The triggering factors reported by these subjects were cold temperatures for 97.5% of subjects, variations in temperature for 95%, sun exposure for 82.5%, water for 80%, heat for 75%, wind for 72.5%, emotions for 67.5%, dry air for 62.5%, pollution for 50%, menstrual cycle for 47.5%, cosmetic products for 45%, air conditioning for 40%, work for 20%, jewellery for 20%, and clothes for 12.5%.
Sensitive skin according to various factors
The Mann–Whitney U test was used to assess the differences between the non-sensitive skin and sensitive skin groups in the SS-10 score with respect to general medical data. No statistically significant differences were observed between the 2 groups in age (p = 0.743), BMI (p = 0.141), menopause status (p = 0.112), smoking status (p = 0.914) or having a history of atopic dermatitis (p = 0.29). The distributions of phototypes and skin types between the 2 groups are shown in Fig. 3. The subjects in the sensitive skin group had a paler phototype than did those in the non-sensitive skin group: 52.5% and 27.5% of the subjects in the sensitive skin and non-sensitive skin groups, respectively, had phototype II skin. Moreover, 32.5% and 57.5% of the subjects in the sensitive skin and non-sensitive skin groups, respectively, had phototype III skin. In the sensitive skin group, the subjects more often presented with mixed (42.5%) or dry skin (35%), whereas in the non-sensitive skin group, the subjects presented more often had normal (45%) or oily skin (22.5%). A statistically significant difference was observed between these 2 groups in the phototype (p = 0.010) and skin type (p = 0.030).
Fig. 3. Distributions of (a) skin types and (b) phototypes in the sensitive skin group (n = 40) and non-sensitive skin group (n = 40).
Items of the Sensitive Scale-10
Among all subjects, the main symptoms reported in the SS-10 (1 or more on 10) were skin irritability (79.2%), tautness (72.3%) and redness (64.8%), whereas only 9.4% reported pain. In the sensitive skin group, the 40 participants mainly experienced irritability (100%), tautness (97.5%), discomfort (90%) and redness (90%), and only 27.5% experienced pain. In the non-sensitive skin group, the 40 participants mainly experienced irritability (37.5%), tautness (35%), redness (17.5%) and pruritus, discomfort, and flushes (7.5% each).
A correlation analysis (Pearson’s correlation coefficient) was performed between the scores of the 10 items of the SS-10 and the final SS-10 score. A positive and statistically significant correlation was found between each of the 10 parameters involved in the calculation of the SS-10 and its final score for the entire sampled population. These strongest correlations were with irritability (0.826), discomfort (0.822), tautness (0.779) and redness (0.758). The weakest correlation was with pain (0.285). In the sensitive skin group, a positive and statistically significant correlation was found between discomfort (0.596), burning sensations (0.590), skin irritability (0.568), tingling (0.530), tightness (0.470), redness (0.434), heat (0.428), and flushing (0.331) and the final SS-10 score. A positive, but not statistically significant, correlation was observed with the itching parameter. There was no correlation with pain (0.044).
In the non-sensitive skin group, a positive and statistically significant correlation was found between tautness (0.587), redness (0.459), and irritability (0.400) and the final SS-10 score. A positive correlation was observed for the parameters heat, pruritus, discomfort, and flushing, but the correlations were not statistically significant. The weakest correlation was with the parameter heat (0.119).
Burden of sensitive skin
The mean BoSS score (obtained for 157 participants because of 3 missing data points) was 16.6 ± 10.0 (range 0–43). Among the 14 items of the BoSS score items, the main signs that were reported were as follows: “when I play sports, go for a brisk walk or climb stairs, my face gets red” (73.9%), “when I buy cosmetics, I take my sensitive skin into account” (73.2%) and “wearing wool clothing on my skin is unbearable for me” (66.2%). A positive and statistically significant correlation (p < 0.0001) was found between each of the 14 items included in the BoSS score and the final BoSS score. The strongest correlation was with the following sign: “when I buy cosmetic products, I take my sensitive skin into account” (0.721).
Correlation between the scores of sensitive skin
A positive (p = 0.567) and statistically significant (p < 0.0001) correlation was observed between the SS-10 score and the BoSS score (Fig. 4).
Fig. 4. Correlation between Sensitivity Scale 10 (SS-10) and Burden of Sensitive Skin questionnaire (BoSS) scores (n = 160).
Cut-offs of Sensitive Scale-10 for the diagnosis of sensitive skin
To determine a cut-off for the diagnosis of sensitive skin, subjects who responded that they have “very sensitive or sensitive skin” were considered to have positive cases of sensitive skin (n = 87; 55%). The ROC curve is shown in Fig. 5. The area under the curve (AUC) of the ROC curve was 0.873 (95% confidence interval (95% CI) 0.819–0.928, standard error 0.028), suggesting that the score has good diagnostic ability in the currentpopulation. A cut-off value of 12.7 yielded a sensitivity of 72.4% and a specificity of 90.3%. The sensitivity and specificity of the SS-10 score are shown in Table SI. To determine a cut-off for slightly sensitive skin, subjects who responded that they have “very sensitive, sensitive or slightly sensitive skin” were considered to have positive cases of sensitive skin (n = 141; 89%). The area under the curve (AUC) of the ROC curve was 0.855 (95% CI 0.781–0.929, standard error 0.038). A cut-off value of 5.0 yielded a sensitivity of 74.5% and a specificity of 88.9% (Table SII).
Fig. 5. Receiver operating characteristic (ROC) curve analysis of the sensitivity and specificity of the Sensitivity Scale 10 (SS-10) score in subjects with very sensitive and sensitive skin (n = 160).
Because sensitive skin is a subjective syndrome, it is diagnosed by interviewing subjects and asking them whether they have sensitive skin. A questionnaire, the SS-10, was developed in 2014 as a tool to evaluate the severity of sensitive skin. In the majority of studies on sensitive skin, particularly those conducted by phone or web survey, subjects were asked if they had very sensitive, sensitive, or slightly sensitive skin, or skin that was not sensitive at all. The current study provides data on the correlations between the SS-10 score and the score for these 4 categories. There is a clear link between people’s reports (4 items on the severity of sensitive skin) and the outcomes of the SS-10, as shown in Fig. 1. Hence, the SS-10 scale is well constructed and useful for evaluating sensitive skin severity. Consequently, the SS-10 could be used to determine a cut-off for the diagnosis of sensitive skin. According to the results of this study, a score greater than 13 on the SS-10 is proposed for the cut-off value for a diagnosis of sensitive skin, and a score less than 5 for the cut-off for the absence of sensitive skin. To our knowledge, only one previous study has proposed a cut-off for the SS-10 score. Chan et al. (9) proposed that a score of 25.5 was associated with a sensitivity of 91.7% and a specificity of 75.5%. In their study, only 7.56% of subjects were considered to have sensitive skin, while the prevalence rate of sensitive skin has been considered to be higher in previous studies (3, 10–12). In this study (9), the authors claimed that the diagnosis of “true sensitive skin” was made by a dermatologist with the definition provided by the IFSI. In the current study, subjects received a letter explaining the aim of the study and the definition of sensitive skin proposed by the IFSI before responding to the questionnaire, so that they understood the meaning of sensitive skin. Indeed, an issue is that it is difficult to identify people who have “truly sensitive skin”, because it is a subjective syndrome.
Fair skin phototypes were more frequently associated with sensitive skin, which is consistent with the results of previous studies (11, 12). The relationship between sensitive skin and these phototypes could be related to a smaller epidermal thickness and higher vascular reactivity in subjects with fair phototypes (13). In the current study, dark skin phototypes were poorly represented, which is explained by the location of patient recruitment for the study (Brittanny, France). Sensitive skin more frequently occurred in subjects with mixed and dry skin, which is also consistent with the results of previous studies (11, 12) and can be explained by the barrier function of skin being more impaired in people with these skin types. Age was not correlated with the presence of sensitive skin. There are conflicting studies concerning sensitive skin and age. In a study with a large sample, of 5,000 subjects, the prevalence of sensitive skin was higher in subjects under 35 years old (12). Smoking status, BMI, hormonal status and facial erythema were not associated with the presence of sensitive skin. In our sample, 8.1% reported having a history of atopic dermatitis, without any association with sensitive skin. In another study including 5,000 subjects interviewed, 17.8% reported a history of atopic dermatitis in infancy, and sensitive skin occurred more frequently in these subjects (OR 2.51) (12). This difference in frequency can be explained by the clinical examination, which allowed us to exclude subjects with skin lesions, such as atopic dermatitis, to be consistent with the definition of sensitive skin.
The main strength of this study was that all subjects were examined by a dermatologist, whereas the majority of previous studies were conducted by a web survey or phone interviews (6). This examination allowed us to exclude subjects with concomitant facial skin diseases and to adhere to the definition of sensitive skin: “unpleasant sensations that cannot be explained by lesions attributable to any skin disease”. Dermatological data, such as the skin type and phototype, were also recorded.
We chose to include only women, in order to focus on a homogenous population, because sensitive skin mostly affects women (3, 11, 12, 14, 15) and because they use more cosmetic products (mean of 16 products per day) than do men (mean of 8 products per day) (16). We chose to analyse the face only, whereas the sensitive skin can affect different parts of the body, because the face is the most affected location (3), where cosmetics are largely applied (10). Within the face, it seemed that the cheeks were most affected by sensitive skin, perhaps because the cheeks are an area where cosmetics are applied more often. Considering that skin sensitivity in France is largely spread across the country, and that no real differences in cosmetic product consumption are measured between regions (16) (except for sunscreen products) (17), we decided to limit the sampling to locations around Brest. Compared with the data of the national institute of statistics on French women over the age of 15 years (https://www.insee.fr/fr/statistiques/2489546), the data in the current study shows an over-representation of managerial jobs (29% vs 8%). Inactive persons who have already worked are under-represented in the panel compared with national data (3% compared with 35%). This result can be explained by the location and means used to recruit volunteers. However, it has been demonstrated in previous studies that there is no significant difference in sensitive skin across socio-professional categories (11). Another limitation of this study is that recruitment bias may be present. We could not control whether more people with or without sensitive skin responded to the announcement, but we specified that all persons with or without sensitive skin were invited to participate. Finally, the questionnaire BoSS was used to evaluate the quality of life, but some questions in this tool are not adapted for the face, such as “wear woollen clothes”.
The prevalence of sensitive skin was approximately 55% in groups with very sensitive skin and sensitive skin, which is consistent with the findings of a recent literature review (6), in which the prevalence of sensitive skin was between 41% and 68% of the population. In the sensitive skin group, sensitive skin had been present for more than 10 years for a majority of women, which proves the chronic nature of this syndrome. The positive correlation between the SS-10 and BoSS scores supports the fact that sensitive skin has an impact on quality of life.
In conclusion, based on the results of this study, it is proposed that a score greater than 13 on the SS-10 can be used as the cut-off to diagnose sensitive skin, and a score greater than 5 can be used as the cut-off to diagnose slightly sensitive skin.
The authors thank Paul Fassier-Frisque for recruiting volunteers.
The authors have no conflicts of interest to declare.


 Click to show fullsize
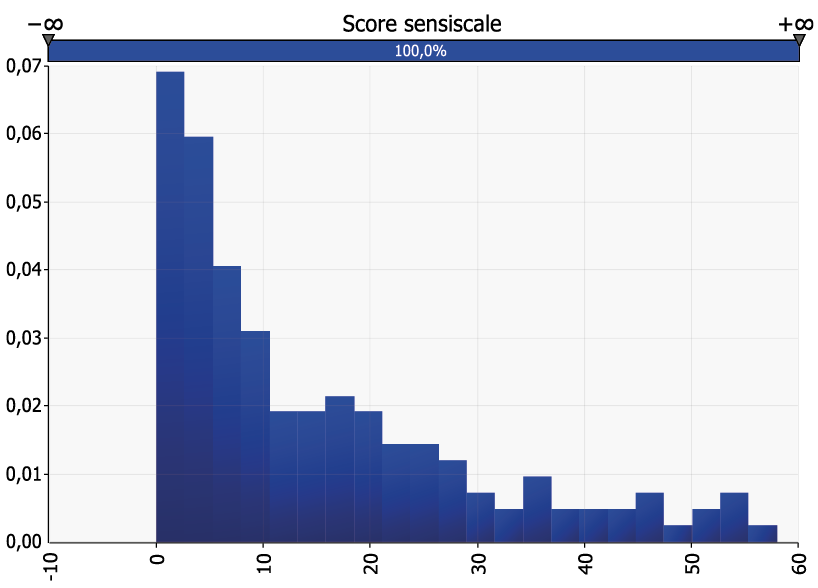 Click to show fullsize
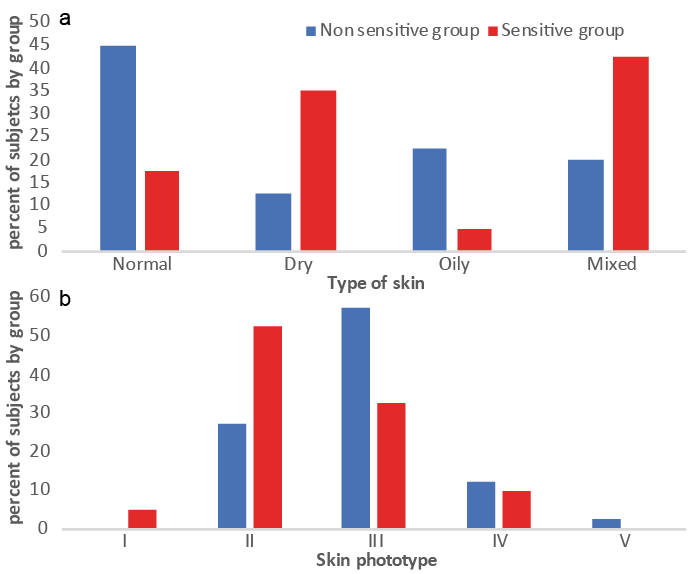 Click to show fullsize
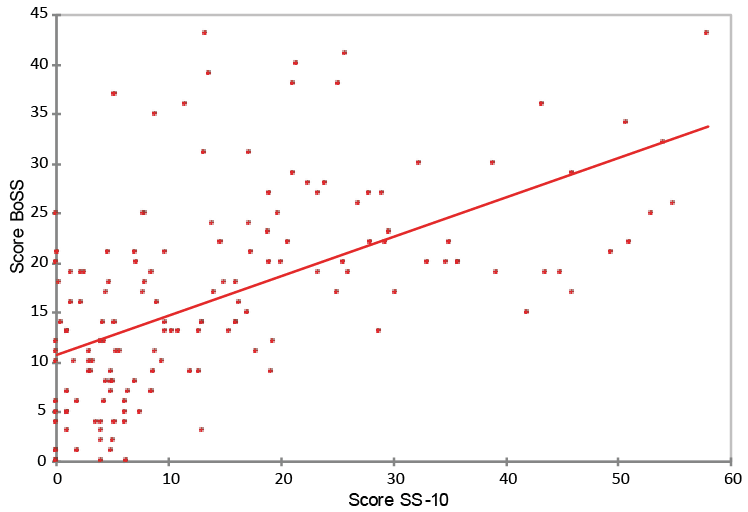 Click to show fullsize
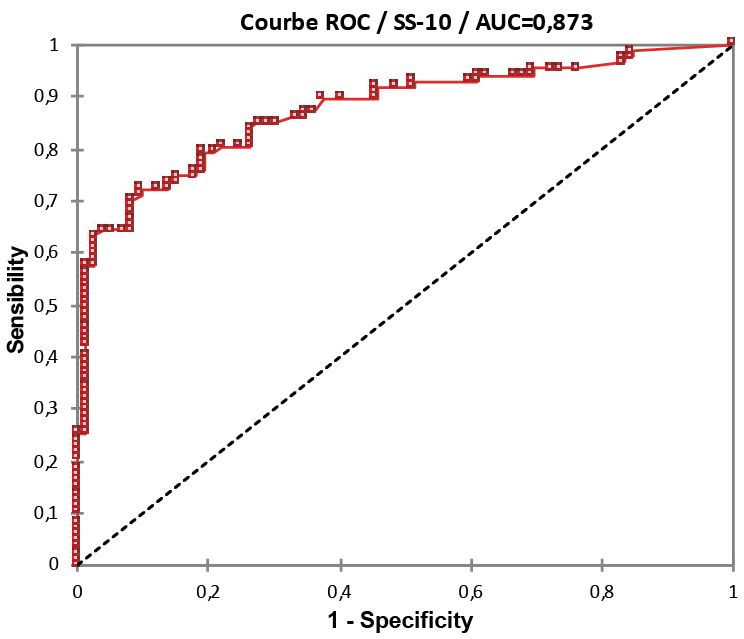 Click to show fullsize