OBJECTIVE: To highlight the prevalence of manual and/or powered wheelchair use within the general French population living at home or in institutions, to describe the users and to identify factors determining wheelchair use.
METHODS: Data were obtained from national community-based Handicaps-Incapacités-Dépendance surveys on disability and dependency carried out on 2 representative samples of the French population in institutions (n = 15,288) and at home (n = 16,945).
RESULTS: The prevalence of wheelchair use is 62 per 10,000 people living in France. Forty-three percent of users live in institutions. They frequently show multiple impairments and severe disabilities. They have a mean age of 70 years and 64% are women. After taking confounding factors into account, results show that wheelchair use is not sex-related and decreases slightly with age. On the other hand, wheelchair use is related to widowhood, to the extent of impairments and disabilities, to confinement, to exposure to environmental obstacles and to institutional life.
CONCLUSION: Sociodemographic studies on the use of wheelchairs need to pay greater attention to people living in institutions. The prevalence of wheelchair use in France appears to be far lower than in other western countries, and this observation needs to be examined further with intercultural comparisons.
Key words: France, wheelchair, disability, social epidemiology, assistive device, demography, community-based survey.
J Rehabil Med 2008; 40: 231–239
Correspondence address: Jean-François Ravaud, CERMES, Site CNRS, 7 rue Guy Môquet, FR-94801 Villejuif Cedex, France. E-mail: ravaud@vjf.cnrs.fr
Submitted April 23, 2007; accepted October 25, 2007
Introduction
Wheelchairs have a long history (1); the first models were heavy, made of wood, and designed to allow third parties to move patients around inside hospitals. Wheelchairs that could be used more readily at home first appeared in the 1940s, between the World Wars. The most famous of these was the Everest and Jennings (E&J) model, developed in California in 1933 (2), which was lighter, self-propelled and could be folded. In Canada, the E&J wheelchair was used by Second World War veterans with spinal cord injuries (3). Its lighter weight and folding mechanism made it easier to transport, enabling veterans to be mobile, to return home and to have improved social lives. Other Canadians with spinal cord injuries soon followed the veterans’ example (4) and the number of wheelchair users in Canada has continued to rise ever since. In 1986, there were 179,300 wheelchair users, i.e. 71 users per 10,000 Canadians, half of whom lived at home (36 per 10,000) (5). Data gathered in 2000–01 show a clear increase (60 per 10,000) in the prevalence among Canadians over the age of 12 years living at home (6).
A high prevalence of wheelchair users is also found in other countries, such as the USA, where there were an estimated 2.7 million wheelchair users living at home in 2002 (7). In 1995 there were already 1.6 million home users (61 users per 10,000 people living at home) (8), following an increase in prevalence of 96% between 1980 and 1990, and of 11% between 1990 and 1995 (9). In UK the number of users rose from 360,000 in 1986 (10) to 710,000 in 1996 (11), reaching 1,200,000 in 2000 (i.e. almost 2% of the total population of UK) (12).
Despite the limited data available, very few peer-reviewed publications on wheelchair use can be found in the scientific literature (13). No French national data has been available until now. In 1991, the number of wheelchair users in France was estimated (extrapolating from regional surveys) at between 105,000 and 160,000 (14). The global transport survey for the Paris region in 1991–92 showed a regional prevalence for wheelchair users in ordinary homes of 18 per 10,000 inhabitants (15). It would be easier to estimate the number of new wheelchairs acquired by using data on prescriptions, social security reimbursements and sales, but such data are not available in France. However, in 2001 the market for manufacturers of vehicles for physically disabled people (of which the wheelchair is the main representative) showed a regular progression of sales over the 5 preceding years (+ 8%) (16), which would seem to suggest an upward trend similar to those found in the above-mentioned countries. The first objective of our study is thus to determine the prevalence of wheelchair use in France.
We then turn to the question of the demographics of wheelchair users. One might suppose that young men with paraplegia following an accident are the typical wheelchair user, but with major demographic changes leading to an ageing population (17), combined with increasing dependence (18), we can hypothesize that the dependent elderly are the most frequent candidates for wheelchair use. Moreover, they often move from their own homes to live in institutions, which raises the hypothesis that a large proportion of wheelchair users live in institutions. Yet most international studies are limited to the population living outside institutions (8–10, 19–21), with some of them excluding lower age categories (6, 13). The second objective of our study is thus to verify these a priori hypotheses and to identify the main characteristics of wheelchair users, whatever their age, and whether they live at home or in institutions.
Finally, as mentioned above, we have seen an increase in the prevalence of wheelchair use in countries such as Canada, the USA and UK. The various arguments put forward to explain this increase include demographic changes and an increase in disabilities, changes in medical and prescription practices, people in institutions acquiring their own wheelchairs, changes in attitudes towards disabled persons, and, more generally, the way disability is perceived (22).
We can hypothesize that over the last 50 years France has followed the same trend, with a major increase in prevalence of wheelchair users. It is not possible to confirm this, due to the lack of prior references, but we will use our data to identify some factors that determine wheelchair use.
In order to quantify and characterize the population of wheelchair users and explain the reasons for wheelchair use, we use data from the Handicaps-Incapacités-Dépendance surveys (HID), which are national surveys within the general population representative of persons of all ages, living at home or in institutions.
The aim of this study is therefore to make up for the lack of French data by examining a series of questions: (i) What is the national prevalence of manual and/or powered wheelchair users living at home or in institutions in France? (ii) Who are the users? (iii) Can we identify the factors determining wheelchair use?
METHODS
Study design
The HID surveys are surveys of handicap, disability and dependency in the general French population, conducted by the French national institute for statistics and economic studies (INSEE).
The surveys were carried out in 1998 among approximately 15,000 people living in institutions and approximately 17,000 people living at home. The questions were asked using the Computer Assisted Personal Interview method (CAPI). The data gathered were declarative.
For the HID-Institutions 1998 survey, institutions were randomly selected after stratification in the survey database made up from the national directory of health and social establishments, which is kept up-to-date by the French ministry of health. The establishments included were those for disabled children, disabled adults and elderly people, and psychiatric establishments in which persons spend the night. The random selection of establishments in each stratum was performed with unequal probability proportional to the capacity (number of beds) in each establishment. In a second phase, each interviewer randomly selected 8 residents from each of the chosen establishments. This second phase leads to selection probabilities directly inverse to those of the first selection, which leads to an equiprobable selection of individuals. Only 155 (7.5%) of the 2075 establishments in the sample refused to take part in the survey and 14,587 of the 15,403 (94.9%) randomly chosen residents answered the questionnaire on their own or with the help of a third party.
The sample for the HID-Homes 1999 survey was selected in 2 stages and the survey was carried out in 2 phases, in line with UN-Stat recommendations (23). The first stage involved filtering with a questionnaire on everyday life and health (Vie quotidienne et santé: VQS) which was completed by 359,000 people living at home at the time of the March 1999 French national census, in a representative sample of the census zones (14% failure due to refusals and unusable response sheets). In the second stage, a random sample of persons from among the people who had answered VQS was selected by strata, with over-representation of the most severely disabled people. In total, 16,945 persons answered the questionnaire, out of the 21,760 who were randomly selected. At this stage, the overall level of failure (refusal, unreachable homes) was 20.5%. Details of the methods used in the HID surveys have been published (24, 25) and all of the questionnaires are available from: http://ifr-handicap.inserm.fr/voirhid.html.
The HID surveys are a rich source of information, as they are based on a population that represents all age groups and all types of disability, with questions that conform with the International Classification of Impairments, Disabilities and Handicaps (26), both at home and in institutions. The investigation had received a favourable opinion from the “Commission Nationale de l’Informatique et des Libertés”.
Data collection
The population studied in this article is made up of people who stated that they use a manual and/or powered wheelchair to move around.
The wheelchair users were characterized in line with various sociodemographic variables, their level of functional dependence and the accessibility of their environment.
For people living at home, the social milieu was examined on the basis of the socioprofessional category of the person of reference at home or in the institution, the socioprofessional category of the person him/herself, that of the partner or former partner if the person in question was not employed, that of the father (or responsible adult) where children were concerned, and profession at time of retirement for the retired.
An indicator reflecting the accessibility of the environment was built from declarative data on confinement and the exposure to obstacles, such as the difficulty of negotiating entry into the building, unsuitable stairs, impracticable flat entranceways/paths (where sandy/muddy for example), unsuitable lift, lack of reserved parking space, etc. Three categories were thus noted:
• persons confined to their bedroom, home or an institution;
• persons living at home and encountering environmental obstacles to their access to their home or building from the street, or to their apartment/room from the building entrance; persons living in an institution and encountering obstacles that make it difficult for them, on their own, to access the institution building from the street or car park, or to get from the building's door or entrance hall to their room;
• persons neither confined nor encountering obstacles.
The functional dependence indicator was created using the elementary "activities of daily living" selected by Katz (27). It assessed an individual's dependence when carrying out 6 everyday activities: (i) washing, (ii) getting dressed, (iii) going to and using the toilet, (iv) getting into or out of bed and sitting down or getting out of a seat, (v) controlling bowel and bladder, (vi) eating prepared food (cooked and chopped up). The variable is coded from 1 to 7 depending on the number of everyday activities for which the individual is dependent: 1: independent for all 6 activities, 2: dependent for 1 activity, 3: dependent for 2 activities, etc. through to: 6: dependent for 5 activities, 7: dependent for all 6 activities.
Statistical analysis
An initial descriptive phase was used to gain a clearer understanding of the characteristics of wheelchair users; a second analytical phase then attempted to identify the proper effects of individual, social and environmental factors on the use of wheelchairs in both homes and institutions. The files were processed with SAS software, version 9.1. Comparisons of means and percentages were made using standard tests (Student’s t-test, χ2). The multivariate analysis was performed using a logistic regression procedure. The degree of significance of these tests was calculated for an alpha risk of 0.05.
Subjects were selected using multistage randomization, as described above. Different sampling rates were applied in each stratum with unequal probabilities of drawing. Each selected subject was thus allocated a specific sampling coefficient, which allowed the data to be weighted in descriptive analyses to estimate representative results at a national level in relation to the general population, and to the sub-populations living at home and in institutions. On the other hand, the logistic regression procedure was used on the raw data, as the data came from 2 separate surveys, each with its own complex sampling design.
Results
National prevalence of wheelchair use in France
The HID surveys contain 393 persons using wheelchairs at home, and 2902 users in institutions. After weighting, the estimated prevalence of wheelchair use in France is 62 persons per 10,000 inhabitants, i.e. 360,000 manual and/or powered wheelchair users living at home or in institutions (Table I).
| Table I. Estimate of frequencies and prevalence of wheelchair use in France, living at home and in institutions, by age and sex |
| | Home | Institution | Total |
| n | Estimated populationa | n | Estimated populationa | Estimated population |
| Gross number | Estimated frequency | Prevalence (/10,000 inhabitants)b | Gross number | Estimated frequency | Prevalence (/10,000 inhabitants)b | Estimated frequency | Prevalence (/10,000 inhabitants)c |
| 0–18 years old |
| Boys | 27 | 14,000 | 20 | (11– 28) | 192 | 2,000 | 3 | (2.5–3.4) | 16,000 | 22 | (14–31) |
| Girls | 11 | 5,000 | 7 | (3–12) | 138 | 1,500 | 2 | (2.0–2.9) | 6,500 | 10 | (5–15) |
| Total | 38 | 19,000 | 14 | (9–19) | 330 | 3,500 | 3 | (2.4–3.0) | 22,500 | 16 | (11–21) |
| 18–65 years old |
| Men | 92 | 35,000 | 20 | (15–25) | 392 | 9,000 | 6 | (4.8–6.1) | 44,000 | 26 | (20–31) |
| Women | 81 | 29,000 | 16 | (12–20) | 327 | 8,000 | 4 | (3.8–4.9) | 37,000 | 20 | (16–25) |
| Total | 173 | 64,000 | 18 | (15–21) | 719 | 17,000 | 5 | (4.5–5.3) | 81,000 | 23 | (19–26) |
| 65 years old and over |
| Men | 63 | 41,000 | 111 | (76–140) | 407 | 30,000 | 78 | (71–84) | 71,000 | 186 | (149–220) |
| Women | 119 | 82,000 | 157 | (115–179) | 1,446 | 105,000 | 188 | (180–196) | 187,000 | 335 | (296–373) |
| Total | 182 | 123,000 | 131 | (108–154) | 1,853 | 135,000 | 143 | (138–149) | 258,000 | 274 | (247–301) |
| All ages |
| Men | 182 | 90,000 | 32 | (26–38) | 991 | 41,000 | 15 | (14–16) | 131,000 | 46 | (40–52) |
| Women | 211 | 116,000 | 39 | (31–45) | 1,911 | 115,000 | 38 | (37–40) | 231,000 | 77 | (69–84) |
| Total | 393 | 206,000 | 35 | (31–40) | 2,902 | 155,500 | 27 | (26–28) | 361,500 | 62 | (57–67) |
| aFrequency estimated after weighting the gross number. bPrevalence at home and in institutions in relation to the general population and 95% confidence interval. cOverall prevalence in France in relation to the general population and confidence interval Source: Handicaps - Incapacités - Dépendance surveys: Institutions 1998 and Homes 1999. |
Fifty-seven percent of the wheelchair users live in private households; 43% live in institutions. Almost a quarter of the persons in institutions use a wheelchair, as against 36 people per 10,000 living at home.
In France, 59 persons per 10,000 inhabitants use a manual wheelchair and 5.4 persons per 10,000 use a powered wheelchair.
Place of residence
Sixty-nine percent of wheelchair users living at home live in detached houses, with the remaining 31% living in flats. Where they live does not differ significantly from non-users who live at home (p = 0.43).
On the other hand, users living in institutions do not live in the same institutions as other institutionalized persons (p < 0.001). Wheelchair users more frequently live in institu tions for elderly people that have medical treatment units, and in long-term treatment units in hospitals, 32% and 22% respectively (vs 18% and 7%), and less frequently in psychiatric institutions, and in institutions for disabled children or adults (Table II).
| Table II. Type of establishment of residence for wheelchair users living in institutions |
| | WCUa | Non-WCU % | χ2 p |
| Frequency | % |
| Institutions for children and teenagers | 4,600 | 3 | 9 | *** |
| Institutions for adults (excluding psychiatric) | 11,800 | 8 | 15 | |
| Institutions for elderly people, with the person being in a medical treatment unit | 49,600 | 32 | 18 | |
| Institutions for elderly people without medical treatment unit | 53,500 | 34 | 42 | |
| Long-term care units in hospitals | 33,700 | 22 | 7 | |
| Psychiatric establishments | 2,300 | 1 | 9 | |
| Total | 155,500 | 100 | 100 | |
| ***p < 0.001. aWCU: Wheelchair user: manual and/or powered wheelchair user. Source: Handicaps - Incapacités - Dépendance surveys: Institutions 1998. |
Sociodemographic characteristics
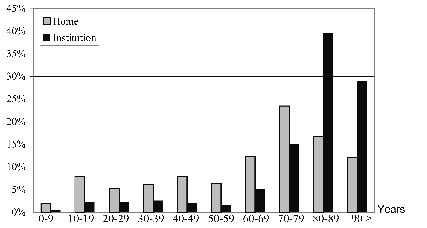
Effect of age. With an mean age of 70 years, the population of wheelchair users is significantly older than the rest of the population (p < 0.001). The mean age of users is 63 years for those living at home (as against 38 years for non-users) and 79 years for those in institutions (vs 67 years for non-users). At home, approximately one-quarter of users are in their 70s (Fig. 1) and 70% of users living in institutions are over 80 years of age.
Fig. 1. Distribution of wheelchair users by age, at home and in institutions.
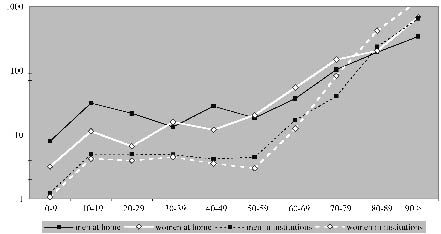
The prevalence of wheelchair users increases almost exponentially with age, both at home and in institutions. As Fig. 2 shows, represented using a logarithmic scale, this increase is more noticeable after the age of 50 years, prevalence at younger ages being relatively stable. Whilst the prevalence of users in relation to the general population is generally higher at home than in institutions, this tendency is reversed after the age of 80 years for both men and women (Fig. 2). Thus, at older ages, more users live in institutions than at home.
Fig. 2. Prevalence of wheelchair use in relation to the general population, by age and sex, at home and in institutions (per 10,000 inhabitants, logarithmic scale).
Effect of sex. With the proportion of men and women being 36% and 64%, respectively, there are significantly more women than men using wheelchairs in France (p < 0.001). This difference is more accentuated in institutions (74% women) than at home (56%). However, this is not true of all age groups (Table I). There are more male than female wheelchair users among people under the age of 65 years, this difference being significant in institutions (p < 0.05) but not at home (p = 0.35). But as from the age of 50 years at home and 70 years in institutions, the prevalence of wheelchair use is higher among women than men (Fig. 2). Among the 187,000 women over 65 years of age using a wheelchair, 105,000 live in institutions (Table I).
Social milieu. The most represented social milieus among the population of wheelchair users, both at home and in institutions, are manual workers and clerks, followed by farmers and skilled workers in institutions, intermediate professions and executives at home (Table III). This distribution is similar to that found in the original population, be it at home or in institutions. There is no significant difference at home between wheelchair users and the rest of the population (p = 0.41), whereas this difference is significant in institutions (p < 0.001), institutionalized users tending more often to be farmers or craftspeople, and less often manual workers or unemployed, than the rest of the institutionalized persons.
However there are differences between age categories. Whilst institutionalized users over the age of 65 years are mostly from a working class milieu, and are more often than not craftspeople and farmers than the other people over 65 years of age, the vast majority of users between 18 and 64 years of age are unemployed (65 % vs 40% of the remaining individuals between 18 and 64 years of age living in institutions).
Marital status. Over a quarter of wheelchair users living at home and almost two-thirds of those living in institutions are widows/widowers (Table III). Almost one-quarter of wheelchair users are single, yet the relative majority of users living at home (41%) are married. The marital status of wheelchair users living at home is statistically different from that of other individuals living at home (p <0.001), the users more often than not being widows/widowers (27% vs 6%). Users are in a different situation in institutions too (p < 0.001); they are more frequently widows/widowers (62% vs 41%), but are also less frequently single (22% vs 43%) than non-users.
| Table III. Characteristics of wheelchair users compared with non-users at home and in institutions |
| | Home | | Institution | |
| WCUa | | Non-WCU % | χ2 p | WCUa | | Non-WCU % | χ2 p |
| Frequency | % | Frequency | % |
| Social milieu | | | *** |
| | Farmers | 18,175 | 9 | 5 | NS | 17,554 | 13 | 8 | |
| | Craftspeople, shopkeepers and company managers | 18,046 | 9 | 9 | | 16,606 | 12 | 8 | |
| | Executives and intellectual professions | 19,085 | 10 | 14 | | 6,087 | 4 | 4 | |
| | Intermediate professions | 33,114 | 17 | 20 | | 11,752 | 9 | 9 | |
| | Clerks | 35,618 | 18 | 18 | | 25,115 | 18 | 17 | |
| | Manual workers | 68,348 | 34 | 32 | | 42,430 | 31 | 38 | |
| | Other persons without jobs | 6,391 | 3 | 1 | | 16,748 | 12 | 18 | |
| Marital status | *** | | | | *** |
| | Under 15 years | 10,451 | 5 | 19 | | 2,291 | 1 | 5 | |
| | Single | 48,484 | 24 | 26 | | 33,447 | 22 | 43 | |
| | Married | 83,683 | 41 | 44 | | 15,830 | 10 | 7 | |
| | Widow(er) | 54,655 | 27 | 6 | | 95,628 | 62 | 41 | |
| | Divorced or separated | 8,064 | 4 | 5 | | 8,013 | 5 | 5 | |
| Mobility – environment | *** | | | | *** |
| | Confined to room or to inside of residence/institution | 93,020 | 45 | 0.9 | | 108,671 | 70 | 36 | |
| | Environmental obstacles | 21,205 | 10 | 0.6 | | 5,720 | 4 | 2 | |
| | No environmental obstacles | 91,112 | 44 | 98.6 | | 41,350 | 27 | 63 | |
| Limited activity (Katz’s ADL) | *** | | | | *** |
| A | Independent for all 6 activities | 32,112 | 16 | 97.4 | | 11,603 | 7 | 58 | |
| B | Dependent for just 1 of the 6 activities | 16,126 | 8 | 1.8 | | 8,175 | 5 | 11 | |
| C | Dependent for 2 activities, including the first | 17,591 | 9 | 0.4 | | 6,108 | 4 | 7 | |
| D | Dependent for 3 activities, including the first 2 | 23,531 | 12 | 0.2 | | 7,118 | 5 | 4 | |
| E | Dependent for 4 activities, including the first 3 | 29,070 | 14 | 0.1 | | 18,480 | 12 | 4 | |
| F | Dependent for 5 activities, including the first 4 | 40,141 | 20 | 0.1 | | 44,604 | 29 | 5 | |
| G | Dependent for all 6 activities | 31,442 | 15 | 0.0 | | 31,424 | 20 | 4 | |
| H | Dependent for at least 2 activities, without being possible to classify under C, D, E or F | 14,487 | 7 | 0.1 | | 28,147 | 18 | 7 | |
| ***p < 0.001. aWCU: manual and/or powered wheelchair user, frequencies and % estimated after weighting. ADL: activities of daily living; NS: not significant. Source: Handicaps - Incapacités - Dépendance surveys: Institutions 1998 and Homes 1999. |
This overall situation hides important differences in the distribution according to matrimonial status in terms of age. In institutions, the majority (77%) of wheelchair users between the age of 18 and 64 years are single, just like other residents of the same age (85%). On the other hand, we find more frequent widowhood among the over-65s (70% for users as against 61% for non-users).
Users under the age of 15 years and users who are married, live more often at home, whereas widows/widowers are more frequently found in institutions.
Mobility – environment
Wheelchair users are more frequently confined to their room or to the inside of their place of residence or institution than the rest of the population (p < 0.001). Confined users represent 45% of users at home and 70% of those in institutions (Table III). This situation is not linked solely to the user’s ability to move around. At home, 4% of users are confined to their room, 25% to their place of residence without being able to move unaided and 16% are confined to their place of residence but can move around inside without help. In institutions, 14% of wheelchair users are confined to their room, 44% are confined to the institution without being able to move around on the same floor without help and 12%, whilst being confined to the institution, can move around unaided.
Confinement is not the same at all ages. At home it concerns 64% of users over the age of 65 years, 20% of users between 18 and 64 years of age, and 6% of users under 18 years of age.
The majority of users who have difficulty gaining access to their place of residence or institution from outside or to their room or flat from the building’s entrance and who have difficulty moving around within the institution declare that this is due to their state of health. But 10% of all home users and 4% of users in institutions also declare the existence of environmental obstacles. This declaration is significantly more frequent among wheelchair users than among non-users (p < 0.001). The obstacle most frequently mentioned is that of getting through the door.
Extent of limitations to activity
The vast majority of manual and/or powered wheelchair users stated they had “come across difficulties in everyday life, be they physical, sensory, intellectual or mental” (99% at home and 99% in institutions).
The severity of the limitations to activity encountered was assessed using the level of dependence on Katz’s activities of daily living. Wheelchair users declare more serious limitations than non-users, both at home and in institutions (p < 0.001) and are generally more dependent. Yet 16% of wheelchair users living at home are independent with regard to day-to-day activities (Table III). In institutions, the majority of users are dependent for more than 4 activities.
Reported impairments
All wheelchair users declared at least one impairment. Overall, they declared more impairments than non-users; an average of 2.7 impairments at home compared with 0.7 for non-users (p < 0.001). In institutions there was less difference, with users declaring 3.0 impairments as opposed to 2.3 for non-users.
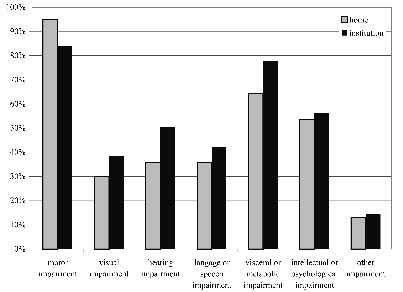
The most frequently mentioned impairments were: motor impairments (95% of home users and 84% in institutions), visceral or metabolic impairments (65% and 78%) and intellectual or mental impairments (54% and 56%) (Fig. 3).
Fig. 3. Impairments declared by wheelchair users at home and in institutions. Proportion of wheelchair users declaring at least one impairment in each category, each individual having possibly declared several of the same type.
A classification made by associating the main types of impairment (motor, intellectual or mental, physical (visceral or metabolic, visual or auditory)) allowed us to divide individuals into groups, depending on whether they had declared a single impairment type (mono-impairment) or a combination of several types (multi-impairments). Each person was thus classified in the exclusive group of impairments that corresponded to the impairments that he/she had declared. The vast majority of users declared several types of impairment (Fig. 3). More than 50% of home users and 46% of those in institutions declared one or more motor impairments along with at least one intellectual or mental impairment. Then came the association of one motor impairment with one physical impairment, for 31% of users at home and in institutions. For home users, it was exclusive motor impairments that came third, whilst for those in institutions, it was the combination of physical and intellectual or mental impairments (10% of users).
Proper effect of each of these variables
In order better to understand the relationships between these individual, social and environmental factors, and the use of wheelchairs, we used a logistic regression procedure to distinguish variables with a proper effect from possible confounding factors (Table IV). We integrated into the model sex, age, a health variable (number of impairments), 2 social variables (marital status and social milieu), a social participation variable (mobility – environment), a score for the severity of limitations to activity, and the place of residence (at home or in an institution).
| Table IV. Factors related to the use of a manual and/or powered wheelchair in France (logistic regression) |
| | | Odds ratio | 95% CI | p |
| Sex | | | |
| | Male | 1.1 | 0.98–1.21 | NS |
| | Female (ref.) | 1.0 | | |
| Age | 0.995 | 0.992–0.999 | ** |
| Number of impairments | 1.1 | 1.11–1.18 | *** |
| Marital status | | | |
| | Under 15 years | 0.8 | 0.6–1.1 | NS |
| | Single | 0.9 | 0.7–1.0 | NS |
| | Married (ref.) | 1.0 | | |
| | Widow/er | 1.3 | 1.1–1.5 | ** |
| | Divorced or separated | 1.2 | 0.9–1.5 | NS |
| Social milieu | | | |
| | Farmers | 1.0 | 0.8–1.2 | NS |
| | Craftspeople, shopkeepers and company managers | 1.2 | 0.9–1.4 | NS |
| | Executives and intellectual professions | 1.0 | 0.7–1.2 | NS |
| | Intermediate professions | 1.0 | 0.8–1.3 | NS |
| | Clerks (ref.) | 1.0 | | |
| | Manual workers | 0.8 | 0.7–0.9 | * |
| | Other persons without jobs | 1.0 | 0.8–1.3 | NS |
| Mobility – environment | | | |
| | Confined | 1.3 | 1.2–1.5 | *** |
| | Environmental obstacles | 4.0 | 3.2–5.0 | *** |
| | No obstacles (ref.) | 1.0 | | |
| Score for severity of limitations to activitya | 2.02 | 1.97–2.07 | *** |
| Place of residence | | | |
| | Institution | 3.8 | 3.3–4.5 | *** |
| | Home | 1.0 | | |
| *p < 0.05, **p < 0.01, ***p < 0.001. Handicaps - Incapacités - Dépendance surveys: Institutions 1998 and Homes 1999. ref.: reference class for each variable in the logistic regression model. 95% CI: confidence interval at 95% of the odds ratio (OR); bold OR significantly different from 1; NS: not significant. aScore calculated using Katz’s ADL recoded from 1 to 7 for Katz’s A–G, Katz’s H being coded as 3. |
After adjustment for all of the variables used, the effect of sex disappears and the use of a wheelchair tends to diminish with age (odds ratio (OR) = 0.995, p < 0.01). For each additional declared impairment, the risk of becoming a wheelchair user increases by 1.1 (p < 0.001). Each additional declared dependence relating to an everyday activity doubles the risk of using a wheelchair (OR = 2.02, p < 0.001). All other things being equal, when compared with married persons, only widowed status is significantly related to wheelchair use (OR = 1.3, p < 0.01). Except for a negative link between wheelchair use and the fact of being a manual worker or of coming from this social class (vs clerks) wheelchair use would appear to have few links with social milieu. The fact of being confined to one’s room or one’s place of residence remains related to the fact of being a wheelchair user once the degree of dependence is taken into account (OR = 1.3, p < 0.001). Regarding those who are not confined, the fact of declaring environmental barriers to movement is strongly related to wheelchair use (OR = 4.0, p < 0.001). Once age, the number of impairments and the degree of dependence are taken into account, wheelchair use is very much greater (OR = 3.8, p < 0.001) for people living in an institution than for people living at home.
Discussion
The HID surveys are the first to have provided national data on the use of assistive devices in France, and on wheelchair use in particular. These surveys show that the population of manual and/or powered wheelchair users in France can be estimated at 62 persons for 10,000 inhabitants. The prevalence of wheelchair users is thus lower in France than in other western countries such as UK (12) (3 times as many users), Canada (6) (1.5 times as many users among people 12 years old and older living at home) and the USA (7) (twice as many home users). This more limited use in France might be due to various factors, such as a less adapted environment, a historical delay in developing wheelchair use, and stronger negative social representations of the wheelchair leading to resistance from potential users and lower levels of prescription by healthcare professionals. Further studies will be needed to more accurately assess the impact of these different factors.
Yet when one examines previous estimates (14, 15) one can see that even though the prevalence of wheelchair use in France may be lower than in other countries, it is increasing strongly, and this change is part of a general phenomenon that has been documented in several developed countries.
The HID surveys have also allowed us to examine wheelchair users in their various places of living, and to highlight some unexpected results. Wheelchair users live both at home and in institutions. Yet the various national surveys of the so-called “general population” are often representative only of people living at home. The almost even distribution observed in this study shows the importance of taking the institutionalized population into account in studies on wheelchair users, something which has only rarely been done in previous studies that already showed the significant size of the institutionalized population (5). Wheelchair users living in institutions represent almost 25% of the total institutionalized population in France, with this figure increasing to 49% of residents in healthcare centres in Canada, according to the national survey on the population’s health (6). But most striking of all is the strong link between life in institutions and the use of wheelchairs (OR = 3.8), this remaining true after adjustment for age, sex, number of impairments, limitations to activity and mobility. We can attribute this difference to the conjunction of several factors: an environment which is generally more accessible in institutions, carers’ work organization being facilitated by wheelchair use, and a greater propensity for medical prescription. However, we cannot rule out a reverse causality resulting from the more frequent institutionalization of wheelchair users.
The population of wheelchair users is made up of a minority of young people, mainly males living at home, and, as one might expect, a majority of institutionalized dependent elderly females. Yet dependency levels and number of impairments being equal, this expectation disappears. Indeed, all things being equal, the probability of using a wheelchair does not vary with one’s sex, and unlike the number of users, decreases with age. A similar effect was seen with the self-attribution of disability, the increase with age being reversed once sex, aid, functional limitations and restrictions to activity were taken into account (25). This reduction in the risk of using a wheelchair as one grows older was also seen in Canada among the over-65’s (13). There are various hypotheses to explain this unexpected effect of age, such as elderly people more frequently having recourse to human aid as a replacement for assistive devices, younger people with the same impairments and health being quicker to use wheelchairs, or the restricted access to wheelchairs for elderly people, which might be explained by a social normalization of dependence at older ages.
The fact that there is no difference in sex for wheelchair use does not confirm the results that were expected on the basis of previous studies in France, which showed that men more frequently use assistive devices (28).
Wheelchair users show a health status characterized by a declaration of multi-impairments and multiple disabilities at an unexpected level. The high proportion of institutionalization in medically oriented establishments reinforces this impression of the severity of limitations to activity and of the high dependence of users. These results are in line with international data; the number of wheelchair users living at home in Canada declaring that they need help for everyday activities stands at 67% for men and 74% for women (6).
But the most striking results of this survey are the very high proportion of wheelchair users confined to their place of residence or institution, or even to their room, and the high proportion of institutionalized users. This very strong link between wheelchair use and institutionalization persists even after other factors (individual, social, environmental) are taken into account.
It is difficult but essential to understand the influence of social variables in the process of wheelchair use. We chose to characterize social milieu via socioprofessional category. This variable is generally considered to be a good summary of social situation, integrating its economic (income) and cultural (level of education) components. Unfortunately it is not used in the same way in each of the 2 surveys. Not being able directly to examine social isolation and the social relationship of the interviewees, we opted for the marital status approach for proxy. Social variables would appear to have a lesser effect on wheelchair use than was expected. Regarding social situation, only persons of working class origin demonstrate lesser wheelchair use, especially in institutions. This observation may be explained by the economic difficulties in acquiring a wheelchair, or by cultural resistance to its use. Furthermore, with the working-class milieu being particularly exposed to institutionalization (29), the working-class population is over-represented in institutions. So we cannot exclude the possibility that social disparities in wheelchair use interfere with social disparities concerning institutionalization. The HID surveys do not allow us to differentiate between standard wheelchairs and tailor-made wheelchairs, yet available literature reports strong social disparities in this spread (30). The fact that there are few disparities related to social milieu in our analysis would make it worthy of further study, taking the quality of assistive devices into account. Also, with regard to marital status, widowhood goes hand in hand with increased wheelchair use, which might be interpreted as being an alternative technique to replace natural helpers. The link between widowhood and life in institutions already being known (31, 32), the difficulty in a wheelchair user living alone at home may be one explanation for the high number of users living in institutions.
There are several limits to our work. Data from the HID surveys are declarative and we cannot exclude classic declaration biases, especially those related to age. The impossibility of examining the permanent or temporary use of wheelchairs is one of the weaknesses of this material. In the same way, we lack independent environmental data on perceived obstacles, which would enable us to examine not only difficulties of use but also non-use among persons with impairments of the same type and with the same level of dependence who do not use a wheelchair due to the poor accessibility of the environment. The high rate of user confinement, both at home and in institutions, needs to be examined from this angle. This variable relating to mobility is not just a way of looking at one facet of people’s social participation, but also a reflection of environmental obstacles. Indeed, being confined to one’s room is not the only “natural” consequence of severe disabilities, it is also, and above all, the result of a situation that combines architectural obstacles and resources in terms of available human aid. To achieve a more detailed analysis of the factors relating to wheelchair use, it would also be interesting to compare the population of wheelchair users with users of other types of assistive mobility devices, such as walking sticks or crutches, in order to determine what relates to the general use of assistive devices, and what relates more specifically to wheelchairs.
This work opens up numerous perspectives for further in-depth analysis. There would appear to be age-related specificities among the user population that deserve more specific works on the dependent elderly, and on young users whose characteristics are camouflaged in this survey by the number of elderly persons. These French results also offer interesting perspectives for international comparison. The results reveal determining factors of wheelchair use, and some of these will be the same as in other countries, and will thus be generalizable. On the other hand, the unexpected difference that was found in the prevalence between France and other countries might reflect differences in characteristics between French users and their counterparts – cultural specificities which need to be identified.
In conclusion, the HID surveys have provided the first opportunity to study wheelchair use in France among a representative national population covering all age groups and all places of residence. The number of manual and/or powered wheelchair users in France is currently estimated at 360,000. These users live both in ordinary homes and in institutions. At 62 per 10,000 inhabitants, the prevalence of wheelchair use is considerably lower than in other countries. Elderly women represent the largest category of users, but the probability of using a wheelchair would appear to diminish slightly with age once the number of impairments and disabilities is taken into account. Users are characterized by multiple impairments that are not just motor, but also intellectual, mental and organic, along with severe limitations to activity. One of the most striking results is that of the frequency of confinement to a place of residence or institution. All else being equal, the factors most closely linked to wheelchair use are the confrontation with environmental obstacles and the fact of living in institutions.
The rapid increase in the prevalence of wheelchair use seems to be true of most western countries. This increase and the place taken by wheelchair use in our modern societies deserves close attention from urbanists, architects and transport companies. It invites a major social transformation to make way for wheelchair users.
Acknowledgements
This national community-based survey was conducted by the National Institute of Statistics and Economic Studies (INSEE) with funds from the Ministry of Employment and Solidarity, National Social Security, mutual insurance organizations, insurance companies and disability associations.
The study design was the result of intense co-operation between INSEE and leading research institutes in the field, including INSERM and particularly the “Federative Research Institute on Disability” (IFR25).
The authors would like to thank the INSEE division “Enquêtes et études démographiques” and especially Pierre Mormiche, responsible for the “Handicaps, Incapacités, Dépendance” (HID) project task force.
Funding source: this study is part of the SACR-FRM project supported by a grant from ANR-TecSan2006, whose principal investigator is François-Xavier Lepoutre. The socio-epidemiologic part of SACR-FRM is directed by Isabelle Ville with the participation of Myriam Winance and Jean-François Ravaud.
Finally, the authors wish to thank Chris Hinton for his assistance in translation.
References
1. Kamenetz HL. A brief history of the wheelchair. J Hist Med Allied Sci 1969; 24: 205–210.
2. Woods B, Watson N. Wheelchair, history of. In: Albrecht G, editor. Encyclopedia of disability. Thousand Oaks, CA: Sage Publications; 2006, p. 1632–1634.
3. Tremblay M. Going back to Givy Street: a historical account of the impact of the Everest and Jennings wheelchair for Canadian World War II veterans with spinal cord injury. Disabil Soc 1996; 11: 149–169.
4. Tremblay M, Campbell A, Hudson G. When elevator were for pianos: an oral history account of the civilian experience of using wheelchairs in Canadian society. The first twenty-five years: 1945–1970. Disabil Soc 2005; 20: 103–116.
5. Torrance G. Current use of, and future demand for rehabilitation technology in Canada (NRC contract no 989-3819P). Ottawa (Canada): National Research Council of Canada; 1990.
6. Shields M. Fauteuils roulants et autres appareils d’aide à la mobilité. In: Rapports sur la santé: Statistique Canada. 2004; 15: 41–46.
7. Steinmetz E. Americans with disabilities: 2002. In: US Census Bureau Current Population Report 2002. p. 70–107.
8. Kaye H, Kang T, LaPlante M. Mobility device use in the United States. Washington, DC: US Department of Education, National Institute on Disability and Rehabilitation Research; 2000.
9. Russel J, Hendershot G, LeClere F, Howie L, Adler M. Trends and differential use of assistive technology devices: United States, 1994. Advance Data from Vital Health Stat, National Center for Health Statistics 1997; 292, p. 1–9.
10. Martin J, White A, Meltzer H. Disabled adults: services, transport and employment. London: HMSO; 1989.
11. Aldersea P. National prosthetic and wheelchair services report 1993–1996. London: College of Occupational Therapy; 1996.
12. Sedgwick M, Frank A, Kemp P, Gage P. Improving services for wheelchair users and carers. Good practice guide: learning from the Wheelchair Services Collaborative. London: NHS, Department of Health; 2005.
13. Clarke P, Colantino A. Wheelchair use among community-dwelling older adults: prevalence and risk factor in a national sample. Can J Aging 2005; 24: 191–198.
14. André J-M, Rouyer A, De Barmon H, Paysant J, Brugerolle B. Les fauteuils roulants en France, approche épidémiologique et données chiffrées. In: Pelissier J, Jacquot J, Bernard P, editors. Le fauteuil roulant. Paris: Masson; 1997, p. 8–16.
15. Ravaud J-F, Velche D, Hauet E. Pratique des déplacements et prévalence des handicaps en situation de transport: l’apport de l’enquête globale 1991–1992 sur le déplacement des habitants de la région Ile de France. Cah Socio Démo Méd 1994; 34: 31–52.
16. Lecomte D, De Penanster, D. Aides techniques: situation actuelle, données économiques, proposition de classification et de prise en charge. Paris: Rapport au Ministre de la santé, de la famille et des personnes handicapées; 2003.
17. Courson J, Madinier C. Recensement de la population 1999: La France continue de vieillir. Insee Première 2000; 746: 1–4.
18. Désesquelles A. La dépendance des personnes âgées: Synthèse et perspectives: Rapport pour le Haut Conseil de la population et de la famille; 1999.
19. NHS. Moving forward: review of NHS Wheelchair and Seating Services in Scotland. Edinburgh: NHS; 2006.
20. LaPlante M, Hendershot G, Moss A. Assistive technology devices and home accessibility features: Prevalence, payment, need, and trends. Hyattsville, Maryland: National Center for Health Statistics; 1992.
21. Mitchell C. Access to transport systems and services. An international review. Montréal: Transportation Development Centre, Safety and Security, Transport Canada; 1997.
22. Sapey B, Stewart J, Donaldson G. Increases in wheelchair use and perceptions of disablement. Disabil Soc 2005; 20: 489–505.
23. UN-Stat. Manual for the development of statistical information for disability programs and policies. New York: United Nations, statistics division, UN Publications; 1996.
24. Mormiche P. L’enquête HID de l’Insee. Objectifs et schéma organisationnel. Courrier des Statistiques 1998; 87–88: 7–18.
25. Ravaud J-F, Letourmy A, Ville I. Identifying the population with disability: the approach of an INSEE survey on daily life and health. Population-E 2002; 57: 529–552.
26. WHO. International classification of impairments, disabilities and handicaps. Geneva: World Health Organization; 1980.
27. Katz S, Ford A, Moskowitz R, Jackson B, Jaffe M. Studies of illness in the aged. The index of ADL: a standardized measure of biological and psychosocial function. JAMA 1963; 185: 914–919.
28. Ravaud J-F, Ville I. Les disparités de genre dans le repérage et la prise en charge des situations de handicap. Rev Fr Aff Soc 2003; 57: 227–253.
29. Mormiche P. Le handicap se conjugue au pluriel. Insee Première 2000; 742: 1–4.
30. Hunt P, Boninger M, Cooper R, Zafonte R, Fitzerald S, Schmeler M. Demographic and socioeconomic factors associated with disparity in wheelchair customizability among people with traumatic spinal cord injury. Arch Phys Med and Rehabil 2004; 85: 1859–1864.
31. Mormiche P. Les personnes dépendantes en institutions. Insee Première 1999; 669: 1–4.
32. Eenschooten M. Les personnes âgées in institutions en 1998: catégories sociales et revenus. Ministère de l’emploi et de la solidarité, DREES, Etudes et Résultats 2001; 108: 1–8.