OBJECTIVE: The primary aim of this study was to determine the effectiveness and cost-effectiveness of adding manual therapy to a physiotherapy programme for ankle fracture.
DESIGN: Assessor-blinded randomized controlled trial.
PARTICIPANTS: Ninety-four adults were recruited within one week of cast removal for isolated ankle fracture. Inclusion criteria were: they were able to weight-bear as tolerated or partial weight-bear, were referred for physiotherapy, and experienced pain. Ninety-one participants completed the study.
METHODS: Participants were randomly allocated to receive manual therapy (anterior-posterior joint mobilization over the talus) plus a standard physiotherapy programme (experimental), or the standard physiotherapy programme only (control). They were assessed by a blinded assessor at baseline, and at 4, 12 and 24 weeks. The main outcomes were activity limitation and quality of life. Information on costs and healthcare utilization was collected every 4 weeks up to 24 weeks.
RESULTS: There were no clinically worthwhile differences in activity limitation or quality of life between groups at any time-point. There was also no between-group difference in quality-adjusted life-years, but the experimental group incurred higher out-of-pocket costs (mean between-group difference = AU$200, 95% confidence interval 26–432).
CONCLUSION: When provided in addition to a physiotherapy programme, manual therapy did not enhance outcome in adults after ankle fracture.
Key words: ankle injuries, bone fractures, physical therapy (specialty), musculoskeletal manipulations, costs and cost analysis.
J Rehabil Med 2008; 40: 433–439
Correspondence address: A Moseley, Centre for Evidence-Based Physiotherapy , PO Box 170, Lidcombe NSW 1825, Australia. E-mail: amoseley@george.org.au
Submitted September 5, 2007; accepted January 14, 2008
Introduction
Ankle fracture is one of the most common injuries of the lower limb (1, 2). Initial management normally consists of surgical or conservative orthopaedic treatment and a period of immobilization (3–5). This is typically followed by rehabilitation, including a referral to physiotherapy, to address the health consequences of the fracture and the subsequent immobilization (6–9).
Physiotherapy interventions after ankle fracture include advice, progression of mobility, exercise and manual therapy (10, 11). Manual therapy involves the physiotherapist applying gentle passive movements to the joint. It is believed that manual therapy can reduce pain and joint stiffness after injury, thus allowing an earlier return to activity (12). Studies of the mechanisms of manual therapy have shown that manual therapy leads to a rapid hypoalgesic response, which may, in part, be mediated by the noradrenergic descending pain pathways from the periaqueductal grey (13–15).
Evidence of the effectiveness of manual therapy after ankle fracture is limited to anecdotal evidence and the findings of a small pilot study (n = 10) (16), which provided preliminary, but weak, evidence for its effectiveness. Furthermore, the severity of fracture has been found to influence outcome in ankle fracture (17). However, proponents of manual therapy continue to debate whether manual therapy should be provided to all people after ankle fracture, or if it should be selectively administered to those with more severe fractures. There are no data with which this debate can be resolved.
The economic consequences of ankle fracture have been investigated (18, 19). These studies provide limited information on treatment alternatives after ankle fracture due to methodological problems such as non-random treatment allocation (18) and the failure to include a control group (19). There is also a lack of information on the utilization of healthcare resources in the outpatient setting. In addition, although the cost-effectiveness of manual therapy has been compared with other interventions for people with neck pain with promising results (20), the costs and consequences of administering manual therapy after ankle fracture have not been investigated.
The primary aim of this study was to determine the effectiveness and cost-effectiveness of adding manual therapy to a standard physiotherapy programme after cast immobilization for ankle fracture in adults. We hypothesized that manual therapy would enhance outcome of the physiotherapy programme, at least in the short term. A secondary aim was to determine if effects were influenced by fracture severity.
MATERIALS AND METHODS
This study was a multi-centre randomized control trial. Ethics approval was obtained from the participating institutions. A detailed protocol for the study has been published (21).
Participants
Adult participants were recruited from the physiotherapy departments of 3 large teaching hospitals in Sydney, Australia, if they fulfilled the following inclusion criteria: ankle fracture treated with cast immobilization with or without surgical fixation; cast removed in the preceding 7 days; able to weight-bear as tolerated or partial weight-bear; referral to outpatient physiotherapy for treatment; at least 2 out of 10 pain (visual analogue scale (VAS)) (22) in the affected ankle on equal weight-bearing at cast removal; no concurrent and significant pathologies or lower limb injuries; and available for the 24-week follow-up period.
Interventions
After baseline assessment, participants were randomly allocated to the experimental or control groups by their treating physiotherapist using sealed, opaque and consecutively numbered envelopes. The randomization sequence, which was stratified by site in permuted blocks of 4, 6 or 8, was computer-generated a priori by an independent investigator to ensure concealment. In this pragmatic trial, participants in the experimental group attended physiotherapy twice each week to receive manual therapy plus a physiotherapy programme. Participants in the control group attended treatment twice in the first week and once each week thereafter, and received only the physiotherapy programme. The frequency of attendance for both groups was chosen to reflect conventional practice.
The manual therapy treatment consisted of large amplitude (grade III) anterior-posterior glides of the talus (12) applied with the participants in supine or long sitting, the knee in extension and the affected ankle positioned at the end of the available pain-free dorsiflexion range. This technique has been shown significantly to improve ankle dorsiflexion range, the rate of return to physical activities and walking speed following ankle sprain (23). The manual therapy treatment was initially given in 3 sets of 60 sec, but could be progressed by increasing the number of repetitions to 5 sets of 60 sec, by increasing the force of application, and by increasing the range of dorsiflexion in which the treatment was performed. The physiotherapy programme consisted of exercise, gait re-training, progression of walking aids, advice on prognosis and return to activities, and ice, elevation and compression if required. Exercises were chosen from a standardized programme of ankle mobility and strengthening, stepping, and balancing exercises, and were individually prescribed and progressed for each participant to perform daily at home.
The duration of the experimental period was 4 weeks, after which all manual therapy treatment ceased and participants in both groups could progress to exercises other than those from the standardized exercise programme. Participants were discharged from physiotherapy when they returned to their previous level of function, reached a plateau, or chose to discontinue treatment.
Outcome assessment
Outcome assessments were conducted by an assessor blinded to treatment allocation at baseline and at 4, 12 and 24 weeks after randomization. The primary outcomes were activity limitation and quality of life, measured by the Lower Extremity Functional Scale (LEFS) (24) and the Assessment of Quality of Life (AQoL) (25, 26), respectively. The secondary outcome measures were: measures of activity limitation (walking speed, step length asymmetry, stepping rate on stairs), measures of impairments (ankle dorsiflexion range of motion using the weight-bearing lunge method (27), and pain on equal weight-bearing and on stair descent on a 100-mm VAS), measures of participation (return to work and return to sport and leisure activities on a 100-mm VAS), satisfaction with physiotherapy (on a 100-mm VAS), global perceived effect of treatment (on a 11-point scale from –5, “vastly worse”, to +5, “completely recovered”), number of days to pain-free walking, and adverse events. To measure compliance, participants used a diary to record exercises performed. Physiotherapists also recorded the number of visits made by the participants, the number of manual therapy treatments for those in the experimental group, the exercises prescribed for each participant and all other treatments used.
To inform choices made by healthcare providers and patients, the economic evaluation was conducted from the perspectives of the Australian healthcare system and the individual patients. Information about utilization of healthcare resources and participants’ out-of-pocket costs was collected every 4 weeks by survey, administered at the 4-, 12- and 24-week follow-up, and by post or telephone at 8, 16 and 20 weeks. Table I indicates the types and costs of resources, and methods of valuation.
| Table I. Assessment of resource use |
| Resources | Cost (AU$) | Source of valuation |
| Direct healthcare costs |
| Outpatient physiotherapy | 33.92/initial session 16.96/subsequent session | NSW Health award rates (http://www.health.nsw.gov.au/jobs/empcond/classifications.html) |
| Medical specialists | 133.35/initial session 66.75/subsequent session | MBS (http://www9.health.gov.au/mbs/) |
| GP | 32.10/visit | MBS (http://www9.health.gov.au/mbs/) |
| Emergency department | 162.00/visit | NSW Health Costs of Care Standards (http://www.health.nsw.gov.au/policies/gl/2005/GL2005_071.html) |
| Hospitalization | Various | MBS (http://www9.health.gov.au/mbs/) and NSW Health Costs of Care Standards (http://www.health.nsw.gov.au/policies/gl/2005/GL2005_071.html) |
| Investigations | Various | MBS (http://www9.health.gov.au/mbs/) |
| PBS medication | Various | PBS (http://www.pbs.gov.au/html/home) |
| Private health providers | Various | Actual costs as reported by participants |
| Gap costs of visits to medical specialists and GP, investigations and PBS medication | Various | Actual costs as reported by participants |
| Non-PBS medication and other purchases | Various | Actual costs as reported by participants |
| Direct non-healthcare costs |
| Transport (bus/train/taxi fares, tolls, parking) | Various | Actual costs as reported by participants |
| Use of private vehicle | 0.66/km | Kilometres of travel, as reported by participants, multiplied by the rate of a medium-sized vehicle per business kilometre¶ |
| ¶The Australian Taxation Office, http://www.ato.gov.au/ GP: general practitioner; MBS: Medical Benefits Schedule; NSW: New South Wales; PBS: Pharmaceutical Benefits Scheme. |
Sample size
We decided a priori on a sample size of 90 participants. This was sufficient to provide a 90% probability of detecting a difference between group means of 10 points on the LEFS (based on its minimal clinically important change) (24), assuming a standard deviation of 13 (11), a correlation of 0.6 between pre- and post-test measures and an alpha of 0.05, and allowed for 10% drop-outs and 20% non-compliance.
Statistical analysis
Statistical analysis to determine the effectiveness of manual therapy was based on intention-to-treat principles (28). Missing data were replaced by the last known value carried forward or by the means of the allocated group if no data were available. Group allocation was coded to ensure blinding during statistical analysis and interpretation. Separate analyses were performed for each time-point (i.e. 4-, 12- and 24-week follow-up), with the 4-week follow-up (i.e. the follow-up at the end of the experimental period) being the primary time-point for analysis. To test the effects of treatment, between-group differences of continuous data were examined with analysis of covariance using a regression approach. Baseline scores were entered into the model as the only covariate. The emphasis was on estimation, but hypothesis tests were also conducted (alpha = 0.05). Survival analysis was used to estimate between-group differences in days to pain-free walking. Odds ratios were calculated for dichotomous data (adverse events).
To test the influence of fracture severity on treatment effects, additional terms (fracture severity and the group by fracture severity interaction) were entered into the regression model. Fractures were categorized as less severe (unimalleolar fractures) or more severe (bimalleolar or trimalleolar fractures). The effect of fracture severity on treatment was determined by examining the interactions between group of allocation and fracture severity.
For the economic evaluation, missing data were replaced by the last known value carried forward. If no cost data were available, participants were omitted from analysis. To test between-group differences in costs, two-tailed independent samples t-tests were used. We also obtained bias-corrected boot-strapped estimates (1000 replications) of the 95% confidence intervals (95% CI) for between-group differences in mean costs. Between-group differences in utilization were tested using Fisher’s exact test. Costs are reported as undiscounted costs for 2005–06, calculated to the value of the Australian dollar in 2005 (AU$1.00 = US$0.72 = GB£0.45 based on purchasing power parities, www.oecd.org). Discounting is not relevant as recovery from a fractured ankle usually occurs within months rather than over years.
Results
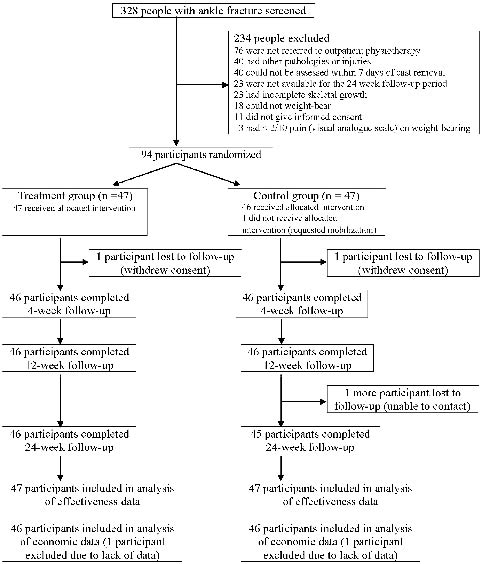
Recruitment and follow-up occurred between November 2004 and January 2007. To ensure allocation was blocked (i.e. that recruitment ceased at the end of a block), 94 participants were recruited (Fig. 1). Three participants (3%) were lost to follow-up. There were no clinically relevant differences between the groups at baseline (Table II).
| Table II. Baseline characteristics and primary outcome measures for the experimental and control groups |
| Characteristics and primary outcome measures | Experimental group (n = 47) | Control group (n = 47) |
| Gender (female/male), n | 26/21 | 17/30 |
| Age (years), mean (SD) | 42.5 (14.3) | 40.8 (15.1) |
| Height (cm), mean (SD) | 171.8 (9.3) | 177.2 (11.6) |
| Weight (kg), mean (SD) | 80.5 (17.8) | 83.8 (15.2) |
| Cause (fall/sports/motor vehicle accident/other), n | 31/8/5/3 | 26/16/2/3 |
| Side of fracture (left/right), n | 15/32 | 26/21 |
| Fracture severity (unimalleolar/bimalleolar or trimalleolar), n | 30/17 | 31/16 |
| Surgery (yes/no), n | 30/17 | 26/21 |
| Length of cast immobilization (days), mean (SD) | 43.0 (7.8) | 43.6 (7.8) |
| Weight-bearing status (PWB/WBAT/FWB), n | 2/39/6 | 2/42/3 |
| Other concurrent lower limb injuries (yes/no)*, n | 15/32 | 11/36 |
| Previous injury/pathology (yes/no), n | 21/26 | 24/23 |
| Sedentary occupation (yes/no), n | 31/16 | 22/25 |
| Sedentary sport/leisure activities (yes/no), n | 41/6 | 40/7 |
| Annual household income ( < AU$52,000/≥ AU$52,000/did not answer), n | 16/24/7 | 13/27/7 |
| Private health insurance (yes/no/did not answer), n | 30/16/1 | 21/25/1 |
| Lower Extremity Functional Scale (/80), mean (SD) | 31.7 (13.2) | 35.5 (11.9) |
| Assessment of Quality of Life (/45), mean (SD) | 9.0 (4.9) | 8.5 (4.7) |
| PWB: partial weight-bearing; WBAT: weight-bearing as tolerated; FWB: full weight-bearing; SD: standard deviation. *Soft tissue injuries only (sprains, lacerations and contusions); people with significant lower limb injuries were excluded from the study. |
Compliance and blinding
Compliance to the protocol by physiotherapists and participants of both groups was excellent during the 4-week experimental period (compliance rate in attendance to physiotherapy and exercise completion = 80–91%). One participant did not receive the treatment allocated (Fig. 1), and this participant was analysed according to the initial group allocation. Participants in the experimental group received, on average, 4 sets of manual therapy per session, and 6 sessions of manual therapy in total.
Fig. 1. Participation in the trial.
The assessor was unblinded for only 3 of the 275 follow-up assessments conducted. The agreement between true group allocation and the assessor’s guesses of group allocation was poor at all time-points (kappa = 0.1–0.4).
Effectiveness of manual therapy
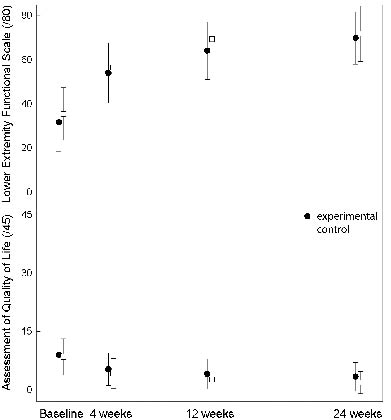
Activity limitation and quality of life improved over time for both groups (Fig. 2). There were no statistically significant between-group differences for either of the primary outcome measures (Table III), except for a difference in the AQoL at 24 weeks, which was small and not clinically significant (mean difference = 1.3, 95% CI = 0.1–2.5). A clinically worthwhile difference in activity limitation was definitively ruled out as the 95% CI on the LEFS did not include our pre-specified mean between-group difference of 10 points at any time-point.
Fig. 2. Means and standard deviations for the primary outcome measures.
For the secondary outcome measures (Tables III and IV), the only significant difference between groups was the return to sport and leisure activities at 12 weeks, which favoured the control group (mean difference = –17.8 mm on a 100-mm VAS, 95% CI = –31.4 to –4.1). Five participants reported adverse events in total, but there was no difference in the incidence of adverse events between groups. Four participants in the experimental group complained of pain after physiotherapy. One participant in the control group reported pain from an unconfirmed stress fracture in the forefoot. In general, participants were highly satisfied with physiotherapy.
| Table III. Mean (95% CI) between-group differences in primary and secondary outcome measures |
| Outcome measure | 4 weeks | 12 weeks | 24 weeks |
| Primary | | | |
| Lower Extremity Functional Scale (/80) | –0.3 (–5.1–4.5) p = 0.89 | –3.9 (–8.8–1.1) p = 0.12 | –1.0 (–5.9–3.9) p = 0.70 |
| Assessment of Quality of Life (/45)* | 0.9 (–0.5–2.3) p = 0.20 | 1.2 (–0.1–2.5) p = 0.07 | 1.3 (0.1–2.5) p = 0.04 |
| Secondary | | | |
| Walking speed (m/sec) | 0.06 (–0.08–0.20) p = 0.40 | 0.02 (–0.15–0.18) p = 0.83 | 0.00 (–0.18–0.18) p = 1.00 |
| Step length asymmetry (cm)* | 0.2 (–1.8–2.2) p = 0.85 | 0.0 (–2.0–2.0) p = 1.00 | 1.1 (–0.8–3.0) p = 0.25 |
| Stepping rate on stairs (step/sec) | –0.1 (–0.3–0.1) p = 0.31 | 0.0 (–0.3–0.2) p = 0.67 | –0.1 (–0.3–0.2) p = 0.67 |
| Ankle dorsiflexion range of motion (mm) | –2.0 (–15.8–11.8) p = 0.78 | 7.1 (–8.0–22.1) p = 0.35 | 2.1 (–13.6–17.9) p = 0.79 |
| Pain on equal weight-bearing (mm)* | –1.4 (–7.4–4.6) p = 0.64 | –3.6 (–4.2–11.4) p = 0.36 | 0.4 (–4.8–5.6) p = 0.87 |
| Pain on stair descent (mm)* | 2.8 (–5.1–10.8) p = 0.49 | 5.7 (–1.4–12.8) p = 0.12 | 0.1 (–5.1–5.3) p = 0.97 |
| Return to work (mm) | –3.1 (–14.1–7.9) p = 0.58 | 0.4 (–11.7–12.5) p = 0.95 | 0.19 (–7.4–7.8) p = 0.96 |
| Return to sport and leisure activities (mm) | –1.4 (–14.7–11.9) p = 0.84 | –17.8 (–31.4––4.1) p = 0.01 | –6.8 (–19.0–5.3) p = 0.27 |
| Satisfaction with physiotherapy (mm) | 6.5 (–0.3–13.4) p = 0.06 | NA | NA |
| Global perceived effect of treatment (–5–+5) | 0.1 (–0.4–0.5) p = 0.76 | 0.0 (–0.3–0.4) p = 0.81 | 0.1 (–0.3–0.4) p = 0.72 |
| | Cumulative |
| Number of days to pain-free walking†* | 0.7 (0.5–1.1) p = 0.11 |
| Adverse events‡ | 4.29 (0.46–39.91) |
| Mean between-group differences are presented unless otherwise indicated: †hazard ratio, ‡odds ratio. A positive score favours the experimental group unless otherwise indicated by *. NA: not applicable, only measured at the 4-week follow-up; 95% CI: 95% confidence interval. |
| Table IV. Mean (SD) scores in secondary outcome measures |
| Outcome measure | Baseline | 4 weeks | 12 weeks | 24 weeks |
| Experimental group | Control group | Experimental group | Control group | Experimental group | Control group | Experimental group | Control group |
| Walking speed (m/sec) | 0.59 (0.47) | 0.81 (0.55) | 1.37 (0.36) | 1.42 (0.48) | 1.63 (0.29) | 1.69 (0.54) | 1.72 (0.31) | 1.78 (0.55) |
| Step length asymmetry (cm) | 11.0 (8.9) | 11.9 (8.9) | 6.1 (5.8) | 5.4 (5.9) | 2.9 (4.4) | 2.7 (5.5) | 1.9 (3.6) | 1.5 (5.2) |
| Stepping rate on stairs (steps/sec) | 0.7 (0.5) | 0.8 (0.5) | 1.5 (0.6) | 1.7 (0.6) | 1.9 (0.5) | 2.0 (0.6) | 2.0 (0.6) | 2.1 (0.7) |
| Ankle dorsiflexion range of motion (mm) | –57.0 (49.0) | –41.9 (58.7) | 20.7 (41.9) | 31.3 (48.3) | 47.8 (35.7) | 48.1 (52.2) | 54.5 (37.7) | 57.9 (47.0) |
| Pain on equal weight-bearing (mm) | 29.6 (23.4) | 20.4 (19.8) | 11.7 (14.8) | 11.5 (14.6) | 10.6 (21.6) | 6.2 (14.9) | 5.9 (12.8) | 4.8 (11.9) |
| Pain on stair descent (mm) | 32.9 (27.4) | 31.5 (19.8) | 21.3 (19.2) | 18.5 (19.4) | 12.9 (21.4) | 7.1 (11.9) | 6.3 (10.6) | 6.2 (14.3) |
| Return to work (mm) | 35.5 (37.0) | 46.5 (37.2) | 72.6 (31.8) | 79.8 (27.8) | 80.3 (31.9) | 83.2 (30.4) | 90.7 (18.8) | 92.0 (18.8) |
| Return to sport and leisure activities (mm) | 12.6 (22.2) | 13.9 (21.7) | 42.7 (34.2) | 44.7 (33.4) | 55.4 (37.0) | 73.6 (31.1) | 74.8 (31.6) | 81.7 (27.3) |
| Satisfaction with physiotherapy (mm) | NA | NA | 89.0 (13.4) | 82.5 (19.5) | NA | NA | NA | NA |
| Global perceived effect of treatment (–5–+5) | NA | NA | 3.3 (0.8) | 3.2 (1.2) | 3.9 (0.7) | 3.9 (1.0) | 4.1 (0.8) | 4.0 (0.9) |
| NA: not applicable; SD: standard deviation. |
There were no significant group by fracture interactions for the primary or secondary outcome measures, suggesting that the effects of manual therapy did not depend on fracture severity.
Economic evaluation
Quality-adjusted life-years were calculated using the utility scores of the AQoL. Both groups achieved substantial gains in quality-adjusted life-years, but there was no difference between groups over 24 weeks (mean difference = –0.09 years, 95% CI = –0.6–0.4). Because there were no significant between-group differences in either of the primary outcome measures, a conventional cost-effectiveness analysis was not undertaken. Tables V and VI present the costs and utilization of healthcare resources over the 24-week follow-up period. Although the differences between groups in total costs (i.e. direct plus out-of-pocket costs) were not statistically significant, participants in the experimental group incurred on average AU$199.55 more out-of-pocket costs (95% CI = 26.32–432.25). The experimental group also had more outpatient physiotherapy visits (Table VI; mean difference = 3.7 visits, 95% CI = 1.8–5.6). Utilization of other healthcare resources was not significantly different between groups.
| Table V. Mean (SD) costs (AU$) per group and mean (95% CI) between-group differences over the 24-week follow-up period |
| Costs | Experimental group (n = 46) | Control group (n = 46) | Between-group differences |
| Direct healthcare* | 405.78 (492.88) | 417.68 (676.64) | –11.89 (–257.57–211.74) p = 0.92 |
| Out-of-pocket† | 423.21 (577.04) | 223.65 (295.52) | 199.55 (26.32–432.25) p = 0.04 |
| Total | 828.99 (939.37) | 641.33 (807.31) | 187.66 (–124.78–539.47) p = 0.31 |
| *Includes costs of outpatient physiotherapy, medical specialists, general practitioners, emergency department, hospitalization, investigations and medications listed on the Pharmaceutical Benefits Scheme (PBS medication). †Includes costs of private health providers, gap costs of visits to medical specialists and general practitioners, investigations, PBS medication, non-PBS medication and other purchases, transport and use of private vehicle. 95% CI: 95% confidence interval; SD: standard deviation. |
| Table VI. Utilization of healthcare resources and between-group differences over the 24-week follow-up period |
| | Experimental group (n = 46) | Control group (n = 46) | Between-group differences |
| Outpatient physiotherapy |
| | Mean (SD) number of visits | 10.1 (5.9) | 6.4 (2.7) | p < 0.001† |
| Medical specialists | | | |
| | % of participants using | 63.0 | 52.2 | p = 0.40‡ |
| | Mean (SD) number of visits* | 2.2 (2.2) | 2.2 (2.2) | |
| General practitioners |
| | % of participants using | 30.4 | 19.6 | p = 0.34‡ |
| | Mean (SD) number of visits* | 3.3 (3.7) | 3.3 (4.2) | |
| Private (non-medical) health providers |
| | % of participants using | 21.7 | 15.2 | p = 0.59‡ |
| | Mean number of visits* | 11.4 (10.6) | 5.9 (4.8) | |
| Emergency department |
| | % of participants using | 4.3 | 0.0 | p = 0.50‡ |
| | Mean (SD) number of visits* | 1.0 (0.0) | NA | |
| Hospital admission |
| | % of participants using | 0.0 | 8.7 | p = 0.11‡ |
| | Mean (SD) length of stay* | NA | 3.8 (5.5) | |
| *If service was used; †ANOVA; ‡Fisher’s exact test. NA: not applicable, SD: standard deviation. |
Discussion
The most important finding of the study was that manual therapy plus a standard physiotherapy programme did not confer additional benefits over standard physiotherapy alone in adults after cast immobilization for ankle fracture. There were no clinically worthwhile differences between groups in activity limitation or quality of life, and the effects of manual therapy were not influenced by the severity of fracture. Furthermore, participants in the manual therapy plus physiotherapy group incurred higher out-of-pocket costs. In the absence of additional treatment effects and a reduction in costs or resource utilization, our results do not provide support for the use of manual therapy as part of a physiotherapy programme after ankle fracture.
The aims and design of our study were to compare manual therapy in addition to a physiotherapy programme to the physiotherapy programme alone. Contrary to our hypothesis, there were no differences between the experimental and control groups in the primary and secondary outcome measures. The only exceptions were a small and clinically insignificant difference in quality of life at 24 weeks, and a clinically worthwhile difference in the return to sport or leisure activities favouring the control group at 12 weeks. We suggest caution in the interpretation of this latter finding as evidence of a detrimental effect of manual therapy, because no other significant differences were found between the groups across the 3 follow-up time-points. The most plausible explanation is that the effect arose by chance.
Differences between groups in quality-adjusted life-years, total costs and costs to the healthcare system were not significant. However, there was a statistically significant difference between groups in out-of-pocket costs favouring the control group. This may be due to the costs of travel associated with an increased number of visits to outpatient physiotherapy and more visits to private non-medical health providers (including private physiotherapists) of the experimental group (Table V). The increased visits to outpatient physiotherapy were not unexpected, as the treatment protocol dictated that participants in the experimental group attend physiotherapy more frequently. We had anticipated that the additional physiotherapy sessions may reduce the utilization of other healthcare resources, but that was not the case.
We chose a pragmatic design to enhance the generalizability of the results to clinical practice. While it is possible that the findings may apply only to the specific manual therapy technique administered, current evidence suggests that the choice of manual therapy technique has little influence on effectiveness or economic consequences (29, 30). Our study was designed to minimize bias by using concealed random allocation and blinded outcome assessment (31), and was adequately-powered in the primary analysis of evaluating the effectiveness of adding manual therapy to a physiotherapy programme. The between-group differences in our primary outcomes did not include a clinically worthwhile effect, which further indicates that the statistical power was adequate. We also found that the effect of manual therapy was not influenced by fracture severity. It is worth noting that this was conducted as a secondary analysis. While there were no significant differences in the mean group by fracture interaction scores, the 95% CIs were wide and could not rule out a clinically worthwhile effect. Further investigation is needed to confirm the relationship between the effect of manual therapy and fracture severity.
Our findings differ from those of the only other randomized controlled trial on manual therapy after ankle fracture (16), which reported that manual therapy improved activity limitation and ankle range of motion. However, a re-analysis of the data showed that the results from that trial were not conclusive1. Studies of manual therapy in the treatment of other peripheral fractures have found no lasting benefit with manual therapy (32–34). Our findings also differ from the positive findings of trials of manual therapy after ankle sprain (23, 30, 35). The difference in pathology would be the most obvious explanation to account for the difference in findings. In addition, studies after ankle sprain only included assessment of effects after 1–3 treatment sessions and did not have longer-term follow-up.
We recently investigated the effects of adding stretching to a standard physiotherapy programme (exercise, gait re-training, advice) in people after ankle fracture (11), and showed that stretching did not improve activity limitation or ankle range of motion compared with physiotherapy alone. The present trial shows that manual therapy did not improve activity limitation or quality of life, or yield economic benefits. These trials provide the best available evidence for physiotherapy interventions after ankle fracture, that is, the focus should be on a structured and individually progressed programme consisting of exercise, gait re-training and advice on the return to normal activities. It is not yet known whether such a programme is more effective than no treatment or minimal treatment after ankle fracture. This could be explored in future research.
AcknowledgementS
This trial was funded by the Motor Accidents Authority of New South Wales, Australia, and the New South Wales Institute of Sport, Australia. CL received a scholarship from the National Health and Medical Research Council, Australia. The authors are grateful to the participants and staff at the physiotherapy departments of Royal North Shore Hospital, Royal Prince Alfred Hospital, and St Vincent’s Hospital, Sydney Australia, especially to T. Evans, D. Taylor, C. Gregory, S. Gupta and S. Bradley.
References
1. Dischinger PC, Read KM, Kufera JA, Kerns TJ, Burch CA, Jawed N, et al. Consequences and costs of lower extremity injuries. Assoc Adv Automot Med 2004; 48: 339–353.
2. Lash N, Horne G, Fielden J, Devane P. Ankle fractures: functional and lifestyle outcomes at 2 years. ANZ J Surg 2002; 72: 724–730.
3. Donatto KC. Ankle fractures and syndesmosis injuries. Orthop Clin North Am 2001; 32: 79–90.
4. Lesic A, Bumbasirevic M. Ankle fractures. Curr Orthop 2004; 18: 232–244.
5. Solomons L, Warwick D, Nayagam S, editors. Injuries of the ankle and foot. Apley’s system of orthopaedics and fractures. 8th edn. London: Arnold; 2001, p. 733–759.
6. Chesworth BM, Vandervoort AA. Comparison of passive stiffness variables and range of motion in uninvolved and involved ankle joints of patients following ankle fractures. Phys Ther 1995; 75: 253–261.
7. Shaffer MA, Okereke E, Esterhai JL, Jr, Elliott MA, Walker GA, Yim SH, et al. Effects of immobilization on plantar-flexion torque, fatigue resistance, and functional ability following an ankle fracture. Phys Ther 2000; 80: 769–780.
8. Stevens JE, Walter GA, Okereke E, Scarborough MT, Esterhai JL, George SZ, et al. Muscle adaptations with immobilization and rehabilitation after ankle fracture. Med Sci Sports Exerc 2004; 36: 1695–1701.
9. Vandenborne K, Elliott MA, Walter GA, Abdus S, Okereke E, Shaffer M, et al. Longitudinal study of skeletal muscle adaptations during immobilization and rehabilitation. Muscle Nerve 1998; 21: 1006–1012.
10. Ferkel R, Donatelli R, Hall W. Open reduction and internal fixation of the ankle. In: Maxey L, Magnusson J, editors. Rehabilitation for the postsurgical orthopedic patient. St Louis: Mosby; 2001, p. 302–313.
11. Moseley AM, Herbert RD, Nightingale EJ, Taylor DA, Evans TM, Robertson GJ, et al. Passive stretching does not enhance outcomes in patients with plantarflexion contracture after cast immobilization for ankle fracture: a randomized controlled trial. Arch Phys Med Rehabil 2005; 86: 1118–1126.
12. Hengeveld E, Banks K, editors. Maitland’s peripheral manipulation. 4th edn. Edinburgh: Elsevier Butterworth Heinemann; 2005.
13. Vicenzino B, Wright A. Physical treatments. In: Strong J, Unruh AM, Wright A, Baxter GD, editors. Pain. A textbook for therapists. Edinburgh: Churchill Livingstone; 2002, p. 187–206.
14. Wright A. Pain-relieving effects of cervical manual therapy. In: Grant R, editor. Physical therapy of the cervical and thoracic spine. 3rd edn. New York: Churchill Livingstone; 2002, p. 217–238.
15. Wright A. Hypoalgesia post-manipulative therapy: a review of a potential neurophysiological mechanism. Man Ther 1995; 1: 11–16.
16. Wilson F. Manual therapy versus traditional exercises in mobilisation of the ankle post-ankle fracture: a pilot study. NZ J Physiother 1991; 19: 11–16.
17. Hancock MJ, Herbert RD, Stewart M. Prediction of outcome after ankle fracture. J Orthop Sports Phys Ther 2005; 35: 786–792.
18. James LA, Sookhan N, Subar D. Timing of operative intervention in the management of acutely fractured ankles and the cost implications. Injury 2001; 32: 469–472.
19. Bhandari M, Sprague S, Ayeni O, Hanson B, Moro J. A prospective cost analysis following operative treatment of unstable ankle fractures: 30 patients followed for 1 year. Acta Orthop Scand 2004; 75: 100–105.
20. Korthals-de Bos IB, Hoving JL, van Tulder MW, Rutten-van Molken MP, Ader HJ, de Vet HC, et al. Cost effectiveness of physiotherapy, manual therapy, and general practitioner care for neck pain: economic evaluation alongside a randomised controlled trial. BMJ 2003; 326: 911.
21. Lin CC, Moseley AM, Refshauge KM, Haas M, Herbert RD. Effectiveness of joint mobilisation after cast immobilisation for ankle fracture: a protocol for a randomised controlled trial [ACTRN012605000143628]. BMC Musculoskelet Disord 2006; 26: 46.
22. Huskisson EC. Measurement of pain. Lancet 1974; 9: 1127–1131.
23. Green T, Refshauge K, Crosbie J, Adams R. A randomized controlled trial of a passive accessory joint mobilization on acute ankle inversion sprains. Phys Ther 2001; 81: 984–994.
24. Binkley JM, Stratford PW, Lott SA, Riddle DL. The Lower Extremity Functional Scale (LEFS): scale development, measurement properties, and clinical application. North American Orthopaedic Rehabilitation Research Network. Phys Ther 1999; 79: 371–383.
25. Hawthorne G, Richardson J, Day NA. A comparison of the Assessment of Quality of Life (AQoL) with four other generic utility instruments. Ann Med 2001; 33: 358–370.
26. Hawthorne G, Richardson J, Osborne R. The Assessment of Quality of Life (AQoL) instrument: a psychometric measure of health-related quality of life. Qual Life Res 1999; 8: 209–224.
27. Bennell K, Talbot R, Wajswelner H, Techovanich W, Kelly D, Hall A. Intra-rater and inter-rater reliability of a weight-bearing lunge measure of ankle dorsiflexion. Aust J Physiother 1998; 44: 175–180.
28. Hollis S, Campbell F. What is meant by intention to treat analysis? Survey of published randomised controlled trials. BMJ 1999; 319: 670–674.
29. van den Hout WB, Vermeulen HM, Rozing PM, Vlieland TP. Impact of adhesive capsulitis and economic evaluation of high-grade and low-grade mobilisation techniques. Aust J Physiother 2005; 51: 141–149.
30. Vicenzino B, Branjerdporn M, Teys P, Jordan K. Initial changes in posterior talar glide and dorsiflexion of the ankle after mobilization with movement in individuals with recurrent ankle sprain. J Orthop Sports Phys Ther 2006; 36: 464–471.
31. Schulz K, Chalmers I, Hayes R, Altman D. Empirical evidence of bias. Dimensions of methodological quality associated with estimates of treatment effects in controlled trials. JAMA 1995; 273: 408–412.
32. Kay S, Haensel N, Stiller K. The effect of passive mobilisation following fractures involving the distal radius: a randomised study. Aust J Physiother 2000; 46: 93–101.
33. Randall T, Portney L, Harris BA. Effects of joint mobilization on joint stiffness and active motion of the metacarpal-phalangeal joint. J Orthop Sports Phys Ther 1992; 16: 30–36.
34. Taylor NF, Bennell KL. The effectiveness of passive joint mobilisation on the return of active wrist extension following Colles’ fracture: a clinical trial. NZ J Physiother 1994; 22: 24–28.
35. Collins N, Teys P, Vicenzino B. The initial effects of a Mulligan’s mobilization with movement technique on dorsiflexion and pain in subacute ankle sprains. Man Ther 2004; 9: 77–82.