OBJECTIVE: The aim of this study was to evaluate the effects of unspecific neck pain and low back pain at a given time (1990–91) with respect to physical and social functioning and role limitations due to emotional problems 12 years later.
METHODS: A rural male study population (2351 individuals) was established in 1989 and a first survey conducted in 1990–91. A follow-up survey was performed in 2002–03. A total of 1405 persons participated in both surveys. Functioning and role limitations in 2002–03 were evaluated using the SF-36 instrument. Several possible confounders were included in the analyses.
RESULTS: Unspecific neck pain or low back pain in 1990–91 was shown in a multivariate longitudinal regression model to be significantly related to limited physical (odds ratio (OR) = 2.08; 95% confidence interval (CI) 1.51–2.87) and social (OR = 1.92; 95% CI 1.33–2.75) functioning 12 years later. The effects were only slightly modified by the confounders analysed. However, higher education independently and significantly predicted a low risk for functional limitations.
CONCLUSION: Non-specific neck pain and low back pain at a given time impacted on the risk of limited physical and social functioning many years later. Current symptoms of depression and anxiety at the time for the second survey had a high impact on functional limitations.
Key words: physical functioning, low back pain, neck pain, agriculture, disability.
J Rehabil Med 2008; 40: 555–561
Correspondence address: Anders Thelin, Gatugård, SE-355 94 Wederslöf, Sweden. E-mail: athelin@wgab.se
Submitted November 30, 2007; accepted February 25, 2008
Introduction
Neck pain (NP) and low back pain (LBP) are common complaints in Western countries. Sick-leave and disability related to NP and LBP in the short- or long-term perspective, medical costs and reduced production generate enormous costs to society (1, 2). Despite these facts and research into these conditions, we have only fragmentary knowledge of the causes of these conditions, their mechanisms and possible measures to reduce the resulting problems (3).
The aetiology of NP and LBP has been studied extensively (4, 5). A minority of those with symptoms have known locomotor system diseases, such as ankylosing spondylitis, rheumatoid arthritis, herniated disc or other defined injuries, while the majority do not have a specific diagnosis (6, 7). Most patients have problems for only a short period, although recurrent problems are common and some have chronic symptoms.
Many factors influence the risk of developing back and neck symptoms. Hereditary and social conditions as well as psychosocial circumstances impact greatly on the risks, especially of developing chronic problems without a specific diagnosis (8, 9). Physical workloads, as well as poor working posture, heavy lifting and repetitive movements, have all been related to low back symptoms in several studies (10, 11). In other studies the relationship between physical and/or psychological workload and NP and LBP has been more difficult to pinpoint (12, 13).
There is a need for more studies to elucidate why some individuals with back and neck symptoms visit their doctors frequently, ending up on sick-leave and subsequently retired on disability pension with a physical, social or emotional impairment, while others with the same magnitude of symptoms remain in employment and continue functioning more or less normally.
In a survey of 2351 rural, occupationally active men carried out in 1990–91 we asked about NP and LBP (14). We also gathered information on a large number of physical and social conditions. This population was then followed, and in 2002–03 a new survey was performed, focussing on the same variables as in 1990–91, but supplemented with instruments to obtain information on different outcomes.
The aim of this paper is to report how low back and neck symptoms are related to limitations in physical and social functioning and role limitations due to emotional problems in a prospective perspective.
Material and methods
Subjects
All male farmers born between 1930 and 1949 and living in 9 rural Swedish municipalities across the country were identified in 1989 using a national farm register. Farmers were defined as persons who owned or rented a farm and spent at least 25 h per week farming. Farm labourers were thus not included. To ensure the occupational affiliation to farming, the local representatives of the Federation of Swedish Farmers were consulted. A total of 1221 farmers fulfilled the sampling criteria.
A reference population was sampled from the national population register. The referents were matched to the farmers by age, sex and residential area and had to be occupationally active. An age mismatch of ± 3 years was allowed. Since most Swedish municipalities consist of both rural areas and urban areas, the smallest official administrative area (parish) was used to define residential area in order to ensure that the farmers and referents were living in the same local area. After this procedure, 1130 referents were sampled. Because the areas were rural, the number of potential reference subjects was limited and therefore the included referents were somewhat fewer than the farmers.
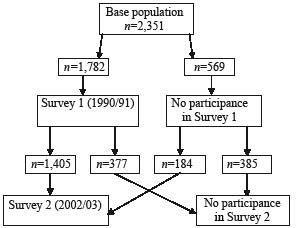
The 1221 farmers and 1130 referents were invited to participate in a baseline survey conducted by 2 co-trained teams of physicians and technicians during a 12-month period to allow for possible seasonal variations. A total of 1013 (83%) farmers and 769 (68%) referents participated. A detailed description of the sampling procedure, the survey and an analysis of the reasons for, and effects of, non-participation in the first survey have been given elsewhere (15). A total of 1589 persons participated in a follow-up survey in 2002–03, and 1405 of these individuals (786 farmers and 619 non-farming rural men) participated both times (Fig. 1). A total of 147 persons were deceased, 49 were too ill to participate in the survey 2 and one person was not traceable out of the original cohort of 2351 individuals. There were no differences in the 1990–91 prevalence of NP and LBP between those who participated in both surveys and those who only took part in the first survey.
During the 1990–91 survey all participants were structurally interviewed by a trained physician regarding previous and current diseases. When participants stated that they had been hospital inpatients or outpatients or had sought primary care, diagnoses were established. Men with specific back diagnoses in 1990–91 were excluded from the study population. A total of 10 men with rheumatoid arthritis (ICD9 code 714), 6 with ankylosing spondylitis (ICD9 code 720) and 44 with disk degeneration or disk herniation (ICD9 code 722) were excluded. Two had more than one specific back diagnosis, and so altogether 58 individuals were excluded. Thus the analyses in this paper are based on 1347 men who generated data in both 1990–91 and 2002–03, and did not report a specific neck or back diagnosis at survey 1.
Methods
Symptoms of NP or LBP were assessed from self-administered questionnaires answered on location during the first survey. Occurrence of LBP (problems in the low back area with ache, pain or discomfort) and NP (problems in neck or shoulder with ache, pain or discomfort) during the past year was assessed as “yes” or “no”. Lifetime experience of LBP and NP were similarly assessed.
Age, body mass index (BMI), physical workload, tobacco and alcohol consumption, profession, education and work stress-related factors (“demand” and “control” according to Karasek & Theorell (16) were recorded in 1990–91. These variables were included in the analyses as potential confounders. Symptoms of depression and/or anxiety, estimated using the Hopkins Symptom Check List-25 (HSCL-25), were recorded only in 2002–03.
Weight was measured on a lever balance to the nearest 100 g with the participant dressed in light sportswear. Height was measured without shoes to the nearest centimetre with a transportable scale fixed to the lever balance. BMI was calculated as weight divided by height squared. Smoking and snuff use habits were assessed in the structured interview as never smoked, current daily smoker and ex-smoker. For this report, smoking habits were dichotomized into current daily smoker vs non-smoker and snuff user into current daily snuff use vs no snuff use. Alcohol consumption was assessed in a structured interview and calculated as total consumption per week in grams of pure alcohol. Profession was noted as farmer or non-farmer. Educational level was chosen to indicate socio-economic status and was classified on a 5-grade scale as compulsory school only, vocational school, secondary school, college or university education, and then transformed to an educational index with the highest scores for those with the highest education (17).
Physical workload was assessed as the reported average number of hours working in a sitting or standing position, with a moderate, heavy or very heavy workload during an average working day according to Edholm’s activity scale (18). Psychological work factors were assessed according to Karasek et al. (19), and the demand component and control component of the instrument were used.
During the second survey (2002–03) a Swedish version of the HSCL-25 questionnaire was used to identify symptoms of depression and anxiety (20). The responders had to indicate their level of psychological distress in the past week on a 4-point Likert scale from 1 (not at all) to 4 (very much). The individual score was calculated by dividing the sum of points by the number of items.
The outcomes (physical and social functioning and role limitations due to emotional problems) were estimated using items from the Swedish version of the SF-36 questionnaire (21). This instrument has been developed from the Medical Outcome Study 36-item short-form health survey (SF-36) (22). It has been used in many studies and is well validated (23). How the SF-36 items were used and the definition of individuals with and without limited functioning is described in Table I.
| Table I. Definition of limited functioning using the SF-36 instrument |
| | Type of functioning |
| Physical* | Social† | Role limitations‡ |
| Definition of limited functioning | Difficulties with physical activities | Less time for work and social activities, difficulties with social contacts | Reduced time for work and contacts due to depression or worry |
| Structure of questionnaire | 10 items with the options yes, some or no | 4 items with the options yes or no | 3 items with the options yes or no |
| Limited functioning | ≥ 1 yes or > 1 some | 1 or more yes | 1 or more yes |
| *Physical functioning scale of SF-36. †Social functioning scale of SF-12. ‡Role limitations due to emotional problems scale of SF-36. |
Statistical analyses
The analyses were performed with the SPSS® (version 14.0) statistical program package. The partial non-response rates (missing values among responders) were generally below 3%, except for the job demand-control questionnaire, for which almost 10% of the forms were incomplete.
Those with previous or current NP or LBP 1990–91 were compared with those who did not report any neck or low back symptoms. Univariate logistic regression was used to compute odds ratios (OR) and their 95% confidence intervals (95% CI) for each variable in relation to each of the outcomes (physical and social functioning and role limitations).
The outcomes were used as dichotomized variables since the ORs of dichotomous covariates are easier to interpret. The variables smoking, snuff use and profession were also used as dichotomous variables. The rest of the variables studied were applied as continuous variables. Before being entered into the analyses, alcohol consumption (g/week) was divided by 10 and the workload scores by 100.
Multiple logistic regression models were used to compute adjusted ORs for the 3 outcomes with respect to NP and LBP symptoms together with exposure factors (possible confounders) measured in 1990–91. Specific neck and low back disorders achieved during the follow-up period, as well as depression and anxiety at the time for the second survey, may however, influence the reported functional capacity (24). We therefore analysed the effect of these 2 factors in a separate model. The multiple regression analyses were run with both Enter and Backward methods and criterion for exclusion in the backward model was 0.1. The backward results are presented here.
Results
A considerable proportion of the whole study population reported some, although mostly slight, limited functioning. This is probably related to the fact that the average age of the participants in performing the second survey was approximately 62 years.
How symptoms of NP and LBP and the possible confounders are related to the 3 outcomes is described in Tables II and III. The percentage with limited functioning or role limitations due to emotional problems was higher among those with current symptoms of NP and LBP than among those with no symptoms in 1990–91. Crude ORs for NP and LBP and the possible confounders with reference to those who had never had NP or LBP are given in Table IV.
| Table II. Outcomes, background variables and possible confounders. Frequency and means in the study population |
| | Outcomes 2002–03 Limited functioning or role limitations |
| Physical | Social | Emotional (Role) |
| No | Yes | No | Yes | No | Yes |
| % | Mean | Range | % | Mean | Range | % | Mean | Range | % | Mean | Range | % | Mean | Range | % | Mean | Range |
| NP or LBP symptoms 1990–91 |
| Never (n = 269, 20.0%) | 24.1 | | | 15.7 | | | 23.3 | | | 12.9 | | | 21.2 | | | 15.4 | | |
| Previously (n = 224, 16.6%) | 18.0 | | | 15.1 | | | 17.7 | | | 14.8 | | | 16.1 | | | 20.1 | | |
| Current (n = 836, 62.1%) | 56.3 | | | 68.1 | | | 57.7 | | | 70.9 | | | 61.3 | | | 63.2 | | |
| Information missing (n = 18, 1.3%) | 1.6 | | | 1.1 | | | 1.3 | | | 1.5 | | | 1.4 | | | 1.3 | | |
| Possible confounders (data from survey 1, 1990–91) |
| Age 1990, years | | 48.6 | 40–61 | | 51.6 | 41–61 | | 49.5 | 40–61 | | 51.3 | 41–61 | | 49.8 | 40–61 | | 51.4 | 40–61 |
| BMI, kg/m2 | | 25.7 | 18.3–37.6 | | 26.9 | 18.8–44.4 | | 26.0 | 18.3–41.1 | | 26.8 | 20.2–44.4 | | 26.2 | 18.3–44.4 | | 26.9 | 19.5–36.2 |
| Workload, units | | 195 | 35–483 | | 202 | 24–570 | | 192 | 35–531 | | 214 | 24–570 | | 197 | 24–531 | | 207 | 42–570 |
| Smoking, yes | 19.5 | | | 23.3 | | | 20.8 | | | 22.3 | | | 20.7 | | | 23.9 | | |
| Snuff user, yes | 12.5 | | | 16.2 | | | 13.0 | | | 17.0 | | | 13.4 | | | 17.9 | | |
| Alcohol consumption, g/week | | 23.6 | 0–176 | | 25.1 | 0–227 | | 24.8 | 0–176 | | 23.2 | 0–227 | | 23.9 | 0–227 | | 25.8 | 0–179 |
| Occupation (farmer) | 57.1 | | | 60.8 | | | 53.9 | | | 70.1 | | | 57.8 | | | 64.1 | | |
| Education (index) | | 2.4 | 1–5 | | 1.9 | 1–5 | | 2.2 | 1–5 | | 2.0 | 1–5 | | 2.2 | 1–5 | | 2.0 | 1–5 |
| Psychological demand (units) | | 12.8 | 5–20 | | 12.7 | 5–20 | | 12.6 | 5–20 | | 13.2 | 5–20 | | 12.7 | 5–20 | | 13.1 | 5–20 |
| Control (units) | | 7.1 | 2–8 | | 7.0 | 2–8 | | 7.1 | 2–8 | | 7.1 | 2–8 | | 7.1 | 2–8 | | 7.1 | 2–8 |
| Possible modifiers (data from survey 2, 2002–03) |
| Depression HSCL scale, index | | 1.2 | 1–2.4 | | 1.3 | 1–2.76 | | 1.2 | 1–2.72 | | 1.4 | 1–2.76 | | 1.2 | 1–2.72 | | 1.5 | 1–2.76 |
| Specific diagnosis of neck, low back | 2.7 | | | 7.0 | | | 3.6 | | | 7.5 | | | 4.5 | | | 6.4 | | |
| HSCL: Hopkins Symptom Check List; BMI: body mass index; NP: neck pain; LBP: low back pain. |
| Table III. Neck pain (NP) and/or low back pain (LBP) 1990–91 |
| | Never n = 269 (20.0%) | Previously n = 224 (16.6%) | Current n = 836 (62.1%) |
| n | % | Mean | n | % | Mean | n | % | Mean |
| Outcomes 2002–03 |
| Reduced functional capacity | 103 | 38.3 | | 99 | 44.2 | | 446 | 53.3 | |
| Reduced social capacity | 53 | 19.7 | | 61 | 27.2 | | 292 | 34.9 | |
| Reduced emotional capacity | 36 | 13.4 | | 47 | 21.0 | | 148 | 17.7 | |
| Possible confounders (data from survey 1, 1990–91) |
| Age 1990, years | | | 49.9 | | | 50.8 | | | 50.0 |
| BMI, kg/m2 | | | 26.2 | | | 26.3 | | | 26.3 |
| Workload, units | | | 187 | | | 196 | | | 203 |
| Smoking, yes | 64 | 23.8 | | 37 | 16.5 | | 180 | 21.5 | |
| Snuff user, yes | 30 | 11.2 | | 33 | 14.7 | | 127 | 15.2 | |
| Alcohol consumption, g/week | | | 23.9 | | | 24.4 | | | 24.4 |
| Occupation (farmer) | 135 | 50.2 | | 122 | 54.4 | | 529 | 63.3 | |
| Education (index) | | | 2.1 | | | 2.2 | | | 2.1 |
| Psychological demand (units) | | | 12.3 | | | 12.6 | | | 13.0 |
| Control (units) | | | 7.2 | | | 7.1 | | | 7.1 |
| Possible modifiers (data from survey 2, 2002–03) |
| Depression HSCL scale, index | | | 1.21 | | | 1.27 | | | 1.31 |
| Specific diagnosis of neck, low back | 4 | 1.51 | | 11 | 4.91 | | 48 | 5.74 | |
| HSCL: Hopkins Symptom Check List; BMI: body mass index. |
| Table IV. Limited functioning or role limitations with regard to NP and LBP and possible confounders. Crude odds ratio (OR) and 95% confidence intervals (CI). |
| | Limited functioning or role limitations 2002–03 |
| Physical OR (95% CI) | Social OR (95% CI) | Role limitations OR (95% CI) |
| NP and/or LBP 1990–91 |
| Never | 1 | 1 | 1 |
| Previously | 1.29 (0.90–1.85) | 1.52 (1.00–2.31) | 1.72 (1.07–2.77) |
| Current | 1.85 (1.40–2.45) | 2.23 (1.60–3.11) | 1.42 (0.96–2.10) |
| Possible confounders 1990–91 |
| Age 1990, years | 1.10 (1.07–1.12) | 1.05 (1.03–1.08) | 1.05 (1.02–1.07) |
| BMI, kg/m2 | 1.15 (1.11–1.20) | 1.08 (1.04–1.12) | 1.07 (1.03–1.12) |
| Workload, units | 1.10 (0.97–1.25) | 1.36 (1.18–1.56) | 1.15 (0.98–1.36) |
| Smoker, yes | 1.26 (0.96–1.63) | 1.10 (0.83–1.45) | 1.21 (0.87–1.69) |
| Snuff user, yes | 1.36 (1.00–1.85) | 1.37 (1.00–1.89) | 1.42 (0.97–2.06) |
| Alcohol consumption, g/week | 1.02 (0.98–1.06) | 0.98 (0.94–1.02) | 1.02 (0.98–1.07) |
| Profession (farmer) | 1.17 (0.94–1.45) | 2.01 (1.57–2.57) | 1.31 (0.97–1.75) |
| Education (index) | 0.76 (0.70–0.83) | 0.84 (0.76–0.92) | 0.87 (0.77–0.98) |
| Psychological demand (units) | 0.99 (0.95–1.03) | 1.09 (1.04–1.15) | 1.05 (1.00–1.12) |
| Control (units) | 0.95 (0.87–1.04) | 0.99 (0.90–1.09) | 1.00 (0.89–1.12) |
| Possible modifiers (data from 2002–03) |
| Depression HSCL scale, index (data from survey 2) | 4.18 (2.72–6.44) | 10.26 (6.51–16.17) | 16.34 (9.88–27.01) |
| Specific diagnosis neck, low back (data from survey 2) | 2.75 (1.58–4.79) | 2.19 (1.32–3.63) | 1.47 (0.81–2.67) |
| Bold indicate significant observations (OR < > 1). HSCL: Hopkins Symptom Check List; BMI: body mass index; NP: neck pain; LBP; low back pain. |
Table V. Limited functioning or role limitations with regard to NP and LBP. Adjusted OR’s. Multiple logistic regression backward model. Reported values still in equation last step.
| | Limited functioning or role limitations 2002–03 |
| Physical OR (95% CI) | Social OR (95% CI) | Role limitations OR (95% CI) |
| NP and/or LBP 1990–91 |
| Never | 1 | 1 | 1 |
| Previously | 1.29 (0.86–1.93) | 1.27 (0.80–2.01) | 1.70 (1.02–2.82) |
| Current | 2.08 (1.51–2.87) | 1.92 (1.33–2.75) | 1.18 (0.77–1.80) |
| Possible confounders 1990–91 |
| Age 1990, years | 1.08 (1.06–1.11) | 1.06 (1.03–1.08) | 1.05 (1.02–1.07) |
| BMI, kg/m2 | 1.13 (1.08–1.18) | 1.06 (1.02–1.11) | 1.07 (1.02–1.13) |
| Workload, units | | | |
| Smoker, yes | 1.47 (1.09–2.00) | | 1.51 (1.04–2.19) |
| Snuff user, yes | | 1.58 (1.10–2.28) | 1.53 (1.01–2.32) |
| Alcohol consumption, g/week | | | |
| Profession (farmer) | | 1.97 (1.48–2.63) | 1.44 (1.03–2.02) |
| Education (index) | 0.83 (0.75–0.91) | 0.88 (0.79–0.98) | |
| Psychological demand (units) | | 1.09 (1.04–1.15) | 1.06 (0.99–1.12) |
| Control (units) | | | |
| Bold indicate significant observations (OR < > 1). NP: neck pain; LBP; low back pain; OR: odds ratio; CI: confidence interval; BMI: body mass index. |
Current NP and/or LBP in 1990–91, but no previous NP or LBP, predicted limited physical (OR = 2.08; 95% CI 1.51–2.87) and social (OR = 1.92; 95% CI 1.33–2.75) functioning in 2002–03, but had no impact on the risk of role limitations due to emotional problems after adjusting for possible confounders in a multiple longitudinal regression model (Table V).
Age and BMI had significant correlations with all of the 3 outcomes in this model, while physical workload had no correlation with any of the outcomes. Smoking was significantly correlated with limitation of physical functioning (OR = 1.47; 95% CI 1.09–2.00) but not with limitation of social functioning or role limitations due to emotional problems. Experienced psychological demands according to Karasek et al. (19) were related to a slightly increased risk of limited social functioning. Higher education independently and significantly predicted a low risk of functional limitation.
Current symptoms of depression and/or anxiety estimated using the HSCL-25 screening instrument at the time for outcomes and analysed in a separate multiple regression model had a highly significant correlation to all 3 kinds of studied limitations of functioning (physical: OR = 4.06; 95% CI 2.45–6.72; social: OR = 13.02; 95% CI 7.63–22.23 and role limitations due to emotional problems: OR = 22.85; 95% CI 12.68–41.19).
During the period 1990–2003, 64 men reported contact with doctors or hospitals because of specific neck or low back disease (rheumatoid arthritis: 9; ankylosing spondylitis: 2; and disk degeneration with or without disk herniation: 53). Being given a specific diagnosis during the period was also related to limited physical (OR = 1.85; 95% CI 0.99–3.47) and social (OR = 2.44; 95% CI 1.31–4.56) functioning in the same separate multiple regression model. Adding depression and a specific diagnosis, however, only slightly modified the relations between NP/LBP and the studied outcomes.
Discussion
Rural men with current or a combination of current and previous NP or LBP in 1990–91 had a significant risk of limited functioning 12 years later. Role limitations due to emotional problems had no correlation with previous NP or LBP.
Age, BMI, smoking, snuff use, farming and psychological demands had a positive correlation with 1, 2 or all 3 of the outcomes, and education was negatively correlated with the outcomes. Age and obesity are factors often discussed in this context (25, 26) and may affect the results in different ways.
Current depression and/or anxiety symptoms at a given time impact on functional capacity (24, 27). To control for this effect we analysed the modification of the results due to this factor in a separate model. The impact was significant, several times higher than the effect of other factors with respect to physical functioning, and it was also a significant risk factor for limited social functioning and role limitations due to emotional problems. The HCSL-25 instrument clearly estimates mainly the same factors as the SF-36 scale for mental health (28, 29). However, the correlations between NP and LBP and the outcomes, as well as the effect of exposure factors studied in 1990–91, were only slightly modified. Thus the main results presented here cannot be referred to the effect of depression and/or anxiety at the time for the second survey.
The cohort under study was created in 1989 as a long-term project with the intention of studying salutogenetic factors. The study population is rural, fairly large, and has provided data from a broad range of areas. With regard to the type of project, the non-response rate is acceptable and the long period of follow-up is a strength. Analyses of the responders/non-responders indicate no main differences between the 2 surveys. The difference in size of the populations at survey is largely related to fatalities during follow-up.
A large number of studies report that NP and LBP are related to sick-leave, early retirement and disability pension (1, 2). The significance of symptoms from neck and low back has been discussed in other studies (30), which indicate that early symptoms from the neck and low back are only related to a slightly elevated risk of disability in the long-term perspective (31).
The symptoms and problems of NP and LBP in our study were reported using a questionnaire and answered on location. How this was done has been described in previous studies (32). As reported in a large number of papers, this kind of symptom is very common in the general population (33, 34). Our population may have more of this kind of symptom. Rural men, and especially farmers, have low risks of a number of health problems (35), but musculoskeletal disorders are more common among farmers than in the general population (14).
We have previously made a validation of the diagnoses determined by the physicians in this project and of the diagnoses established in hospitals for the same period and group. The quality of the interview-based diagnoses was high (15).
It is a common belief that high physical workloads generate back pain. A number of studies have described associations between both physical and psychological workload and LBP (36, 37) and sick leave and disability because of back pain (38). Other studies have not been conclusive concerning the relationship between physical workload and reduced capacity (13, 39). In this study we found no effect of physical workload on functioning in a 12-year perspective.
Studies indicate that work stress may negatively affect work capacity in different ways (40, 41). Our results only support a slight effect of work stress in terms of reduced social functioning.
Depression and anxiety is a major factor in all kinds of functional limitations (24, 27). This has not been fully understood or sufficiently noted (42). If mental and emotional aspects are not considered all kinds of rehabilitation processes may fail.
In conclusion, non-specific NP and LBP impacted on the risk of limited physical and social functioning many years later. This risk was only slightly modified by a number of possible confounders. Physical workload had no effect on functioning 12 years later. Current symptoms of depression and anxiety were significantly associated with all kinds of limited functioning. Higher education associated negatively with limited functioning (i.e. this is a significant protective factor).
Acknowledgements
This research project was supported by grants from AFA Insurance, LRF Research Foundation and the Swedish Council for Working Life and Social Research.
References
1. Steenstra IA, Verbeek JH, Heymans MW, Bongers PM. Prognostic factors for duration of sick leave in patients sick listed with acute low back pain: a systematic review of the literature. Occup Environ Med 2005; 62: 851–860.
2. Kent PM, Keating JL. The epidemiology of low back pain in primary care. Chiropr Osteopat 2005; 13: 13.
3. Walker BF. The prevalence of low back pain: a systematic review of the literature form 1966 to 1998. J Spinal Disord 2000; 13: 205–217.
4. Chaffin D, Andersson G, editor. Occupational biomechanics. New York; 1991.
5. Mayer TG, Gatchel R, Polatin, P, editors. Occupational musculoskeletal disorders. Function, outcomes and evidence. Philadelphia: PRIDE Research Foundation Scientific Publications; 2000.
6. Borenstein DG. Chronic low back pain. Rheum Dis Clin North Am 1996; 22: 439–456.
7. Krause N, Ragland DR. Occupational disability due to low back pain: a new interdisciplinary classification based on a phase model of disability. Spine 1994; 19: 1011–1020.
8. Linton SJ. A review of psychological risk factors in back and neck pain. Spine 2000; 25: 1148–1156.
9. Bigos SJ, Battie MC, Fisher LD, Hansson TH, Spengler DM, Nachemson AL. A prospective evaluation of preemployment screening methods for acute industrial back pain. Spine 1992; 17: 922–926.
10. Nachemson AL, Jonsson E, editors. Neck and back pain. The scientific evidence of causes, diagnosis and treatment. Philadelphia: Lippincott Williams & Wilkins; 2000.
11. Hoogendoorn WE, van Poppel MN, Bongers PM, Koes BW, Bouter LM. Physical load during work and leisure time as risk factors for back pain. Scand J Work Environ Health 1999; 25: 387–403.
12. Vingård E, Alfredsson L, Hagberg M, Kilbom Å, Theorell T, Waldenström M, et al. To what extent do current and past physical and psychosocial occupational factors explain care-seeking for low back pain in a working population? Results from the Musculoskeletal Intervention Center-Norrtälje Study. Spine 2000; 25: 493–500.
13. Biering-Sorensen F, Thomsen CE, Hilden J. Risk indicators for low back trouble. Scand J Rehabil Med 1989; 21: 151–157.
14. Holmberg S, Stiernström EL, Thelin A, Svärdsudd K. Musculoskeletal symptoms among farmers and non-farmers: a population-based study. Int J Occup Environ Health 2002; 8: 339–345.
15. Stiernström EL, Holmberg S, Thelin A, Svärdsudd K. Reported health status among farmers and nonfarmers in nine rural districts. J Occup Environ Med 1998; 40: 917–924.
16. Karasek RA, Theorell T, editors. Healthy work: stress, productivity and the reconstruction of working life. New York: Basic Books; 1990.
17. Holmberg S, Thelin A, Stiernström EL, Svärdsudd K. Psychosocial factors and low back pain, consultations, and sick leave among farmers and rural referents: a population-based study. J Occup Environ Med 2004; 46: 993–998.
18. Ilmarinen J, Knauth P, Klimmer F, Rutenfranz J. The applicability of the Edholm Scale for activity studies in industry. Ergonomics 1979; 22: 369–376.
19. Karasek R, Baker D, Marxer F, Ahlbom A, Theorell T. Job decision latitude, job demands, and cardiovascular disease: a prospective study of Swedish men. Am J Public Health 1981; 71: 694–705.
20. Nettelbladt P, Hansson L, Stefansson CG, Borgquist L, Nordström G. Test characteristics of the Hopkins Symptom Check List-25 (HSCL-25) in Sweden, using the Present State Examination (PSE-9) as a caseness criterion. Soc Psychiatry Psychiatr Epidemiol 1993; 28: 130–133.
21. Sullivan M. Livskvalitetsmätning. Nytt generellt och nytt tumörspecifikt formulär för utvärdering och planering. [Measuring quality of life. A new general and a new tumor specific formulary for evaluation and planning]. Läkartidningen 1994; 91: 1340–1341 (in Swedish).
22. Ware JE, Jr., Sherbourne CD. The MOS 36-item short-form health survey (SF-36). I. Conceptual framework and item selection. Med Care 1992; 30: 473–483.
23. Sullivan M, Karlsson J. The Swedish SF-36 Health Survey III. Evaluation of criterion-based validity: results from normative population. J Clin Epidemiol 1998; 51: 1105–1113.
24. Millward LJ, Lutte A, Purvis RG. Depression and the perpetuation of an incapacitated identity as an inhibitor of return to work. J Psychiatr Ment Health Nurs 2005; 12: 565–573.
25. Peltonen M, Lindroos AK, Torgerson JS. Musculoskeletal pain in the obese: a comparison with a general population and long-term changes after conventional and surgical obesity treatment. Pain 2003; 104: 549–557.
26. Luime JJ, Kuiper JI, Koes BW, Verhaar JA, Miedema HS, Burdorf A. Work-related risk factors for the incidence and recurrence of shoulder and neck complaints among nursing-home and elderly-care workers. Scand J Work Environ Health 2004; 30: 279–286.
27. Kohlboeck G, Greimel KV, Piotrowski WP, Leibetseder M, Krombholz-Reindl M, Neuhofer R, et al. Prognosis of multifactorial outcome in lumbar discectomy: a prospective longitudinal study investigating patients with disc prolapse. Clin J Pain 2004; 20: 455–461.
28. Sullivan M, Karlsson J, Ware JE, Jr. The Swedish SF-36 Health Survey-I. Evaluation of data quality, scaling assumptions, reliability and construct validity across general populations in Sweden. Soc Sci Med 1995; 41: 1349–1358.
29. Strand BH, Dalgård OS, Tambs K, Rognerud M. Measuring the mental health status of the Norwegian population: a comparison of the instruments SCL-25, SCL-10, SCL-5 and MHI-5 (SF-36). Nord J Psychiatry 2003; 57: 113–118.
30. Deyo RA, Rainville J, Kent DL. What can the history and physical examination tell us about low back pain? JAMA 1992; 268: 760–765.
31. Deyo RA. Measuring the functional status of patients with low back pain. Arch Phys Med Rehabil 1988; 69: 1044–1053.
32. Holmberg S, Thelin A, Stiernström E, Svärdsudd K. The impact of physical work exposure on musculoskeletal symptoms among farmers and rural non-farmers. Ann Agric Environ Med 2003; 10: 179–184.
33. Cassidy JD, Carroll LJ, Cote P. The Saskatchewan health and back pain survey. The prevalence of low back pain and related disability in Saskatchewan adults. Spine 1998; 23: 1860–1866; discussion 1867.
34. Cote P, Cassidy JD, Carroll LJ, Kristman V. The annual incidence and course of neck pain in the general population: a population-based cohort study. Pain 2004; 112: 267–273.
35. Thelin A, Stiernström EL, Holmberg S. Blood lipid levels in a rural male population. J Cardiovasc Risk 2001; 8: 165–174.
36. Riihimäki H, Mattsson T, Zitting A, Wickström G, Hanninen K, Waris P. Radiographically detectable degenerative changes of the lumbar spine among concrete reinforcement workers and house painters. Spine 1994; 15: 114–119.
37. Nuwayhid IA, Stewart W, Johnson JV. Work activitie sand the onset of first-time low back pain among New York City fire fighters. Am J Epidemiol 1993; 137: 539–548.
38. Hartvigsen J, Bakketeig LS, Leboeuf-Yde C, Engberg M, Lauritzen T. The association between physical workload and low back pain clouded by the “healthy worker” effect: population-based cross-sectional and 5-year prospective questionnaire study. Spine 2001; 26: 1788–1792; discussion 1792–1793.
39. Leino PI. Does leisure time physical activity prevent low back disorders? A prospective study of metal industry employees. Spine 1993; 18: 863–871.
40. Krause N, Ragland DR, Greiner BA, Syme SL, Fisher JM. Psychosocial job factors associated with back and neck pain in public transit operators. Scand J Work Environ Health 1997; 23: 179–186.
41. Ekberg K, Björkqvist B, Malm P, Bjerre-Kiely B, Karlsson M, Axelson O. Case-control study of risk factors for disease in the neck and shoulder area. Occup Environ Med 1994; 51: 262–266.
42. Jarvik JG, Hollingworth W, Heagerty PJ, Haynor DR, Boyko EJ, Deyo RA. Three-year incidence of low back pain in an initially asymptomatic cohort: clinical and imaging risk factors. Spine 2005; 30: 1541–1548; discussion 1549.