OBJECTIVE: To explore the relationship between occupational gaps, depressive mood and life satisfaction in persons who have acquired a brain injury during the past 1–4 years and to test the Occupational Gaps Questionnaire.
DESIGN: A cross-sectional study.
SUBJECTS: A total of 116 persons with traumatic brain injury or subarachnoid haemorrhage acquired 1–4 years previously.
METHODS: A postal survey with questions on occupational gaps, focusing on the domains instrumental activities of daily living, social life, leisure and work (Occupational Gaps Questionnaire), life satisfaction (LiSat-11 checklist) and depressive mood (Hospital Anxiety and Depression Scale). Rasch analyses and principal component analyses were performed to ensure that data from the LiSat-11 and Occupational Gaps Questionnaire could be used subsequently as valid unidimensional measures in regression and correlational analyses.
RESULTS: Calibration of the Occupational Gaps Questionnaire and the LiSat-11 revealed that the items and persons demonstrated acceptable goodness-of-fit to the Rasch models respectively, supporting internal scale validity and person-response validity. In addition, principal component analyses revealed that the measures could be used as valid uni-dimensional estimations of occupational gaps and life satisfaction. There was a strong relationship between the extent of occupational gaps and perceived life satisfaction, a weaker relationship with depressive mood and a non-significant relationship with the aetiological diagnoses and life satisfaction. The factors explained 32% (occupational gaps), 6% (depressive mood), and 2% (diagnosis), respectively, of the total explained variance (40%).
CONCLUSION: There was a strong correlation between participation in desired everyday occupations and life satisfaction 1–4 years after an acquired brain injury. This indicates that individually perceived occupational gaps, as recorded by the Occupational Gaps Questionnaire, could be relevant targets for tailored interventions in order to improve life satisfaction among clients with acquired brain injuries.
Key words: brain injuries, activities of daily living, adaptation psychological, quality of life.
J Rehabil Med 2009; 41: 187–194
Correspondence address: Gunilla Eriksson, Karolinska Institutet, Department of Neurobiology, Caring Sciences and Society, Division of Occupational Therapy, Alfred Nobels Allé 23, 4th floor, SE-141 83 Huddinge, Sweden. E-mail: gunilla.eriksson@ki.se
Submitted February 29, 2008; accepted September 29, 2008INTRODUCTION
*This paper was presented as a lecture at the World Federation of Occupational Therapists Congress, 27 July 2006 in Sydney, Australia, as well as a poster at the COTEC conference, 20–21 May 2008 in Hamburg, Germany.
Life satisfaction might be considered to be the main goal of the rehabilitation process (1). After a life-course disruption (2) resulting from an acquired brain injury (ABI), it is assumed in the literature that a person’s perceived life satisfaction will be influenced by whether they can participate in desired everyday occupations (1, 3), i.e. usual activities, such as taking care of themselves and their households, employment, and participating in social and leisure activities.
Empirical studies have shown that functioning decreases and everyday life changes after ABI, i.e. there are changes in both work and social life (4, 5). Everyday occupations become more challenging and more difficult to perform (5). According to Atchley (6), sudden and profound life changes, such as acquiring a brain injury, require considerable changes in planning, require social support, and bring about a need for adaptation as a consequence of the gaps that occur in the person’s everyday occupations (6). An occupational gap is defined as the gap that occurs between what the individual wants and needs to do and what he or she actually does (7), and it applies to functioning in multiple domains, including instrumental activities of daily living (ADL), social life, leisure, and in work, i.e. the domain of participation according to the International Classification of Functioning, Disability and Health (ICF) (8). In client-centred practice (9) the clients’ choices and goals are in focus in rehabilitation, i.e. the mission is to enable people to perform the occupations that they want and need to perform. Thus, within a client-centred practice context gaps between actual and desired occupations (occupational gaps) are viewed as an important phenomenon to study. An instrument that assesses the presence of occupational gaps in 28 everyday occupations has been developed, and it has been shown that the occurrence of occupational gaps increases significantly after brain injury (7). Executive impairments were the impairments that had the most significant influence on the number of occupational gaps, while the period of time lapsed since the injury had no impact (7).
Numerous studies have shown that perceived life satisfaction is lower after a brain injury (10, 11). Several factors, such as being employed (11), having the opportunity to interact socially and to carry out recreational activities, influence life satisfaction (12). Depression is common after ABI, and prevalence of depression is strongly related to perception of low life satisfaction. Very low ratings of life satisfaction, accompanied by high rates of depression and anxiety, have been reported in samples of persons with traumatic brain injury (TBI) (11, 13) and stroke (14). There is considerable variation in the reported prevalence of depression after stroke (range 25–79%) (15), mild TBI (range 6–39%) and severe TBI (range 10–77%) (16).
Life satisfaction has been surveyed in a sample representative of the Swedish population as a whole. Factors that negatively influenced the perception of life satisfaction were: having no partner; and being a first-generation immigrant (17). Positive predictors of satisfaction with life as a whole were: a higher educational level; good financial situation; and being employed (18). One can expect that these factors might also influence life satisfaction in a sample of Swedish brain-injured individuals.
To sum up, previous research has shown that there is a clear relationship between life satisfaction and functioning in various aspects after brain injury (11, 12). Furthermore, there is a definite relationship between depression after brain injury and perceived life satisfaction (11, 13, 14). However, there is a lack of empirical studies exploring the relationship between life satisfaction and occupational gaps. Considering life satisfaction to be the main goal of rehabilitation and the strong emphasis in rehabilitation to take the clients’ perspectives into account, the relationship between life satisfaction and occupational gaps needs to be clarified. Furthermore, the instrument assessing the presence of occupational gaps needs to be tested.
The aim of this study was to explore the relationship between occupational gaps, depressive mood and life satisfaction in persons who had ABI during the past 1–4 years and to test the Occupational Gaps Questionnaire.
METHODS
Participants
The study was based on a survey using postal questionnaires, carried out in a sample of persons with brain injuries. It was carried out 1–4 years after they had been treated for TBI or subarachnoid haemorrhage (SAH) in the intensive care unit of the neurosurgical department of a regional hospital in central Sweden. This is the second study based on the same survey. The total sample of 187 persons (response rate 89%) is described elsewhere (7). In order to enable an exploration of the relationship between occupational gaps and life satisfaction, we reduced the sample to those participants who had reported that they had experienced one or more occupational gaps (n = 116), even if this procedure might reduce the representativity of the sample. Information relating to the injuries and socio-demographic characteristics of the 116 persons in this study sample is shown in Table I. The grading of injury severity in the sample was based on post-resuscitation scores of the Reaction Level Scale (RLS) (19), which is used in the routine assessments of these patients. The RLS is an 8-graded scale for bedside assessment of overall consciousness level in patients with acute brain disorders. The inter-observer agreement for the RLS is good (kappa 0.69) when used on individuals with TBI or vascular disorders, and the scale is sensitive to change (19). Comparison of this scale with the Glasgow Coma Scale (GCS) (20), which is in more widespread use, have shown that both scales reliably identify patients at the extremes of the severity spectrum but less so for the moderate group (21). In general an RLS score of 1 indicates the mildest degree of injury and corresponds to a GCS score of 15, RLS 4–8 indicate severe injuries and correspond to GCS scores of 8–3, and RLS 2–3 indicate a mild to moderate injury and correspond to GCS scores 14–9.
| Table I. Injury and socio-demographic characteristics of the study sample (n = 116) |
| | Subjects with SAH, n (%) | Subjects with TBI, n (%) | Total, n (%) | Responses (n) |
| Diagnoses | 71 (61) | 45 (39) | 116 (100) | 116* |
| RLS-level 1 RLS-level 2–3 RLS-level 4–8 | 41 (35) 23 (20) 7 (6) | 10 (9) 21 (18) 14 (12) | 51 (44) 44 (38) 21 (18) | 116* |
| Male/female | 24 (21)/47 (40) | 36 (31)/9 (8) | 60 (52)/56 (48) | 116 |
| Cohabited or married | 47 (41) | 19 (17) | 66 (57) | 115 |
| Born in Sweden | 61 (53) | 40 (34) | 101 (87) | 116 |
| Education to at least high school level | 40 (35) | 34 (29) | 74 (64) | 115 |
| Worked or studied before ABI | 65 (56) | 38 (33) | 103 (89) | 116 |
| Working or studying after ABI | 31 (27) | 23 (20) | 54 (47) | 116 |
| *Information from patient records. RLS: Reaction Level Scale; RLS 1: alert; RLS 2–3: drowsy, or very drowsy or confused; RLS 4–8: unconscious; localizes or does not localize pain; SAH: subarachnoid haemorrhage; ABI: acquired brain injury; TBI: traumatic brain injuty.. |
Prior to initiation of the study, ethical approval was obtained from the Research Ethics Committee of Uppsala University.
Instruments
We adopted a client-centred perspective (3, 9) in this study and were interested in the participants’ perceived everyday life situations, and thus we used self-reported assessments of occupational gaps, life satisfaction, and depressive mood in the survey.
Occupational Gaps Questionnaire (OGQ). The OGQ was operationalized and developed for the survey (7) and is considered to measure to what extent an individual does/does not what he or she wants to/wants not to do. The presence of occupational gaps was examined for 28 activities, including 8 instrumental ADL, 6 social activities, 10 leisure activities and 4 work-related activities, as shown in Table II. The selection of activities was based on the Interest Checklist and the Role Checklist (22) and a Swedish version of an activity profile based on work by Baum (23).
| Table II. Activities examined in the Occupational Gaps Questionnaire and the questions posed in connection with each activity |
| Instrumental ADL |
| Shopping |
| Cooking |
| Washing clothes |
| Cleaning |
| Performing light maintenance (of home, garden, or car) |
| Performing heavy-duty maintenance |
| Managing personal finances |
| Transportation (e.g. driving, public transport) |
| Social activities |
| Seeing partner and children |
| Seeing relatives, friends & neighbours |
| Engaging in activities in societies, clubs or unions |
| Participating in religious activities |
| Visiting restaurants & bars |
| Travelling for pleasure |
| Leisure activities |
| Sports |
| Outdoor life |
| Hobbies |
| Cultural activities |
| TV/video/radio |
| Reading newspaper |
| Reading periodicals/literature |
| Writing |
| Playing games, or playing the lottery, crosswords, etc. |
| Playing computer games & surfing the internet |
| Work or work-related activities |
| Working, full- or part-time |
| Studying, full- or part-time |
| Taking care of and raising children |
| Performing voluntary work |
| Question 1: Do you perform the activity now? | Yes □ | No □ |
| Question 2: Do you want to perform the activity now? | Yes □ | No □ |
| ADL: activities of daily living. |
For the purpose of this study, we used the 2 questions concerning the situation after brain injury. The questions were “Do you perform the activity now?” and “Do you want to perform the activity now?” and it was made clear that the questions referred to their everyday occupations after the brain injury, but no other time frame was given. The participants were not asked whether their occupational gaps were related to the ABI.
When analysing the presence of occupational gaps after brain injury, answering “yes” to one question and “no” to the other was considered to constitute an occupational gap. Based on the potential combination of responses from the questions in the OGQ presented above, a dichotomous scale was constructed. The first level (0), corresponded to a situation in which there was no occupational gap, that is the participants did the activities that they wanted to do, or did not do the activities that they did not want to do. The other level (1) corresponded to the presence of an occupational gap, when the participants did activities that they did not want to do, or when the participants did not do the activities that they wanted to do (see Table III for further information.) The raw score responses obtained from OGQ were Rasch analysed.
| Table III. Data analysis of the Occupational Gaps Questionnaire |
| No occupational gaps present (0) | |
| Question 1: Yes | Question 2: Yes |
| Question 1: No | Question 2: No |
| Presence of occupational gap (1) | |
| Question 1: Yes | Question 2: No |
| Question 1: No | Question 2: Yes |
LiSat-11 checklist. An individual’s perception of life satisfaction is seen to reflect the extent to which the individual achieves his or her vital goals (1). This operationalization constitutes the basis for the development of an instrument measuring life satisfaction, the LiSat-11, used in this study. The LiSat-11 checklist has been used for a number of populations in Scandinavia (17) and the checklist has been shown to have an acceptable test-retest reliability, specificity, and sensitivity (17). The LiSat-11 comprises 11 items assessing overall and domain-specific life satisfaction. The domains addressed are the vocational, financial, and leisure situations, social contacts, sexual and family life, self-care, partner relationship and physical and psychological health. The instrument uses a 6-step ordinal self-rating scale ranging from 6 = “very satisfying” to 1 = “very dissatisfying”. The scores on the LiSat-11 are commonly dichotomized into satisfying and very satisfying and rather satisfying to very dissatisfying, which is known to be a valid scale reduction (16). In the results section we present the participants’ ratings on LiSat-11 dichotomized in order to compare the level of life satisfaction in the study sample with other samples. The raw scores from LiSat-11 were also Rasch-analysed before further analyses.
Hospital Anxiety and Depression Scale (HADS). The presence of depressive mood was estimated by use of the HADS, which comprises 14 questions, of which 7 are intended to screen for depressive symptoms. These 7 questions were used in this study. The depression scale ranges from 0 to 21, with a cut-off score of above 10 indicating a depressed state (24). Each participant’s total score on the HADS was dichotomized according to this, and thus the participants in this study were regarded as depressed if they scored 11 points or more on the HADS. The questionnaire has proved to be reliable, valid, sensitive and specific when used in various populations, including individuals who had ABI (25). The results of the screening on the HADS are in good agreement with the results of a psychiatric interview according to DSM-III (25) even if the cut-off in itself is not sufficient indication for treatment. The ratings on the HADS were used dichotomized in the regression analyses, according to studies on the validity of the instrument by Bjelland et al. (25).
Data analysis
Rasch models are increasingly used in rehabilitation medicine for developing and evaluating the psychometric properties of new and existing assessments (26). They are also used to examine whether items from tests or questionnaires measure unidimensional constructs (26). Rasch computer programs are used to convert the raw item scores from a test or questionnaire into equal-interval measures commonly referred to as logits (log-odds probability units) (26), by using probabilistic transformation techniques. Such transformation techniques have been presented in greater detail elsewhere (27, 28). In order to ensure that we could use the data from Lisat-11 and OGQ as valid measures in the further linear regression analyses, we initially evaluated the raw score responses collected from the participants using 2 different Rasch measurement models (1 for the LiSat-11 and 1 for OGQ) with a computer application of Rasch analysis, the WINSTEPS software program, version 3.59.1 (29).
In order to estimate whether the measures generated from OGQ and LiSat-11 demonstrated acceptable levels of validity, we used the following criteria:
• All items in the OGQ and LiSat-11 should demonstrate acceptable goodness-of-fit to the Rasch model, as indicated by mean square (MnSq) values equal or less than 1.4 with a corresponding z less than 2.0 (30–32) supporting internal scale validity.
• In the sample, 95% should demonstrate acceptable goodness-of-fit to the Rasch model, similarly indicated by individual mean square (MnSq) values equal to or less than 1.4 with a corresponding z less than 2.0 (26), thus supporting person-response validity.
• The measures derived from the OGQ and LiSat-11 should explain more than 60% of the total variance in the data-sets (33), estimated by performing principal component analyses of the residuals, further supporting unidimensionality.
• The OGQ and LiSat-11 must at least detect 2 distinct groups in the data-sets, supporting sensitivity in the derived measures among the subjects evaluated (34).
If those criteria were met, we concluded that the measures could be used as valid estimations of occupational gaps and life satisfaction, respectively.
Univariate regression analyses were then used to guide the choice of which variables should be included in the linear multiple regression analyses, with the intention of exploring their influence on life satisfaction. On the basis of the results of the univariate analyses (see Table IV, left-hand column), the variables that were significantly associated with life satisfaction (p < 0.05) were selected as independent variables in a linear multiple regression analysis. The independent variables were: (i) occupational gaps; (ii) injury severity, i.e. RLS ratings; (iii) the presence of depressive mood; (iv) the diagnosis; (v) gender; and, from the demographic data, whether the participants (vi) had worked/studied after being afflicted with the brain injury; and (vii) whether they were born in Sweden. Variable (i), occupational gaps, was treated as linear, while the other 5 variables (ii–vii), were all dichotomized. The dependent variable in the multivariate analyses was life satisfaction. Age was not included in the first multiple regression analysis because no significant associations were found between age and life satisfaction in the univariate regression analyses (see Table IV). However, the variable was included in the second multiple regression analysis to check the extent to which it had an impact on life satisfaction. Other non-significant correlates were time elapsed since injury and whether the participants had a partner. The factors having no partner and being a first-generation immigrant have been shown to be of importance for the perception of life satisfaction for a Swedish representative sample (17). In this sample only the factor being born in Sweden had a significant relationship with life satisfaction in the univariate regression analyses.
| Table IV. Results of regression analyses performed with measure of life satisfaction as dependent variable (n = 116) |
| Independent variables | Univariate analyses | Multivariate analyses* | Multivariate analyses Final model |
| Measure of occupational gaps |
| p | < 0.001 | < 0.001 | < 0.001 |
| b | –0.32 | –0.21 | –0.21 |
| 95% CI | –0.24 to –0.40 | –0.12 to –0.30 | –0.12 to –0.31 |
| Depression | | | |
| p | < 0.001 | 0.005 | 0.006 |
| b | 0.94 | 0.51 | 0.51 |
| 95% CI | 0.59–1.29 | 0.16–0.86 | 0.16–0.86 |
| Diagnosis | | | |
| p | 0.026 | 0.156 | 0.162 |
| b | –0.32 | –0.19 | –0.21 |
| 95% CI | –0.04 to –0.60 | –0.42–0.04 | –0.49–0.08 |
| Injury severity (RLS – dichotomized RLS 1 vs RLS 2–8) |
| p | 0.128 | 0.902 | 0.905 |
| b | –0.27 | –0.01 | –0.01 |
| 95% CI | –0.62–0.08 | –0.25–0.22 | –0.43–0.40 |
| Working or studying, or not |
| p | < 0.001 | 0.187 | 0.243 |
| b | 0.51 | 0.17 | 0.16 |
| 95% CI | 0.25–0.78 | 0.08–0.41 | –0.10–0.41 |
| Having been born in Sweden, or not |
| p | < 0.001 | 0.188 | 0.221 |
| b | 0.70 | 0.24 | 0.23 |
| 95% CI | 0.30–1.10 | 0.12–0.60 | –0.14–0.60 |
| Gender | | | |
| p | 0.005 | 0.180 | 0.181 |
| b | 0.30 | 0.17 | 0.17 |
| 95% CI | 0.03–0.58 | –0.08–0.41 | –0.08–0.41 |
| Age | | | |
| p | 0.542 | na | 0.808 |
| b | 0.003 | | –0.001 |
| 95% CI | –0.008–0.01 | | –0.006–0.009 |
| *Age not included. na: not applicable; CI: confidence interval; RLS: Reaction Level Scale; RLS 1: alert; RLS 2–3: drowsy, or very drowsy or confused; RLS 4–8: unconscious localizes or does not localize pain.. |
A multivariate regression analysis including all earlier identified significant independent variables was then performed. A normal probability plot was used for visual inspection if data fulfilled the criteria for model assumption. The confidence limits were set at 95%. All statistical analyses were 2-sided and the significance level was set at p < 0.05. The independent variables that did not contribute significantly to the model were eliminated.
Finally, since the independent variables may also have relationships with an impact on the linear regression model, correlation analyses between the independent variables were also conducted. Two significant relationships were found between the independent variables; these were the measure of occupational gaps and depressive mood (p < 0.001) and the measure of occupational gaps and whether the participants had worked/studied since their brain injury had occurred (p < 0.001). With the intention of evaluating the extent to which these relationships had an impact on the regression model, a separate regression analysis was finally performed in which the interaction variables (measure of occupational gaps*depressive mood and measure of occupational gaps*work/studies) were included.
Statistica (StatSoft Inc.) (version 7.0) software was used to perform the regression analyses.
RESULTS
The 116 participants in the study sample were in the age range 20–65 years at the time of the survey. Their mean age was 46 (standard deviation (SD) 12.5) years. Thirty-nine percent had a TBI and 61% a SAH. Fifty-two percent of the participants were men. The mean time lapse since the brain injury was 26 months (range 11–47, SD = 10.4, months) for the SAH group, and the mean time lapse was 24 months (range 11–43, SD = 9.9, months) for the TBI group. In the total sample of 187 persons, 61% had had an SAH, 49% were men, the mean age was 47 years, and the mean time lapse since injury was 26 months (range 11–47 months). Injury severity in the total sample (n = 187) was also approximately the same as in the study sample (RLS 1 50%; RLS 2–3 34%; RLS 4–8 16%).
The participants’ ratings on LiSat-11, i.e. their perceived life satisfaction, are presented in Table V.
| Table V. Self-reported levels of life satisfaction using the LiSat-11 checklist (n = 116) |
| Variables | Very satisfying to satisfying (5–6) | Rather satisfying to very dissatisfying (1–4) | Missing, n |
| n | % | n | % |
| Life as a whole | 41 | 35 | 75 | 65 | |
| Vocation | 26 | 22 | 90 | 78 | |
| Economy | 30 | 26 | 86 | 74 | |
| Leisure | 35 | 30 | 80 | 69 | 1 |
| Contacts | 49 | 42 | 67 | 58 | |
| Sexual life | 28 | 24 | 77 | 66 | 11 |
| ADL | 73 | 63 | 43 | 37 | |
| Family life | 61 | 53 | 37 | 32 | 18 |
| Partner relationship | 58 | 50 | 27 | 23 | 31 |
| Somatic health | 34 | 29 | 82 | 71 | |
| Psychological health | 33 | 28 | 83 | 72 | |
| ADL: activities of daily living. |
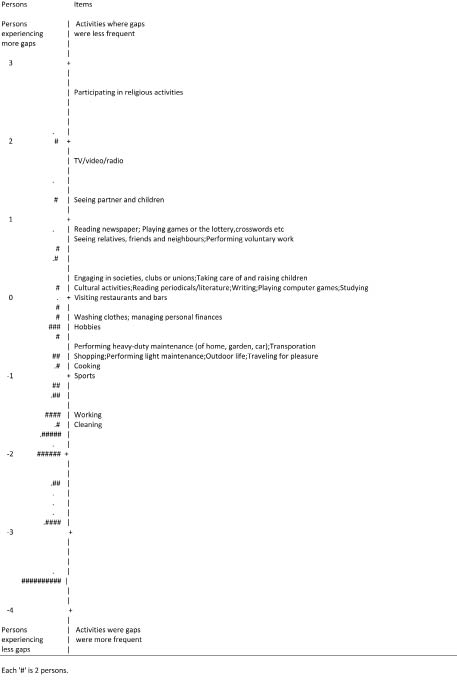
The mean value for the persons in the sample on measure of life satisfaction obtained from LiSat-11 was –0.19 logits and the measures ranged from –2.2 to 2.15 logits (SD = 0.77). The mean value for the persons in the sample for the measure of occupational gaps obtained from OGQ was –1.64 logits and the measures ranged from –3.63 to 2.08 logits (SD = 1.44). Distribution of items and persons on the measure of occupational gaps is shown in Fig. 1. The measure of life satisfaction followed an approximately normal distribution, whereas the distribution of the measure of occupational gaps demonstrated a clear ceiling effect (see Fig. 1) in the sample.
Fig. 1. Distribution of measure of occupational gaps.
Initial Rasch analysis of data from the OGQ revealed that all 28 items demonstrated acceptable goodness-of-fit to the Rasch model, supporting internal scale validity. All 116 subjects also demonstrated acceptable goodness-of-fit in their responses, supporting further person-response validity. Furthermore, the OGQ could separate the sample into 2 distinct groups, corresponding to a person separation index of 1.82 and a person reliability index of 0.77. The item separation index was calculated as 2.88, indicating that there were 3 distinct groups of item challenge in OGQ. Finally, a principal component analysis of the residuals revealed that the OGQ measures explained 56% of the variance in the data-set, which was close to but less than the criterion set at 60%. However, since no additional factor explained more than 5% of the variance in the data-set, we concluded that the measures derived from the Rasch analysis could still be used as valid estimations of occupational gaps in this sample.
In a similar manner, the Rasch analysis of data from LiSat-11 revealed that all 11 items demonstrated acceptable goodness-of-fit to the Rasch model, supporting internal scale validity. All but 4 subjects (97%) in this sample also demonstrated acceptable goodness-of-fit in their responses. Furthermore, the LiSat-11 could also separate this sample into 3 distinct groups, corresponding to a person separation index of 2.13 and a person reliability index of 0.82. The item separation index was calculated as 4.46. Finally, the principal component analysis of the residuals revealed that the Lisat-11 measures explained 70% of the variance in the data-set, further supporting unidimensionality in the data-set. Hence, we also concluded that the measures derived from the LiSat-11 could be used as valid estimations of life satisfaction, and could be used in conjunction with the measures from OGQ for further statistical analyses.
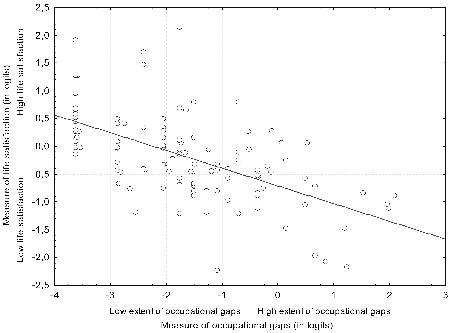
Since the measure of occupational gaps did not follow a normal distribution (see Fig. 1), we chose a more conservative approach to our analyses of correlations, using non-parametric statistics (Spearman’s ρ). There was a significant correlation between measures of occupational gaps and life satisfaction (r = –0.63; p < 0.001) (see Fig. 2). There was a significant difference between those subjects who were depressed (14% in the sample) and those who were not in measure of life satisfaction, as calculated using a t-test for independent samples (t = 5.22; p = < 0. 001)Multivariate analysis suggested that the extent of occupational gaps (p < 0.001; b = –0.21) and the presence of depressive mood (p = 0.006; b =0.51) were the most influential variables in predicting life satisfaction, as demonstrated in the right-hand column (final model) in Table IV. Thus, a low extent of occupational gaps, represented by a low (negative) measure for occupational gaps, was significantly related to a higher measure of life satisfaction. The absence of depressive mood also contributed significantly to greater life satisfaction.
Fig. 2. The association between the measures of occupational gaps and life satisfaction (r = –0.63; p = < 0.001).
The final regression model, which included age, explained 40% (r2 adjusted) of the total variance in life satisfaction. In this model, the measure of occupational gaps alone explained 32% of the total variance in life satisfaction; presence of depressive mood explained 6% and the diagnosis explained an additional 2%. The participants with SAH perceived significantly higher (p = 0.026) life satisfaction than those with TBI.
The univariate regression analyses of the interaction variables indicated that there was a significant (p = < 0.001) interaction effect between being depressed and perceiving occupational gaps (r2 = 0.35; b = –0.32), as well as between not working or studying since the brain injury occurred and experiencing occupational gaps (p = < 0.001; r2 = 0.17; b = –0.23) and the dependent variable life satisfaction. When the interaction variables were included in the regression model it still explained 41% of the variance in life satisfaction.
DISCUSSION
This study shows that occupational gaps have a strong relationship with life satisfaction, even years after acquiring a brain injury. Thus, the theoretical assumption previously suggested in the literature, that there is a relationship between participation in desired everyday occupations and perceived life satisfaction (1, 3), has now been confirmed empirically for individuals with brain injuries (SAH, TBI) in Sweden. The confirmation of the relationship (b = –0.21; p < 0.001) between gaps in desired everyday occupations and life satisfaction is important, even if it might not be unexpected. This relationship might imply that persons who feel that they are doing what they want and need to do in everyday life are more satisfied with life than those who are not, which is in line with the theoretical foundations of occupational therapy (3). The current study sample seemed representative with regard to demographic characteristics (Table I), which were in accordance with previously reported data on the TBI (35) and SAH (36) populations.
Depressive mood was also found to have a definite relationship with life satisfaction, as expected from previous research (11, 13). The relationship with depressive mood was, however, less strong than the relationship with occupational gaps. More research is needed to examine this relationship and how the presence of occupational gaps and depression are interrelated. Our data do not clarify whether depressive mood is secondary to a reduced ability to initiate and participate in desired occupations due to the injury, or if not participating in everyday occupations might cause a depression (37). It should be pointed out that the prevalence of depressive mood was quite low compared with the prevalence reported in other samples of brain-injured individuals (16) and conclusions must be cautious. Overall, the literature on depression after haemorrhagic stroke is sparse (38) and the correlation between TBI and depression is complex. A recent study, comparing patients with mild and moderate to severe TBI as well as patients with orthopaedic injury, indicated that neither brain injury severity, nor type of injury was associated with depression after the injury (39). However, patients’ self-assessment of their impairment exhibited a strong such association (39). Our data indicate that in order to determine the impact of occupational gaps at the level of life satisfaction, longitudinal studies, controlling for depression, are needed.
The perceived life satisfaction of the participants in this investigation was consistent with other samples, for both severely (10) and mildly brain-injured participants (14), except for the lower ratings on somatic and psychological health items revealed in the study sample (shown in Table IV). Only 35% of the participants reported themselves to be very satisfied or satisfied for the item “life as a whole”, compared with a sample that is representative of the Swedish population as a whole, for whom it was reported that 70% of individuals were satisfied or very satisfied with their lives (17). In the Swedish representative sample it was found that some of the domains to a higher extent predicted the overall life satisfaction, e.g. the domains psychological health, partner relationship, vocational situation, leisure and family life (17). In this study there were low ratings (≥ 58% rated 1–4) on the satisfaction with the domains vocation, economy, leisure, contacts, sexual life and the 2 health domains as shown in Table V. More than 70% reported low satisfaction with the health domains and with vocation, which could be considered as a high percentage, given that almost half of the sample had returned to work. In contrast with other domains the participants were quite satisfied with partnership and family life. However, this result might have been influenced by the fact there were some missing data on these questions.
Instruments
The 2 instruments used in this study, the LiSat-11 and the OGQ, have different foci. The LiSat-11 assesses whether people are satisfied within life domains such as ADL, work, leisure, etc., whereas the OGQ also addresses these areas, but in addition asks if the person is doing what he or she wants to do. The OGQ has an explicit focus on the aspect of performance, while the LiSat-11 focuses on satisfaction with a specific life domain or with life as a whole, despite the level of performing activities within these life domains. The OGQ exhibited a ceiling effect where the survey sample was reduced by the participants who did not report any occupational gaps and by those who had missing data in the OGQ in the survey questionnaire. Twenty-one persons (18%) in the remaining study sample reported only one gap. The OGQ was in this sample only able to differentiate 2 subgroups, as indicated by a person separation index of 1.82. This implies that there is a need for further development of the OGQ specifically addressing the sensitivity of the tool. This might be achieved by developing more challenging items for use in higher functioning samples, e.g. occupations that are complex and demand high executive functioning (7). The OGQ has not yet been used in healthy people, but it is planned within the research project to conduct a study on a sample representative of the Swedish population.
Limitations
As discussed elsewhere (7), it might be difficult to capture brain-injured individuals’ perceptions in a reliable way using postal questionnaires. Despite this, we chose to use this form of data collection, because of the geographical spread of the quite large sample throughout Sweden. We do not know the prevalence of a lack of self-awareness in the sample of people that participated. However, it is possible that a lack of self-awareness might have influenced how the participants perceived the consequences their injuries had had on their competence in everyday activities and, furthermore, on their perception of their life satisfaction (40).
Implications
It has been suggested that the overall goal for rehabilitation in Sweden should be to secure life satisfaction for clients and those close to them (1). According to that goal, our results emphasize the importance of a client-centred approach and a more pronounced focus on the clients’ participation in desired everyday occupations. If rehabilitation is to succeed in achieving the goal of securing the clients’ life satisfaction, interventions need to concentrate on narrowing the gap between what individuals want and need to do and what they actually do subsequent to an illness or injury. Previous studies on persons who have experienced stroke provided evidence that participating in everyday occupations contribute to adaptation in everyday occupations (41). Providing clients with opportunities to experience the performance of everyday occupations, and thereby develop and sustain competence, are, therefore, significant interventions in the rehabilitation process that are beneficial for both adaptation and life satisfaction.
The OGQ has been shown to be sensitive enough to capture occupational gaps in this sample of people with brain injuries, when used as a postal questionnaire. It has not yet been used in clinical practice as a tool for gathering information to provide a basis for rehabilitation interventions. The clinical relevance of the questionnaire seems obvious, but its applicability needs to be tested further. Such testing would include several diagnostic groups experiencing a range of disabilities. There is also a need for the instrument to be tested further and to establish the sensitivity for change, the reliability, and the validity of the questionnaire for a more heterogeneous sample. Further research is also needed to clarify the relationship between participation in desired everyday occupations and perceived life satisfaction in other cultures and in samples that perceive other disabilities or illnesses.
ACKNOWLEDGEMENTS
We would like to thank Ingeborg Nilsson, PhD, OT, Department of Community Medicine and Rehabilitation, Umeå University, Sweden for assistance with Rasch analysis of Lisat-11.
This study was supported by the Swedish Research Council, Centre of Health Care Sciences, Karolinska Institutet, Stockholm, and by the R&D group of Uppsala County Council, Uppsala, Sweden.
REFERENCES
1. Fugl-Meyer AR, Bränholm I-B, Fugl-Meyer KS. Happiness and domain-specific life satisfaction in adult northern Swedes. Clin Rehabil 1991; 5: 25–33.
2. Becker G. Continuity after stroke: implications of life-course disruption in old age. Gerontologist 1993; 33: 148–158.
3. Kielhofner G, editor. Model of human occupation, 3rd edn. Baltimore: Lippincott Williams & Wilkins; 2002.
4. Malec J, Basford J. Postacute brain injury rehabilitation. Arch Phys Med Rehabil 1996; 77: 198–207.
5. Hoofien D, Gilboa A, Vakil E, Donovick P. Traumatic brain injury (TBI) 10–20 years later: a comprehensive outcome study of psychiatric symptomatology, cognitive abilities and psychosocial functioning. Brain Inj 2001; 15: 189–209.
6. Atchley RC, editor. Continuity and adaptation in aging. Creating positive experiences. Baltimore: The Johns Hopkins University Press; 1999.
7. Eriksson G, Tham K, Borg J. Occupational gaps in everyday life 1–4 years after acquired brain injury. J Rehabil Med 2006; 38: 159–165.
8. World Health Organization. International Classification of functioning, disability and health, ICF. Geneva: World Health Organization; 2001.
9. Townsend E, editor. Enabling occupation: an occupational therapy perspective. Ottawa, Ontario: CAOT Publications ACE; 2002.
10. Dijkers, M. Quality of life after traumatic brain injury: a review of research approaches and findings. Arch Phys Med Rehabil 2004; 85 Suppl 2: 21–35.
11. Johnston MV, Miklos CS. Activity-related quality of life in rehabilitation and traumatic brain injury. Arch Phys Med Rehabil 2002; 83 Suppl 2: 26–38.
12. Webb CR, Wrigley M, Yoels W, Fine P. Explaining quality of life for persons with traumatic brain injuries 2 years after injury. Arch Phys Med Rehabil 1998; 76: 1113–1119.
13. Underhill A, Lobello S, Stroud T, Terry K, Devivo M, Fine P. Depression and life satisfaction in patients with traumatic brain injury: a longitudinal study. Brain Inj 2003; 17: 973–982.
14. Carlsson G, Möller A, Blomstrand C. Consequences of mild stroke in persons < 75 years: a 1-year follow-up. Cerebrovasc Dis 2003; 16: 383–388.
15. Gordon WA, Hibbarb MR. Poststroke depression: an examination of the literature. Arch Phys Med Rehabil 1997; 78: 658–663.
16. Ownsworth T, Oei T. Depression after traumatic brain injury: conceptualization and treatment considerations. Brain Inj 1998; 12: 735–751.
17. Fugl-Meyer AR, Melin R, Fugl-Meyer KS. Life satisfaction in 18- to 64-year old Swedes: in relation to gender, age, partner and immigrant status. J Rehabil Med 2002; 34: 239–246.
18. Melin R, Fugl-Meyer K, Fugl-Meyer AR. Life satisfaction in 18- to 64-year-old Swedes: in relation to education, employment situation, health and physical activity. J Rehabil Med 2003; 35: 84–90.
19. Starmark JE, Stålhammar D, Holmgren E. The Reaction Level Scale (RLS 85) manual and guidelines. Acta Neurochir 1988; 91: 12–20.
20. Teasdale G, Jennet B. Assessment of coma and impaired consciousness. A practical scale. Lancet 1974; 13: 81–84.
21. Johnstone AJ, Lohlun JC, Miller JD, McIntosh CA, Gregori A, Brown R, et al. A comparison of the Glasgow Coma Scaleand the Swedish Reaction Level Scale. Brain Inj 1993; 7: 501–506.
22. Bränholm I-B, Fugl-Meyer AR. On non-work preferences: relationships with occupational roles. Disabil Rehabil 1994; 4: 205–216.
23. Baum CM. The effects of occupation on behaviours of persons with senile dementia of the Alzheimer’s type and their carers [dissertation]. St Louis: Washington University; 1993.
24. Bodlund O, Andersson SO, Mallon L. Effects on consulting psychiatrist in primary care. 1-year-follow-up of diagnosing and treating anxiety and depression. Scand J Prim Health Care 1999; 17: 153–157.
25. Bjelland I, Dahl AA, Tangen Haug T, Neckelmann D. The validity of the Hospital Anxiety and Depression Scale. An updated literature review. J Psychosom Res 2002; 52: 69–77.
26. Tesio L. Measuring behaviours and perceptions: Rasch analysis as a tool for rehabilitation research. J Rehabil Med 2003; 35: 105–115.
27. Wright BD, Stone MH. Best test design. Chicago: MESA Press; 1979.
28. Wright BD, Masters GN. Rating scale analysis. Chicago: MESA Press; 1982.
29. Linacre JM. WINSTEPS® Rasch measurement computer software, version 3.63.0. 2006. Available from: http: //www.winsteps.com
30. Wright BD, Linacre JM. Reasonable mean-square fit values. Rasch Measurement Transactions 1994; 8: 370.
31. Linacre JM. Optimizing rating scale category effectiveness. J Appl Meas 2002; 3: 85–106.
32. Wilson M, editor. Constructing measures: an item response modeling approach. Mahwah, NJ: Lawrence Erlbaum; 2005.
33. Linacre JM. A user’s guide to Winsteps® Ministep Rasch- model computer programs. 1991–2006. Available from: URL: http: //www.winsteps.com/aftp/winsteps.pdf
34. Fisher W Jr. Reliability statistics. Rasch Measurement Transactions 1992; 6: 238. Available from: URL: http//www.rasch.org/rmt/rmt63i.htm
35. Kleiven S, Peloso P, von Holst H. The epidemiology of head injuries in Sweden from 1987 to 2000. Inj Control Safety Promotion 2003; 10: 173–180.
36. Pakarinen S. Incidence, etiology and prognosis of primary subarachnoid hemorrhage. Acta Neurol Scand 1967; 43 Suppl 29: 1–128.
37. Wilcock A. An occupational perspective on health. Thorofare NJ: Slack Inc.; 1998.
38. Moncayo Gaete J, Bogousslavsky J. Post-stroke depression. Expert Rev Neurotherapeutics 2008; 8: 75–92.
39. Malec JF, Testa JA, Rush BK, Brown AW, Moesser AM. Self-assessment of impairment, impaired self-awareness, and depression after traumatic brain injury. J Head Trauma Rehabil 2007; 22: 156–166.
40. Prigatano G. Disturbances of self-awareness of deficit after traumatic brain injury. In: Prigatano G, Schacter D, editors. Awareness of deficit after brain injury. Clinical and theoretical issues. New York: Oxford Press Inc.; 1991, p. 11–126.
41. Tham K, Borell L, Gustavsson A. The discovery of disability: a phenomenological study of unilateral neglect. Am J Occup Ther 2000; 54: 398–406.