OBJECTIVE: To examine the association between frailty status and incidence of disability among non-disabled older Mexican Americans.
DESIGN: A 10-year prospective cohort study.
SUBJECTS: A total of 1645 non-institutionalized Mexican Americans aged 67 years and older from the Hispanic Established Population for the Epidemiological Study of the Elderly (H-EPESE), who reported no limitation in activities of daily living at baseline.
METHODS: Frailty was defined as meeting 3 or more of the following components: (i) unintentional weight loss of > 2.26 kg; (ii) weakness (lowest 20% in hand grip strength); (iii) self-reported exhaustion; (iv) slow walking speed; and (v) low physical activity level. Socio-demographic factors, Mini Mental State Examination, medical conditions, body mass index, and self-reported activities of daily living were obtained.
RESULTS: Of the 1645 non-disabled subjects at baseline, 820 (50%) were not frail, 749 (45.7%) were pre-frail, and 71 (4.3%) were frail. The hazard ratio of activities of daily living disability at 10-year follow-up for pre-frail subjects was 1.32 (95% confidence interval 1.10–1.58) and 2.42 (95% confidence interval 70–3.46) for frail subjects compared with not frail subjects. This association remained statistically significant after controlling for potential confounding factors at baseline.
CONCLUSION: Pre-frail and frail status in older Mexican Americans was associated with an increased risk of activities of daily living disability over a 10-year period among non-disabled subjects.
Key words: frail older adults, activities of daily living, disability, Mexican Americans.
J Rehabil Med 2009; 41: 892–897
Correspondence address: Soham Al Snih, Sealy Center on Aging, University of Texas Medical Branch. 301 University Blvd., Galveston, TX 77555-0460, USA. E-mail: soalsnih@utmb.edu
Submitted January 28, 2009; accepted May 27, 2009
INTRODUCTION
Frailty is a common condition in older persons. Frailty has been described as “a physiologic state of increased vulnerability to stressors that results from decreased physiologic reserves, and even dysregulation, of multiple physiologic systems”(1). The prevalence of frailty depends on the criteria used to define frailty (2–5). The prevalence increases with age, is higher in women, and is estimated to be higher among ethnic minorities (2–7). The American Medical Association estimated that approximately 40% of adults aged 80 years and older are frail (8).
Frailty is considered as a state of high vulnerability for adverse health outcomes, such as disability, falls, hospitalization, institutionalization, and mortality (9–14). There has been much definitional confusion between frailty and disability due to the similarity with disability in relation to associated outcomes and the frequency of co-occurrence of frailty and disability. However, researchers have demonstrated that the presence of frailty significantly predicts disability in older adults (2, 9, 10, 12). Fried and colleagues, using the Cardiovascular Health Study (2), showed that frail subjects were at high risk for decreased mobility and reduced activities of daily living (ADL). Similarly, findings from the Women’s Health and Aging Study-I and the Women’s Health Initiative Health Study showed that frailty was independently associated with new onset dependence in ADL (9, 10).
Older Mexican Americans are characterized by low income, few years of formal education, high rates of diabetes, obesity, disability, and low physical activity (15). They also have relatively low rates of health insurance coverage (15, 16). In earlier studies from the Hispanic Established Population for the Epidemiological Study of the Elderly (H-EPESE) survey, we demonstrated that arthritis, pain, diabetes, poor upper extremity muscle strength, weight loss of 5% or more, and poorer performance on an 8-foot (4.87 m) walk test were associated with incidence of disability (17–22). Given the rapid growth of this segment of the population in the USA, it is important to understand the relationship between frailty and health outcomes, such as disability, which is directly associated with increased health costs and decreased quality of life. The purpose of this study was to examine the association between frailty and 10-year incidence of ADL disability among non-disabled older Mexican Americans at baseline. We hypothesized that frail subjects would be at higher risk for becoming ADL disabled over time, compared with persons identified as not frail.
METHODS
Sample and procedures
Data are from the H-EPESE, a longitudinal study of Mexican Americans aged 65 years and over, residing in Texas, New Mexico, Colorado, Arizona and California, USA. The sample characteristics have been described elsewhere (23, 24). The sampling procedure assured a sample generalizable to approximately 500,000 older Mexicans Americans living in the southwest. Five waves of data have been collected (1993–94, 1995–96, 1998–99, 2000–2001, and 2004–2005). The present study used data obtained at 2nd, 3rd, 4th, and 5th wave (1995–2005). Information from the baseline interview in the present study was not used since the Physical Activity Scale for the Elderly (PASE) scale (25), a component of the frailty index was not administered at baseline. Of the 3050 subjects interviewed at baseline (1993–94) 2438 subjects were re-interviewed in 1995–96 (2166 in person and 272 by proxy). Two hundred thirty-eight were confirmed dead through the National Death Index (NDI) and reports from relatives, 110 subjects refused to be re-interviewed, and 264 were lost to follow-up at the 2-year follow-up (2nd wave). For this study we excluded those subjects who were re-interviewed by proxy (n = 272) because they did not complete the PASE scale. Subjects who were confirmed dead by the 2-year follow-up were significantly more likely to be older, to be men, to have a lower Mini Mental State Examination instrument (MMSE) score, lower body mass index (BMI), poorer performance in hand grip strength and in the 8-foot walk test, and reported more hypertension, stroke, heart attack, diabetes, cancer, and hip fracture.
Of the 2166 subjects interviewed in person at the 2nd wave (hereafter referred as baseline), 521 were excluded: 219 subjects reported limitations in at least one of the 7 ADL (walking across a small room, bathing, grooming, dressing, eating, transferring from a bed to a chair, and using the toilet) (26) and 302 had missing information on hand grip muscle strength, 8-foot walk test, weight, height, the Center for Epidemiologic Studies Depression (CES-D) Scale (27), PASE scale or covariates. Of those with missing information for hand grip strength, 8 had surgery in the upper extremities and 69 refused to perform the task. Of those with missing information for the 8-foot walk test, 23 refused to perform the task and 175 for health reasons (too ill).
Proxy subjects (n = 272) were significantly more likely to be older, to have ever experienced heart attack, stroke, cancer, hip fracture, ADL disability, and to have a lower level of education. Subjects excluded due to missing values in any of the frailty index component or covariates and those who reported a limitation in at least one of the 7 ADL activities were significantly more likely to be older, to have ever experienced arthritis, diabetes, stroke, hip fracture, hypertension, and to have lower BMI, lower hand grip muscle strength, poorer performance in the 8-foot walk test, and low score in the MMSE (28).
The final sample consisted of 1645 subjects who were non-disabled and had complete information on frailty index components and covariates at baseline. At the end of the 10-year follow-up (2005/06), 871 were re-interviewed in person, 80 subjects refused to be re-interviewed, 125 subjects were lost to follow-up, and 569 subjects were confirmed dead through the NDI and reports from relatives. Subjects who died were more likely to be older, to be men, to have a lower MMSE score, lower BMI, lower physical activity, poorer performance in hand grip strength and in the 8-foot walk test, and reported more hypertension, stroke, diabetes, cancer, and hip fracture compared with those alive or those who lost to follow-up. Alive subjects and those who were lost to follow-up were more likely to be younger, to be female, to have high level of education, to have high MMSE scores, to have elevated BMI, to perform better in hand grip strength and in the 8-foot walk test, and reported less medical conditions compared with those who died. Subjects lost to follow-up had the highest physical activity level and were less frail.
Measures
Frailty definition. Frailty was assessed using a modified version of the construct described by Fried et al. (2). The original Frailty Index used the short version of the Minnesota Leisure Time Activity questionnaire to assess physical activity (29). We used the PASE (25). Also, we did not use the actual cut point scores developed by Fried et al. (2), since the sample in their original study was younger than our baseline sample and the BMI and height values used to adjust for hand grip strength and walk test were different in our Mexican American sample than in the predominantly Non-Hispanic white sample used in the original frailty study. The frailty index includes the following components:
• Shrinking. Weight loss was calculated as the difference between weight measured in 1993–94 and weight measured in 1995–96. Subjects with unintentional weight loss of more than 2.26 kg were categorized as positive for weight loss criterion (score = 1).
• Weakness. Grip strength was assessed using a hand-held dynamometer (Jaymar Hydraulic Dynamometer model #5030J1– JA Corp., Jackson MS, USA) and was measured in kg as described elsewhere (19, 30). The test was administered by a trained interviewer, and 2 trials were performed. The higher of the 2 hand grip scores was used for scoring purposes. Subjects who were unable to perform the grip strength test and those in the lowest 20% adjusted for BMI and stratified by gender (Table I) were categorized as positive for the weakness criterion (score = 1).
| Table I. Percent of individuals for each frailty index component among non-disabled older Mexican Americans at baseline (n = 1645) |
| Characteristics | n (%) |
| Shrinking Unintentional weight loss of > 2.26 kg | 283 (17.2) |
| Weakness Lowest 20% in grip strength (adjusted by gender and BMI, kg/m2) Men Strength ≤ 21 for BMI ≤ 24.2 Strength ≤ 24.5 for BMI 24.3–26.8 Strength ≤ 25.4 for BMI 26.9–29.5 Strength ≤ 25.5 for BMI > 29.5 Women Strength ≤ 13.5 kg for BMI ≤ 24.7 Strength ≤ 14.2 kg for BMI 24.8–28.3 Strength ≤ 15.0 kg for BMI 28.4–32.1 Strength ≤ 15.0 kg for BMI > 32.1 | 250 (15.2) |
| Exhaustion Self-report positive answer from either of 2 questions on CES-D Scale: I felt that everything I did was an effort, I could not get going | 165 (10.0) |
| Slowness Slowest 20% of walking time from 8-foot (4.87 m) walk test adjusted by gender and height (cm) Men Time ≥ 11.2 sec for height ≤ 167.6 cm Time ≥ 9.7 sec for height > 167.6 cm Women Time ≥ 12.0 sec for height ≤ 153.7 cm Time ≥ 11.2 sec for height > 153.7 cm | 325 (19.8) |
| Physical activity Lowest 20% of PASE Scale adjusted by gender Men ≤ 30 (range 0–342) Women ≤ 27.5 (range 0–306) | 159 (9.7) |
| BMI: body mass index; CES-D: Center for Epidemiologic Studies Depression; PASE: Physical Activity Scale for the Elderly. |
• Exhaustion: Two items from the CES-D scale were used to assess exhaustion (27). (1) “I felt that everything I did was an effort” and (2) “I could not get going”. The items asked, “How often in the last week did you feel this way?” 0 = rarely or none of the time (< 1 day), 1 = some or little of the time (1–2 days), 2 = a moderate amount of the time (3–4 days), or 3 = most of the time (5–7 days). Subjects answering 2 or 3 to either of these 2 items were categorized as positive for the exhaustion criterion (score = 1).
• Slowness. Assessed over a 8-foot timed walk test. Subjects were asked to walk “as fast as felt safe”. Height and gender adjusted time-points were used (gender-specific cut-off at median height) (Table I), with the slowest 20% and those unable to perform the test were categorized as positive for the slowness criterion (score = 1).
• Low physical activity. Assessed with the PASE scale (25). Subjects who scored in the lowest 20% of PASE distribution adjusted by gender (Table I) were categorized as positive for the criterion of low physical activity criterion (score = 1).
Subjects with 3 or more components present were considered frail. Subjects with one or 2 components were considered pre-frail and those with 0 components were considered not frail.
Functional disability. Functional disability was assessed by 7 items from a modified version of the Katz ADL scale. ADLs include walking across a small room, bathing, grooming, dressing, eating, transferring from a bed to a chair, and using the toilet. The original version of the Katz ADLs scale (31) was modified by removing continence, because incontinence may be present in individuals who otherwise display no disability; and by adding grooming and ability to walk across a small room (26). Test-retest reliability over the short-term has been found to be high (95–98%) (32), the 7-item scale in this study has a high internal reliability (alpha 0.90). Subjects were asked if they could perform the ADL activity without help, if they needed help, or if they were unable to perform the activity. For the analysis, ADL disability was dichotomized as no help needed vs needing help with or unable to perform one or more of the 7 ADL activities.
Covariates. Baseline sociodemographic variables included age, gender, marital status, and years of formal education. The presence of various medical conditions was assessed with a series of questions asking subjects if they had ever been told by a doctor that they had arthritis, diabetes, hypertension, heart attack, stroke, cancer or hip fracture. BMI was computed as weight in kg divided by height in meters squared. Anthropometric measurements were collected in the home using the methods and instructions similar to those employed in other EPESE studies. Height was measured using a tape placed against the wall and weight using a Metro 9800 measuring scale. Cognitive function was assessed with the MMSE (28, 33). Scores have a potential range of 0–30, with lower scores indicating poorer cognitive ability.
Outcome. Development of ADL disability was defined as onset of any ADL limitation (needing help with or unable to perform one or more of the 7 ADLs) at the 3-, 5-, or 10-year follow-up interview.
Statistical analysis
Chi square and analysis of variance (ANOVA) tests were used to examine the distribution of covariates for subjects by frailty status at baseline. Cox proportional hazard regressions were used to calculate the hazard ratio of incidence of any ADL disability at 3-, 5-, or 10-year follow-up interview as a function of frailty status at baseline controlling for medical conditions and sociodemographic variables. These analyses were restricted to those who were non-ADL disabled at baseline. Those subjects who died or were unable to be located were censored at the date of the last follow-up (last interview date for the 10-year follow-up). Two models were constructed to test the relationship between frailty status and 10-year incidence of ADL disability. Model 1 included age, gender, and frailty status. In Model 2, marital status, years of formal education, medical conditions, MMSE, and BMI were added along with the variables in Model 1. All analyses were performed using the SAS System for Windows, Version 9.1.3 (SAS Institute, Cary, NC, USA).
RESULTS
Table I shows the percent of individuals for each frailty index component among non-disabled Mexican Americans at baseline. Slowness in walking speed (19.8%), unintentional weight loss (17.2%), and weakness in hand grip muscle strength (15.2%), were the criteria most frequently contributing to frailty status.
Table II presents the descriptive characteristics of the sample by frailty status at baseline. Of the 1645 subjects, 820 (50%) were not frail, 749 (45.7%) were pre-frail, and 71 (4.3%) were frail. Frail subjects were significantly more likely to be older, to have lower level of education, low BMI, to perform less well in the walk and hand grip muscle strength test, to have lower scores on the MMSE, and low physical activity compared with pre-frail subjects or not frail subjects. Also, frail subjects were significantly more likely to report exhaustion, hypertension, heart attack, stroke or cancer compared with pre-frail subjects or not frail subjects.
| Table II. Characteristics of the sample according to frailty status among non-activities of daily living disabled older Mexican Americans at baseline (n = 1645) |
| Predictor variables | Not frail | Pre-frail | Frail |
| Total, n (%) | 822 (50.0) | 751 (45.7) | 72 (4.3) |
| Age, years, mean (SD)* | 73.4 (4.9) | 74.9 (5.9) | 78.9 (7.2) |
| Gender, female, n (%) | 485 (59.0) | 430 (57.3) | 34 (47.2) |
| Education, years, mean (SD)* | 5.5 (4.1) | 4.7 (3.8) | 3.8 (3.3) |
| Marital status, married, n (%) | 445 (54.1) | 424 (56.5) | 33 (45.8) |
| Weight, kg, mean (SD)† | 72.7 (13.4) | 70.8 (14.9) | 72.9 (13.4) |
| Height, cm, mean (SD) | 63.2 (3.8) | 63.1 (3.9) | 62.6 (4.3) |
| BMI, kg/m2, mean (SD)† | 28.5 (4.9) | 27.7 (5.0) | 26.8 (5.1) |
| Hand grip strength, kg, mean (SD)* Male Female | 34.5 (5.7) 21.7 (4.2) | 29.8 (7.6) 18.4 (5.2) | 21.2 (5.7) 11.3 (4.8) |
| 8-foot (4.87 m) walk test, sec, mean (SD)* | 7.1 (1.9) | 10.5 (7.1) | 16.9 (10.9) |
| PASE, mean (SD)* | 118.4 (58.2) | 93.4 (58.2) | 31.5 (41.2) |
| Exhaustion, n (%)* | 0 (0) | 141 (18.8) | 24 (33.3) |
| Arthritis, n (%)‡ | 335 (40.8) | 339 (45.1) | 38 (52.8) |
| Hypertension, n (%)‡ | 345 (42.0) | 350 (46.6) | 42 (58.3) |
| Heart attack, n (%)* | 48 (5.8) | 79 (10.5) | 13 (18.1) |
| Stroke, n (%)† | 35 (4.3) | 51 (6.8) | 10 (13.9) |
| Cancer, n (%)† | 39 (4.7) | 53 (7.1) | 11 (15.3) |
| Hip fracture, n (%) | 4 (0.5) | 7 (1.0) | 3 (4.2) |
| Diabetes, n (%) | 198 (24.1) | 210 (28.0) | 23 (31.9) |
| MMSE score, mean (SD)* | 25.0 (3.9) | 24.1 (3.9) | 21.8 (4.8) |
| *p-value < 0.0001 †p-value < 0.001 ‡p-value < 0.01 when comparing Not-frail group with Pre-frail and frail groups. BMI: body mass index; MMSE: Mini Mental State Examination; PASE: Physical Activity Scale for the Elderly; SD: standard deviation. |
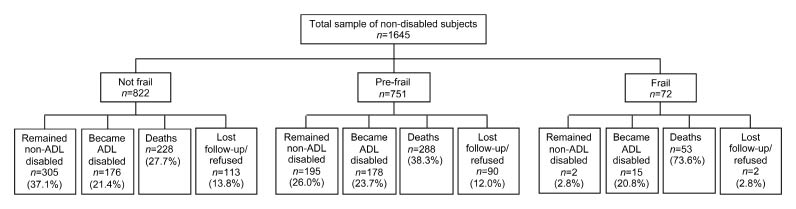
Fig. 1 shows the distribution of the sample at follow-up by frailty status at baseline. Of the 822 subjects who were not frail, 305 (37.1%) remained non-disabled, 176 (21.4%) became ADL disabled, 228 (27.7%) died, and 113 (13.8%) were lost to follow-up/or refused to be re-interviewed. Of the 751 subjects who were pre-frail, 195 (26.0%) remained non-disabled, 178 (23.7%) became ADL disabled, 288 (38.3%) died, and 90 (12.0%) were lost to follow-up/or refused to be re-interviewed. Of the 72 subjects who were frail, 2 (2.8%) remained non-disabled, 15 (20.8%) became ADL disabled, 53 (73.6%) died, and 2 (2.8%) were lost to follow-up/or refused to be re-interviewed.
Fig. 1. Distribution of the sample at follow-up by frailty status at baseline (n = 1645). ADL: activities of daily living.
Table III presents the results of Cox proportional hazard analysis of 10-year incidence of ADL disability as a function of frailty at baseline. In Model 1, the hazard ratio (HR) of becoming ADL disabled over time was 1.32 (95% confidence interval (CI) 1.10–1.58) for pre-frail subjects and 2.42 (95% CI 1.70–3.46) for frail subjects after controlling for age and gender compared with not frail subjects. In Model 2, the HR of becoming ADL disabled after controlling for age, gender, marital status, education, medical conditions, MMSE, and BMI was 1.26 (95% CI 1.05–1.52) for pre-frail subjects and 2.03 (95% CI 1.40–2.94) for frail subjects compared with not frail subjects. Similar findings were obtained when disability threshold was set at 2 or more and 3 or more limitations in ADLs. Other factors such as older age, female gender, arthritis, and diabetes were also associated with an increased risk of incidence of ADL disability.
| Table III. Cox proportional hazard models predicting 10-year incidence of activities of daily living disability among non-disabled older Mexican Americans as a function of frailty status at baseline (n = 1645) |
| Explanatory variables | Model 1 HR (95% CI) | Model 2 HR (95% CI) |
| Frailty index Not frail Pre-frail Frail | 1.00 1.32 (1.10–1.58) 2.42 (1.70–3.46) | 1.00 1.26 (1.05–1.52) 2.03 (1.40–2.94) |
| Age, years | 1.02 (1.01–1.04) | 1.02 (1.01–1.04) |
| Gender, female | 1.55 (1.29–1.87) | 1.39 (1.13–1.70) |
| Education, years | | 0.99 (0.97–1.02) |
| Marital status, married | | 0.88 (0.72–1.06) |
| Arthritis | | 1.32 (1.10–1.57) |
| Hypertension | | 0.95 (0.79–1.14) |
| Heart attack | | 1.01 (0.74–1.37) |
| Stroke | | 1.20 (0.86–1.69) |
| Cancer | | 1.05 (0.76–1.47) |
| Hip fracture | | 1.11 (0.49–2.52) |
| Diabetes | | 1.54 (1.28–1.86) |
| MMSE | | 0.99 (0.97–1.01) |
| BMI, kg/m2 | | 1.01 (0.99–1.03) |
| BMI: body mass index; CI: confidence interval; HR: Hazard Ratio; MMSE: Mini Mental State Examination. |
DISCUSSION
The present study examined the relationship between frailty and ADL disability. Frailty, as defined by a validated phenotype, was strongly and independently associated with subsequent ADL disability over a 10-year period among non-disabled older Mexican Americans, after controlling for age, gender, education, marital status, medical conditions, MMSE, and BMI. Frail subjects were twice as likely to report an ADL limitation over time compared with not frail subjects. Pre-frail status was also associated with an increased risk of ADL disability over time.
The results of this study are consistent with earlier findings on the association between frailty and risk of disability in primarily Non-Hispanic populations (2, 9, 10, 12). Fried and colleagues (2) showed that frailty measured at baseline was associated with an increased risk of worsening ADL disability over a period of 7 years among Non-Hispanic Whites and also an increased risk of worsening ADL disability among African Americans over a period of 3 years. Our findings are similar to this report; however our study included non-disabled subjects at baseline and a longer follow-up (10 years). In another study Woods and colleagues (10), using the Women’s Health Initiative Observational Study, found that frail women were 3 times as likely to report an ADL limitation among non-disabled women at baseline over a period of 6 years. Boyd and colleagues (9) using the Women’s Health and Aging Study-I, a population moderately disabled showed that frail women were twice as likely to develop a new onset dependency in ADL.
This study has some limitations. First, the assessment of ADL was by self-report. However, several studies have demonstrated a high concordance between self-reported data and direct observations of ADL performance (34). Secondly, we were limited to self-report of medical conditions, although previous research has reported good validity for self-reported medical conditions confirmed by physician diagnosis (35). Thirdly, subjects who died before the 2nd wave (1995–96) may have created a survival bias. Fourthly, subjects excluded from the analyses were less healthy than the ones included, and this may have introduced a bias. Fifthly, we could not examine frailty status as time dependent covariate because the PASE scale was administered only at baseline. Despite these limitations, our study has several strengths including its large sample of men and women living in the community, its prospective design, the ability to examine various medical conditions and factors previously reported as being associated with disability, and length and completeness of follow-up.
In conclusion, frailty was associated with an increased risk for incidence of ADL disability over a 10-year period among non-disabled older Mexican Americans. This study provides evidence that frailty is not synonymous with disability and that the assessment of frailty status may be helpful in identifying those older adult most at risk for future disability and who may be the best candidates for prevention and intervention programs.
ACKNOWLEDGEMENTS
This study was supported by grants, AG10939 and AG17638, from the National Institute on Aging, US, and in part by the UTMB Center for Population Health and Health Disparities 1P50CA105631-02. Dr Al Snih is supported by a research career development award (K12HD052023: Building Interdisciplinary Research Careers in Women’s Health Program – BIRCWH) from the Eunice Kennedy Shriver National Institute of Child Health & Human Development (NICHD); the National Institute of Allergy and Infectious Diseases (NIAID); and the Office of the Director (OD), National Institutes of Health. The content is solely the responsibility of the author(s) and does not necessarily represent the official views of these Institutes or the National Institutes of Health. Dr Samper-Ternent is supported by a fellowship from the National Institute on Disability and Rehabilitation Research (H133P040003).
REFERENCES