OBJECTIVE: To describe the long-term course of depressive symptoms up to 3 years post-stroke and to develop a prediction model for depressive symptoms 1 and 3 years post-stroke.
DESIGN: Longitudinal follow-up study.
Patients: Data were analysed for 131 patients with a first-ever supratentorial stroke admitted for inpatient rehabilitation in the Netherlands
METHODS: The Center for Epidemiologic Studies-Depression scale was used to assess post-stroke depressive symptoms at 6 months, 1 and 3 years post-stroke.
RESULTS: Post-stroke depressive symptoms were present 6 months, 1 year and 3 years post-stroke in 23.7%, 25.2% and 16.0% of the patients, respectively. At all 3 assessments post-stroke depressive symptoms were absent in 65.6% of the patients and present in 12.2% of the patients. Of the patients with post-stroke depressive symptoms 6 months post-stroke, 41.9% had recovered from post-stroke depressive symptoms 3 years post-stroke. The most important predictor of post-stroke depressive symptoms 1 and 3 years post-stroke was post-stroke depressive symptoms 6 months post-stroke (area under the curve 0.75 and 0.85). Male gender was an additional predictor for post-stroke depressive symptoms 3 years post-stroke.
CONCLUSION: Long-term post-stroke depressive symptoms are highly predictable at 6 months post-stroke. If a patient has not recovered from post-stroke depressive symptoms within the first 6 months post-stroke there is a high risk of chronic post-stroke depressive symptoms.
Key words: depression, stroke, prognosis, longitudinal studies.
J Rehabil Med 2009; 41: 930–935
Correspondence address: M. W. M. Post, Center of Excellence for Rehabilitation Medicine Utrecht, Rehabilitation Center De Hoogstraat, Rembrandtkade 10, NL–3583 TM Utrecht, The Netherlands. E-mail: m.post@dehoogstraat.nl
Submitted December 11, 2008; accepted June 17, 2009
INTRODUCTION
Depression is an important post-stroke sequela with negative impact on mortality, functional outcome and quality of life (1). Estimates of its prevalence vary considerably across studies because of differences in study populations, timing of measurements, assessment methods and study design (cross-sectional vs longitudinal). A systematic review (2) pooled data from observational studies published up to June 2004 and found that 33% of all patients after stroke experience significant depressive symptoms at some time after stroke onset. However, an evaluation of the individual course of post-stroke depression found much lower percentages: 2–17% of patients after stroke had persistent depressive symptoms throughout the first year post-stroke, and 50–80% of all patients after stroke with an early depression (between 0 and 3 months post-stroke) had recovered 1 year post-stroke (3–6).
There are only a few longitudinal studies (6–8) available describing the course of depression beyond 1 year post-stroke, and these have reported contradictory findings. A hospital-based study found a gradual decrease, from 43% at 6 months post-stroke to 18% at 3 years post-stroke (7). In contrast, another hospital-based study found a decrease from 31% to 16% in the first year and an increase during the second and third years, up to 29% (6). Likewise, a study in a rehabilitation population reported a decrease in depression from 30% to 17% in the first year post-stroke but an increase during the second year, to 23% (8). In studies by Åstrom et al. (6) and King et al. (8), patients with an early depression who recovered did so within the first year, as only one patient in both studies recovered during the second or third year after stroke. They concluded that if a patient has not recovered within the first year, there is a high risk of chronic depression.
Studies have considered a wide range of variables for their potential association with post-stroke depression. A review (9) found that physical disability (activities of daily living (ADL)), stroke severity, cognitive impairments and social factors were consistently associated with post-stroke depression. The few studies that developed prediction models for post-stroke depression beyond 1 year showed that early depression (8), physical health (8) and social factors (6, 8) were significant prognostic factors for depression 2 years post-stroke. Age (7), a right-sided lesion (7) fatigue (10) and instrumental ADL (10) were significant prognostic factors for depression 3 years post-stroke. However, most multivariate models reviewed (9) were based on cross-sectional studies instead of longitudinal studies, and were thus explanatory rather than predictive. These might therefore not be suitable to give a prognosis of the risk of long-term depression.
We conclude that evidence about the long-term course and prediction of depression, particularly beyond 1 year post-stroke, is still limited. Moreover, the results are not always unequivocal. More knowledge in this area is therefore needed for optimal care provision to patients after stroke in the long term.
The aims of the present study were: (i) to describe the long-term course of post-stroke depressive symptoms (PDS) up to 3 years post-stroke; and (ii) to develop a prediction model for PDS 1 and 3 years post-stroke by examining the prognostic value of the presence of PDS 6 months post-stroke and the possible additional predictive value of other clinical variables.
METHODS
Participants
Participants were selected from stroke patients consecutively admitted to 4 Dutch rehabilitation centres according to the following inclusion criteria: (i) admittance for inpatient rehabilitation; (ii) a first-ever stroke; (iii) a 1-sided supratentorial lesion; and (iv) age over 18 years. Exclusion criteria were: (i) pre-stroke morbidity resulting in pre-stroke disability (Barthel Index (BI) below 18); (ii) inability to speak Dutch; and (iii) aphasia. The medical ethics committees of the University Medical Center Utrecht and the participating rehabilitation centres approved the study.
Procedure
Patients were invited to participate in the study by their rehabilitation physician at the start of inpatient rehabilitation. Informed consent was obtained from all patients. The participants were followed until 3 years post-stroke. Baseline measurement was taken at 6 months and follow-up measurements were taken 1 year and 3 years post-stroke. All assessments were performed by trained research assistants.
Measures
Post-stroke depressive symptoms. The Center for Epidemiologic Studies-Depression scale (CES-D) (11) was used to assess PDS. This is a self-report screening questionnaire with 20 items assessing mood over the past 7 days. It proved to be a valid and reliable for the stroke population (12, 13).The total score has a minimum value of 0 and a maximum of 60, and a score ≥ 16 indicates the presence of PDS with a specificity of 90% and a sensitivity of 86% in stroke populations (13).
Independent variables were collected at baseline, i.e. 6 months post-stroke. Data on age, gender, marital status, pre-stroke employment status, level of education, type of stroke and hemisphere were derived from medical charts. Cognition was evaluated using the Mini Mental State Examination (MMSE) (14). A subject who scored less than 26 on the MMSE was considered to have cognitive impairments. Visuo-spatial hemi-neglect was measured by a letter cancellation task (15) and was recorded as present when the patient scored 3 omissions or more on one side compared with the other. The Fatigue Severity Scale (FSS) (16) was used to evaluate post-stroke fatigue (17, 18). It consists of 9 statements about fatigue scored on a 7-point scale, ranging from 1 (strongly disagree) to 7 (strongly agree). The total score is the mean of the 9 item scores and ranges from 1 to 7. Fatigue was recorded as present if the total score was 4 or higher. The BI (20), which measures the level of ADL dependency, was used to describe functional status, scoring from 0 to 20. A patient was considered dependent if the BI was 18 or lower.
Statistical analysis
Data were analysed using the SPSS statistical package (version 13.0). Descriptive statistics were used to describe the baseline characteristics and course of PDS. χ2 tests were used to evaluate differences between participants and drop-outs. Cochran’s Q test was used to compare the proportions of patients with PDS 6 months, 1 and 3 years. After that, McNemar’s test was used to compare the proportions of patients with PDS between 6 months and 1 year post-stroke, and between 1 and 3 years post-stroke.
Univariate analyses were used to examine the relations between PDS 1 year and 3 years post-stroke and the independent variables. Variables with a significance level below 0.2 in 1 of the 2 analyses were selected for the multivariate logistic regression analyses. This selection method, with a more liberal significance level, increased the power for the selection of true predictors and limited the bias in the selected coefficients. The significant variables were tested for multicollinearity. If the correlation coefficient was > 0.7, the variable with the lowest correlation coefficient in relation to the outcome measure was omitted from the analysis.
Two prediction models were developed, for the presence of depression 1 year post-stroke and for the presence of depression 3 years post-stroke. In model A, only depression 6 months post-stroke was entered in the model, while all other candidate predictors (personal and stroke-related variables and post-stroke impairments) were added simultaneously in model B (method Enter). Receiver operating characteristic (ROC) curve analysis was used to evaluate the discriminating ability of all models. The larger the areas under the curve (AUC), the higher the sensitivity and specificity for the prediction of depression. An AUC of 0.5 is uninformative, while greater than 0.7 is considered reasonable and greater than 0.8 is considered good. We tested whether the AUC of model B was significantly different from that of model A. Models were significantly different if z ≥ 1.96. The paired z-score between model A and B was calculated from the equation: z = AUCA – AUCB/√ (SE2A + SE2B – 2rSEASEB), where r is the Pearson product moment correlation coefficient between models A and B (21).
RESULTS
A total of 224 patients were included in the study. Thirteen patients died during follow-up, 31 withdrew, 9 were lost to follow-up, and data of 40 patients were incomplete. Complete data sets were available for 131 patients. Their characteristics are shown in Table I. Patients were relatively young, the majority were living with a partner, and almost half of them had been employed before their stroke. There were no significant differences between participants and drop-outs in terms of the baseline characteristics, except that drop-outs were significantly more likely to have suffered an infarction (χ2 = 5.9, p = 0.015) (Table I). Information on use of antidepressant medication was only complete at 3 years post-stroke. At that time, 34.6% of the participants with depressive symptoms and 11.7% of the participants without depressive symptoms used antidepressant medication (selective serotonin reuptake inhibitors (SSRIs) or tricyclic antidepressants).
| Table I. Characteristics of patients at 6 months post-stroke |
| Characteristics | Total group (n = 224) | Subjects (n = 131) | Drop-outs (n = 93) |
| Age, years, mean (SD) | 57.0 (11.1) | 56.3 (10.7) | 58.2 (11.6) |
| Gender, % female | 40.2 | 39.7 | 41.5 |
| Marital status, % living with partner | 73.2 | 72.5 | 73.4 |
| Level of education,% with higher professional/university degree | 18.8 | 22.9 | 13.8 |
| Pre-stroke employment status, % employed | 41.5 | 43.5 | 39.4 |
| Hemisphere, % right | 53.6 | 58.8 | 46.8 |
| Type of stroke, % infarction | 72.3 | 66.4* | 80.9* |
| Cognition (start of rehabilitation), % impaired | 37.2 | 29.5* | 54.2* |
| Visuospatial hemi-neglect, % present | 11.2 | 10.5 | 12.3 |
| ADL dependency, % dependent | 40.2 | 36.6 | 44.7 |
| Fatigue, % present | 65.6 | 67.2 | 64.6 |
| Depressive symptoms, % present | 22.8 | 23.7 | 23.3 |
| *p < 0.05. ADL: activities of daily living; SD: standard deviation. |
Course of post-stroke depressive symptoms
PDS was present 6 months, 1 year and 3 years post-stroke in 23.7%, 25.2% and 16.0% of the patients, respectively. The percentages changed significantly over the entire period (p = 0.01). The difference between 6 months and 1 year post-stroke was not significant (p = 0.84), but the prevalence of PDS showed a significant decline between 1 year and 3 years post-stroke (p = 0.008).
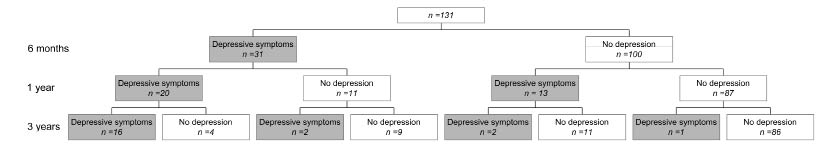
The majority of patients were stable in terms of the presence or absence of PDS between 6 months and 3 years post-stroke. In 65.6% of patients, PDS was absent at all 3 assessments (Fig. 1), while PDS was present at all 3 assessments in 12.2% of patients. Of the patients with PDS 6 months post-stroke, 41.9% had recovered 3 years post-stroke. Of the patients without PDS 6 months post-stroke, only 3% had PDS 3 years post-stroke.
Fig. 1. Course of depressive symptoms at 6 months, 1 and 3 years post-stroke.
Prediction of post-stroke depression
Table II presents univariate associations between the independent variables (i.e. personal and stroke characteristics and post-stroke impairments 6 months post-stroke) and PDS 1 and 3 years post-stroke. The highest odds ratios for both PDS 1 year post-stroke and PDS 3 years post-stroke were found for PDS 6 months post-stroke.
| Table II. Univariate analyses between personal characteristics, stroke characteristics and post-stroke impairments 6 months post stroke and depressive symptoms 1 and 3 years post-stroke |
| Determinants | Depressive symptoms 1 year post-stroke | Depressive symptoms 3 years post-stroke |
| OR (95% CI) | p | OR (95% CI) | p |
| Age, > 55 years | 1.11 (0.50–2.44) | 0.80 | 1.14 (0.45–2.90) | 0.78 |
| Gender, female | 1.37 (0.62–3.05) | 0.44 | 0.42 (0.14–1.23) | 0.11* |
| Marital status, living with partner | 0.83 (0.35–1.98) | 0.68 | 0.94 (0.33-–2.64) | 0.90 |
| Level of education, higher professional/university degree | 1.11 (0.44–2.79) | 0.83 | 1.06 (0.35–3.19) | 0.91 |
| Pre-stroke employment status, employed | 0.67 (0.30–1.52) | 0.34 | 0.60 (0.23–1.60) | 0.31 |
| Hemisphere, right | 1.40 (0.63–3.11) | 0.40 | 1.08 (0.43–2.73) | 0.87 |
| Type of stroke, infarction | 1.48 (0.62–3.54) | 0.38 | 2.43 (0.76–7.72) | 0.13* |
| Cognition, impaired | 0.56 (0.22–1.42) | 0.22 | 0.70 (0.24–2.06) | 0.52 |
| Visuospatial hemi-neglect, present | 4.13 (1.28–13.36) | 0.018* | 2.64 (0.73–9.55) | 0.14* |
| Depressive symptoms, present | 12.17 (4.76–31.11) | 0.000* | 44.77 (11.58–173.11) | 0.000* |
| Fatigue, present | 1.74 (0.71–4.26) | 0.23 | 3.43 (0.95–12.36) | 0.06* |
| ADL dependency, dependent | 1.39 (0.62–3.11) | 0.43 | 1.72 (0.67–4.42) | 0.26 |
| *Determinants included in the multivariate logistic regression analyses, p < 0.2. ADL: activities of daily living; 95% CI: 95% confidence interval; OR: odds ratio. |
Table III shows the prediction models for PDS 1 year post-stroke based on data obtained 6 months post-stroke. The ROC curve of model A, including only PDS, had an AUC of 0.75 (SE = 0.06; p = 0.00; 95% confidence interval (95% CI) = 0.64 – 0.86). The ROC curve of model B, including PDS, gender, type of stroke, fatigue and visuospatial hemi-neglect, had an AUC of 0.83 (SE = 0.04; p = 0.00; 95% CI = 0.74 – 0.91). The only significant predictor was PDS 6 months post-stroke. Comparison of the ROC curves showed that the AUC of model B was significantly greater than that of model A (r = 0.87; z = 2.44).
| Table III. Prediction models of depressive symptoms 1 and 3 years post-stroke |
| | B | SE | OR | 95% CI | p | R2 |
| Depressive symptoms 1 year post-stroke | | | | | | |
| Model A | | | | | | 0.31 |
| Depressive symptoms 6 months post-stroke | 2.50 | 0.48 | 12.17 | 4.76–31.11 | 0.00* | |
| Constant | –1.90 | 0.30 | 0.15 | | 0.00 | |
| Model B | | | | | | 0.36 |
| Depressive symptoms 6 months post-stroke | 2.49 | 0.50 | 12.09 | 4.51–32.39 | 0.00* | |
| Gender (female) | 0.39 | 0.49 | 1.48 | 0.56–3.87 | 0.43 | |
| Type of stroke (infarction) | 0.27 | 0.55 | 1.32 | 0.45–3.85 | 0.62 | |
| Visuospatial hemi-neglect | 1.31 | 0.73 | 3.71 | 0.89–15.47 | 0.07 | |
| Fatigue | 0.09 | 0.54 | 1.01 | 0.38–3.19 | 0.68 | |
| Constant | –2.48 | 0.61 | 0.08 | | 0.00 | |
| Depressive symptoms 3 years post-stroke | | | | | | |
| Model A | | | | | | 0.51 |
| Depressive symptoms 6 months post-stroke | 3.80 | 0.69 | 44.77 | 11.58–173.11 | 0.00* | |
| Constant | –3.48 | 0.59 | 0.03 | | 0.00 | |
| Model B | | | | | | 0.61 |
| Depressive symptoms 6 months post-stroke | 4.17 | 0.80 | 68.83 | 13.63–308.21 | 0.00* | |
| Gender (female) | –1.79 | 0.79 | 0.17 | 0.04–0.78 | 0.02* | |
| Type of stroke (infarction) | 1.00 | 0.84 | 2.73 | 0.53–14.12 | 0.23 | |
| Visuospatial hemi-neglect | 0.44 | 1.01 | 1.55 | 0.21–11.21 | 0.66 | |
| Fatigue | 1.00 | 0.91 | 2.73 | 0.46-16.01 | 0.27 | |
| Constant | –4.60 | 1.06 | 0.01 | | 0.00 | |
| *p < 0.05. CI: confidence interval; SE: standard error; OR: odds ratio. |
Table III also shows the prediction models for PDS 3 years post-stroke. The ROC curve of model A had an AUC of 0.87 (SE = 0.05; p = 0.00; 95% CI = 0.78 – 0.96). The ROC curve of model B had an AUC of 0.96 (SE = 0.02; p = 0.00; 95% CI = 0.93 – 0.99). Significant predictors were PDS and gender. Comparison of the derived curves showed that the AUC of model B was significantly greater than that of model A (r = 0.71; z = 2.01).
DISCUSSION
This study showed that long-term PDS is highly predictable 6 months post-stroke. The most important predictor is PDS 6 months post-stroke. The only other predictor was gender, which predicted PDS 3 years post-stroke.
The prevalence of PDS remained fairly stable from 6 months (23.7%) to 1 year (25.2%) post-stroke. From 1 to 3 years post-stroke, the prevalence showed a significant decline, to 16%. These percentages are comparable to those reported in other longitudinal studies (6–8). However, the course differed between these studies. Similar to our results, Verdelho et al. (7) found a decline in the prevalence up to 3 years post-stroke.
In addition to the overall course of PDS, our longitudinal design gave us the opportunity to examine the individual course of post-stroke PDS. Almost all patients (97/100) who had no PDS 6 months post-stroke did not develop PDS in the long term either. A persistent PDS over the 3-year period was found in 12.2% of our patients. The prevalence of relevant levels of depressive symptoms in the general older (55–85 years) population in the Netherlands, as measured with the CES-D, was 14.9% (22), and 14% of this study population showed persistent depressive symptoms over a one-year period (23). Although their follow-up period was much shorter than our follow-up of 3 years, the percentages of persistent depressive symptoms were similar to those in our stroke population. In view of this similarity between the stroke and general populations, the risk of persistent PDS is probably not related to the stroke, but rather to certain personal characteristics that render some persons more vulnerable to depressive symptoms (24). Estimates in the literature of persistent PDS among patients after stroke are also comparable, ranging from 2% to 17% (3, 4, 6, 8), but were only described for the first year post-stroke.
In our study, patients after stroke at risk for long term PDS were those who had PDS 6 months post-stroke. Only approximately one-third recovered within the first year, and an additional 10% over the next 2 years. Other studies (3–6) have reported higher estimates of recovery after an early PDS, viz. 50–80%. However, the data are difficult to compare, as these studies measured “early PDS”, that is, between onset and 3 months post-stroke. Åstrom et al. (6) concluded that if a patient has not recovered within the first year post-stroke, there is a high risk of chronic PDS. Our results showed that a high risk of chronic PDS can already be predicted 6 months post-stroke.
Our prediction models showed higher discriminatory power than the model by van de Port et al. (10), who found that PDS 3 years post-stroke was predicted by one-year instrumental ADL and fatigue, but who did not include PDS at baseline as a predictor in the model. Our results underline the important predictive value of early PDS for the prognosis of chronic PDS, which is in accordance with findings of previous longitudinal studies (6, 8).
Visuospatial hemi-neglect was significantly associated with PDS one year after stroke and was nearly a significant independent predictor of PDS one year post-stroke. Likewise, Nys et al. (25) found in an earlier hospital-based study that neglect within the first 3 weeks post-stroke was the most important cognitive risk factor for PDS between 6 and 10 months post-stroke. A possible explanation that Nys et al. (25) mentioned is that attentional networks in the brain overlap with neuronal networks involved in mood (26). Moreover, in view of the negative impact that neglect has on functional outcome (27), negative implications for mood seem plausible.
Contrary to our own expectations and previous findings in the literature (28, 29), we found that men, if experiencing depressive symptoms 6 months post-stroke, have a 5 times higher risk of chronic PDS than women. Further research is needed to explain this unexpected result. A hypothesis would be that women have a higher risk of becoming depressed and men have a higher risk of remaining depressed. Having a job and working full-time has been found to be a significant protective factor against depressive symptoms for men but not for women in the general population (30). As most men in our relatively young stroke population did not return to work, they can be considered to have lost an important protective factor, perhaps making them more vulnerable to persistent PDS.
In interpreting our results, several limitations of the study must be considered. First, our study suffered from considerable drop-out. Type of stroke and cognition were the only significant differences between participants and drop-outs. Cognition was not related to PDS, but type of stroke was, suggesting a slight underestimation of PDS due to drop-out. Secondly, PDS was assessed with the CES-D. This is a self-rating scale, which screens the presence of depressive symptoms. Previous studies on PDS used a variety of methods to diagnose depression, ranging from a single simple question to self-rating scales and psychiatric interviews based on the Diagnostic and Statistical Manual of Mental Disorders (DSM) criteria. The CES-D, however, does show very good sensitivity and specificity as a screening instrument for PDS (12, 13). Thirdly, we were not able to obtain reliable information on use of anti-depressant medication. Fourthly, the study was carried out in a selected stroke population, namely those admitted for inpatient rehabilitation. This hampers generalization of the results to the whole stroke population. The rehabilitation population has specific characteristics, in that the patients are relatively young and on average moderately disabled, because inpatient rehabilitation is not necessary for patients with the best outcome and is not very beneficial for patients with very severe stroke or co-morbidity. In addition, patients with aphasia were excluded from our study, as was done in most studies on PDS (31). This may have caused an underestimation of the prevalence of PDS. Specific instruments for the assessment of PDS in patients with aphasia using observational methods (32, 33) have been developed, but are awaiting further assessment of their psychometric qualities.
Finally, there are several other potentially important factors that we did not take into account in the prediction models. A personal history of depression is a potentially important factor, as demonstrated in previous studies (7, 34). The personality trait of neuroticism is a vulnerability factor for PDS (24, 35). Moreover, interventions directed at PDS such as medication, psycho-education and cognitive-behavioural interventions, probably have an important influence on the course of PDS (36). Nevertheless, our prediction models had good discriminatory power.
The predictors used in our models were assessed 6 months post-stroke, which is generally seen as the end of the recovery phase and the start of the chronic post-stroke phase. For rehabilitation physicians, this transitional stage is an important time to decide what further aspects deserve special attention for the long-term care of individual patients after stroke. Our results will be useful for clinicians who have to identify patients after stroke at risk for chronic PDS. The prognostic knowledge gained will help them to decide on the frequency of check-ups in the long term and on the appropriate therapeutic strategy.
ACKNOWLEDGEMENTS
This project was undertaken as part of the “Functional prognostication and disability study on neurological disorders”, supervised by the Department of Rehabilitation Medicine of the VU Medical Center, Amsterdam, The Netherlands, and supported by the Netherlands Organization for Health Research and Development (grant No. 1435.0001).We would like to thank the participating patients and the participating rehabilitation centres: De Hoogstraat, Utrecht; Rehabilitation Center Amsterdam, Amsterdam; Heliomare, Wijk aan Zee; and Blixembosch, Eindhoven, The Netherlands.
REFERENCES