OBJECTIVE: To examine cardiovascular disease risk factors and risk clusters in Swedish persons with traumatic wheelchair-dependent paraplegia.
DESIGN: Prospective examination.
SUBJECTS: A total of 135 individuals aged 18–79 years with chronic (≥ 1 year) post-traumatic paraplegia.
METHODS: Cardiovascular disease risk factors; dyslipidemia, impaired fasting glucose, hypertension, overweight, smoking, and medication usage for dyslipidemia, hypertension, and diabetes mellitus, were analyzed according to authoritative guidelines. Stepwise regression tested the effects of age, gender, and injury characteristics on cardiovascular disease risks.
RESULTS: High-prevalence risk factors were dyslipidemia (83.1%), hypertension (39.3%), and overweight (42.2%) with pervasive clustering of these risks. Being older was related to increased cardiovascular disease risk, except for dyslipidemia. Hypertension was more common in low-level paraplegia. Prevalence of impaired fasting glucose was lower than previously reported after paraplegia. A high percentage of persons being prescribed drug treatment for dyslipidemia and hypertension failed to reach authoritative targets for cardiovascular disease risk reduction.
CONCLUSION: Swedish persons with paraplegia are at high risk for dyslipidemia, hypertension, and overweight. Impaired fasting glucose was not as common as reported in some previous studies. Pharmacotherapy for dyslipidemia and hypertension often failed to achieve recommended targets. Population-based screening and therapeutic countermeasures to these cardiovascular disease risks are indicated.
Key words: cardiovascular diseases; risk; aging; paraplegia; spinal cord injury.
J Rehabil Med 2010; 42: 272–278
Correspondence address: Kerstin Wahman, Karolinska Institutet, Department of Neurobiology, Care Sciences and Society (NVS), Division of Neurorehabilitation, c/o Rehab Station Stockholm Frösundaviks allé 13, SE-169 89 Solna, Sweden. E-mail: kerstin.wahman@rehabstation.se
Submitted July 1, 2009; accepted November 10, 2009
INTRODUCTION
Considerable research has focused on cardiovascular disease (CVD) and CVD risk factors in persons with spinal cord injuries (SCI). A high frequency of typically aging-related CVD risks has been noted (1). While respiratory disorders, septicemia, and urinary tract infections were formerly the leading causes of death after SCI (2), a longer lifespan has allowed all-cause CVD to emerge as a serious health concern (3).
Many studies (3, 4) have examined possible causes, patient characteristics, co-morbidities, and potential treatments for CVD risks occurring after SCI. Nevertheless, our understanding of these risk factors and the manner in which they might accelerate CVD remains incomplete. At the least, a significant proportion of individuals with SCI are living a sedentary lifestyle (5). Also widely noted is the CVD risk of obesity (6), which may represent a consequence of both immobilization and a reduced metabolically-active lean mass due to muscle atrophy. This risk may be accentuated by decreased body energy expenditure from adrenergic dysfunction in those with injuries above the T6 spinal level (7). Many young persons with SCI have low levels of the cardio-protective high-density lipoprotein cholesterol (HDL-C) (8). Impaired fasting glucose, insulin resistance, and diabetes mellitus (DM) have all been reported to be common after SCI (9). When clustered, these risks factors are likely to contribute to a high prevalence of CVD in those with SCI (10).
In spite of the fact that a high prevalence of single CVD risk factors has been reported, there is, as yet, no clear evidence for increased CVD risk after SCI. Thus, some authors have found the prevalence of CVD to be similar in the SCI population and in the able-bodied population (11, 12). We have previously reported medical characteristics in a near-total regional SCI population in the greater Stockholm area (13). In these earlier studies, CVD and DM were not found to be more prevalent than in the non-disabled regional population. In summary, it is not yet clear whether there is, in fact, an elevated risk for CVD in SCI. From a theoretical point, the subgroup comprising wheelchair-dependent paraplegic subjects would be those with the highest CVD risk.
Thus, in an effort to further assess CVD risk after SCI, the purpose of this study was to examine guideline-established CVD risk factors in a near-total regional population of persons with traumatic, wheelchair-dependent paraplegia due to SCI.
METHODS
Participants
Participants in this study were wheelchair-dependent (i.e. ambulating exclusively or almost exclusively by wheelchair) men and women aged 18 years and older with post-traumatic paraplegia (i.e. neurological level of lesion below T1 and ASIA Impairment Scale (AIS) grade A, B, or C) for at least one year. All individuals were living in the greater Stockholm area and registered at the regional SCI outpatient center, which oversees follow-up for approximately 95% of the regional SCI population. A total of 153 persons fulfilling these criteria were asked to participate in the study as they consecutively attended for annual check-up at the center. From this candidate pool, 135 persons (104 men, 31 women) consented to participate in accordance with approval granted by the human ethics committee at the Karolinska Institutet, Stockholm. Two persons declined to participate in the study. Thus, almost 90% of the total regional population of wheelchair-dependent persons with SCI-induced paraplegia participated in this study. Sixteen persons (10%) did not attend the annual check-up for the following reasons; concurrent hospitalization illness (n = 6), chose to not attend (n = 3), and inaccessible by telephone or mail (n = 7). Descriptive characteristics are shown in Table I.
| Table I. Descriptive characteristics of the study participants |
| Age, years, mean (SD) [range] | 47.8 (13.7) [19–79] |
| Injury duration, years, mean (SD) [range] | 18.4 (12.3) [1–48] |
| Injury levels, n (%) | |
| T1–T6 | 45 (33) |
| T7–T12 | 66 (49) |
| L1–L4 | 24 (18) |
| Injury level vs AIS A–C | A | B | C | Total |
| Th 1–6 | 39 | 4 | 2 | 45 |
| Th 7–12 | 56 | 5 | 5 | 66 |
| L 1–4 | 14 | 4 | 6 | 24 |
| Total | 109 | 13 | 13 | 135 |
| AIS: ASIA (American Spinal Injury Association) Impairment Scale; SD: standard deviation. |
Assessments
Participant interview and examination. Information regarding current medication, smoking history, and history of CVD, DM, and lipid disorders was obtained by individual structured interviews performed by the first author and by medical chart reviews. Neurological status was retrieved from the medical records, which contained an examination performed by the attending physician, who in all cases was a specialist in neurology and/or rehabilitation medicine with special expertise in SCI. The AIS standard was used (14). Each participant had a resting blood pressure recorded on the left arm by a sphygmomanometer following 30 min of rest. Body weight (kg) was measured on a calibrated scale. Body height was obtained by participant report. Body mass index (BMI) was computed as body weight (kg) divided by the square of body height (m). Glucose concentrations and a lipid panel (total cholesterol (TC), low-density lipoprotein cholesterol (LDL-C), HDL-C, and triglycerides (TG)) were quantified in whole blood drawn from a superficial arm vein following an overnight (midnight) fast, and then assayed under standards of Swedish governmental oversight for clinical laboratories.
Operational definitions. Dyslipidemia (DL) was operationalized as pathological lipid levels according to guidelines of the National Cholesterol Education Project – Adult Treatment Panel III ( Table II) (15) and/or ongoing drug treatment for DL.
| Table II. Proportion of the study population having cardiovascular disease-related risks and/or having treatment for such condition according to guidelines (n = 135) |
| Risk variable | n (%) |
| Lipids | |
| Not previously diagnosed, but with lipid values outside the desirable range | |
| TC | 66 (49) |
| HDL | 58 (43) |
| LDL | 77 (57) |
| Triglycerides | 40 (30) |
| TC:HDL ratio ≥ 4.5 | 56 (41) |
| Diagnosed with DL and on lipid-lowering medication with lipid values | 15 (11) |
| In desirable range | 6 (4) |
| Outside the desirable range | 9 (7) |
| Total prevalence of DL (pathological values and medication) | 112 (83) |
| Glucose | |
| Not previously diagnosed but with DM, but with glucose value outside the desirable range | |
| IFG | 6 (4) |
| Diagnosed with DM on medication and with glucose value | 8 (6) |
| In desirable range | 1 (1) |
| Outside the desirable range | 7 (5) |
| Total prevalence of IFG/DM (pathological values and medication) | 14 (10) |
| Blood pressure | |
| Not previously diagnosed with HTN, but with BP values outside the desirable range | |
| Pre-hypertension | 23 (17) |
| Stage 1 HTN | 25 (18) |
| Stage 2 HTN | 9 (7) |
| Diagnosed with HTN on medication | 19 (14) |
| With blood pressure value in desirable range | 3 (2) |
| With blood pressure value outside the desirable range
(SBP ≥ 140 mmHg or DBP ≥ 90 mmHg) | 16 (12) |
| Total prevalence of stage 1 and 2 HTN (pathological values and medication) | 53 (39) |
| Body mass index | |
| ≥ 23 | 88 (65) |
| ≥ 24 | 70 (52) |
| ≥ 25 and ≤ 29.9 | 49 (36) |
| ≥ 30 | 8 (6) |
| Total prevalence of overweight/obesity | 57 (42) |
| Smoking (any tobacco within 30 days of study testing) | |
| Total prevalence of smoking | 22 (16) |
| Values in parentheses following risk variables are cut-off points for need of therapeutic lifestyle intervention (weight loss and increased physical activity) and/or drug therapy according to American guidelines (15). Lipids: Total cholesterol (TC) ≥ 5 mmol/l (> 200 mg/dl), high density lipoprotein (HDL) ≤ 1 mmol/l (< 40 mg/dl) men and ≤ 1.3 mmol/l (< 50 mg/dl) women, low density lipoprotein (LDL) ≥ 3 mmol/l (> 130 mg/dl), triglycerides > 1.7 (≥ 150 mg/dl) and TC:HDL ratio ≥ 4.5. DL: dyslipidemia Glucose: Impaired fasting glucose (IFG): glucose ≥ 6.1 mmol/l (110 mg/dl). DM: diabetes mellitus. Blood pressure: pre-hypertension (HTN): Systolic blood pressure (SBP) ≥ 130 – ≤ 139 mmHg or diastolic blood pressure (DBP) ≥ 85 – ≤ 89 mmHg; Stage 1 HTN: SBP ≥ 140 mmHg or DBP ≥ 90 mmHg; Stage 2 HTN: SBP ≥ 160 mmHg or DBP ≥ 100 mmHg. |
Impaired fasting glucose (IFG)/DM was operationalized as increased fasting glucose levels according to guidelines of the World Health Organization (WHO) (16) (Table II) and/or ongoing drug treatment for DM.
Hypertension (HTN) was defined as elevated blood pressure according to guidelines of the Seventh Report of the Joint National Committee on Prevention, Detection, Evaluation, and Treatment of High Blood Pressure (17) and/or ongoing drug treatment for HTN (see Table II). When a patient presented with multiple risk factors, the criterion score for HTN was lowered to systolic and diastolic pressures of ≥ 130 mmHg and ≥ 85 mmHg, respectively.
Overweight was operationalized as a BMI between ≥ 25 and ≤ 29.9. Obesity was defined as a BMI ≥ 30 (18). In the regression analysis, these 2 categories were collapsed into one category named overweight.
Smoking was classified as any tobacco smoking within 30 days of study testing (19).
Data analysis
Data were analyzed using SPSS for Windows 15.0 software. Frequency and descriptive statistics were calculated. Age, gender, level of injury grouping (T1–T6, T7–T12, and L1–L4), years injured, and AIS grades A, B, and C were used as independent variables in logistic regression models to assess their predictability on the following total prevalence of the variables: DL, IFG, HTN, overweight/obesity, smoking status, and drug use for DL, DM, and HTN. The independent variables in each model were evaluated to determine their relative effects on the respective dependent variables. Age, injury level, gender, and years injured were entered into a sequential logistic regression with the Wald forward entry method to test the individual contribution of each predictor in the final model.
RESULTS
Prevalence of cardiovascular disease-related risk factors
DL was found to be common. Depressed levels of HDL-C were observed in 43% of individuals, elevated TC was present in almost half (49%) of those studied, and an elevated LDL-C was observed in 57%.
In contrast, IFG/DM was found in only 10% of study participants, while 6% were undergoing treatment with anti-diabetic drugs.
More than one-third of the population (39%) had HTN and/or was prescribed anti-HTN medication. Sixteen subjects were on antihypertensive medication, but nevertheless had a blood pressure above the recommended range. Elevated body mass was highly prevalent, as 42% of those evaluated had a BMI ≥ the overweight criterion of 25 kg/m2 (Table II).
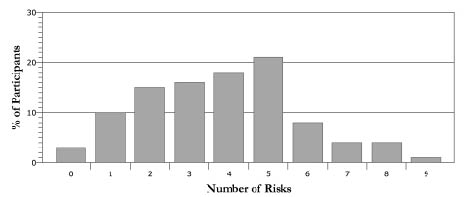
The following risk factors and cut-off scores were assessed (Fig. 1) (NCEP 2002):
Fig. 1. Proportion of the study population having clustering of cardiovascular disease-related risk factors (n = 135).
• HDL: men ≤ 1 mmol/l (< 40 mg/dl); female ≤ 1.3 mmol/l (< 50mg/dl)
• LDL ≥ 3 mmol/l (> 130 mg/dl)
• Smoking (Yes/No)
• BMI ≥ 25
• Age ≥ 45 years for men and ≥ 55 years for women
• Family history of cardiovascular disease
• Systolic blood pressure ≥ 130 mmHg
• Diastolic blood pressure ≥ 85 mmHg
• Fasting glucose ≥ 6.1 mmol/l (≥ 110 mg/dl)
• Fasting total cholesterol ≥ 5 mmol/l (> 200 mg/dl)
• Fasting triglycerides > 1.7 mmol/l (≥ 150 mg/dl).
Risk clustering
Only 4 of 135 individuals had no risk factor (Fig. 1). In contrast, a high percentage of study participants had at least 2 risk factors. Clustering of risks factors (Fig. 1) was thus common, with 87% of individuals having 2 or more risks, and 72% having 3 or more risks. Twenty-one percent of participants evidenced 5 risk factors, followed in order of next greatest prevalence by 4 and 3 risk factors, respectively. More persons had 6, 7, or 8 risk factors than none. Participants that were on medication for DL, DM and/or HTN, but had normal values on the time for the assessment are not included in the figure.
Logistic regression for isolated cardiovascular disease risk factors as the dependent variables
Table III includes the prevalence for each condition and the χ2 and significance level, step Nagelkerke R2, final regression coefficient, Wald statistic and significance level, odds ratio and 95% confidence intervals. The number in brackets is the degrees of freedom for the χ2 test and it is the degree(s) of freedom for each subsequent statistical test. All unstated dependent variables were insignificant and were not retained in the final model.
| Table III. Frequencies and the final model logistic regression results for the dependent variable |
| Condition | Prevalence (%) | Step χ2 (df), p-value | % of cases
predicted corrected by the model | Step R2 | Variable | Wald, p-value | OR | Lower 95% CI for OR | Upper 95% CI for OR |
| Anti-DL drugs | 11.1 | χ2 (1) = 9.4, 0.002 | 88.9 | 0.134 | Age | 8.2, 0.004 | 1.07 | 1.02 | 1.12 |
| IFG | 9.8 | χ2 (1) = 23.6, < 0.001 | 91.9 | 0.341 | Age | 14.7, < 0.001 | 1.14 | 1.07 | 1.22 |
| Anti-DM drugs | 6.0 | χ2 (1) = 7.1, = 0.008 | 94.1 | 0.141 | Age | 5.9, 0.02 | 1.08 | 1.02 | 1.15 |
| HTN | 39.3 | χ2 (1) = 25.8, < 0.001 χ2 (1) = 6.3, < 0.012 χ2 (1) = 4.7, < 0.03 χ2 (1) = 9.2, < 0.01 | 66.7 68.9 70.4 75.6 | 0.235 0.052 0.036 0.068 | Age Gender Male (ref) Years injured Level of injury T1-T6 (ref) T7-T12 L1-L4 | 13.3 < 0.001 7.0, 0.008 7.0, 0.008 6.1, 0.013 6.4, 0.011 | 1.07 0.22 1.05 3.5 5.8 | 1.03 0.70 1.01 1.29 1.49 | 1.11 0.68 1.10 9.22 23.1 |
| Pre-HTN | 33.0 | χ2 (1) = 17.1, < 0.001 χ2 (1) = 10.1, < 0.012 | 76.3 72.6 | 0.171 0.091 | Age Level of injury T1-T6 (ref) T7-T12 L1-L4 | 14.2, < 0.001 4.3, 0.037 8.7, 0.003 | 1.07 3.77 4.04 | 1.03 1.08 1.60 | 1.10 13.14 10.22 |
| Anti- HTN drugs | 14.1 | χ2 (1) = 9.5, 0.002 χ2 (1) = 12.4, 0.002 χ2 (1) = 6.6, 0.01 χ2 (1) = 4.4, 0.04 | 85.9 86.7 86.7 85.2 | 0.122 0.147 0.073 0.047 | Age Level of injury T1-T6 (ref) T7-T12 L1-L4 Gender Male (ref) Years injured | 4.3, 0.04 5.3, 0.022 9.1, 0.003 4.1, 0.043 3.9, 0.048 | 1.06 12.8 45.3 0.10 1.05 | 1.00 1.45 3.79 0.01 1.00 | 1.12 112.6 539.9 0.93 1.11 |
| Overweight | 42.2 | χ2 (1) = 8.6, 0.003 | 59.3 | 0.083 | Age | 7.9, 0.005 | 1.04 | 1.01 | 1.07 |
| Smoking | 16.3 | χ2 (1) = 4.9, 0.027 | 83.7 | 0.060 | Age | 4.5, 0.03 | 0.96 | 0.93 | 1.00 |
| CI: confidence interval; DL: dyslipidemia; DM: diabetes mellitus; HTN: hypertension; IFG: impaired fasting glucose; OR: odds ratio. |
Drug treatment for DL. The final model χ2 for the analysis was significant (χ2 = 9.4[1], p = 0.002), and the model classified 88.9% of the subjects correctly. Being older was related to an increased risk of being on drugs for DL.
IFG/DM. The final model χ2 for the analysis was significant (χ2 = 23.6[1], p < 0.001), and the model classified 91.9% of the subjects correctly. Being older was associated with an increased likelihood of having IFG/DM.
DM and drugs. The final model χ2 for the analysis was significant (χ2= 7.1[1], p = 0.008), and the model classified 94.1% of the subjects correctly. Being older was associated with an increased likelihood of being diabetic and on glucose-lowering medication.
HTN. The final model χ2 for the analysis was significant (χ2 = 46.0[5], p < 0.001), and the model classified 75.6% of the subjects correctly. For pre-HTN, the final model χ2 for the analysis was significant (χ2 = 27.2[3], p < 0.001), and the model classified 72.6% of the subjects correctly. Generally, advancing age and having injuries at the L1–L4 and T7–T12 levels were associated with greater risk for HTN.
Drug treatment for HTN. The final model χ2 for the analysis was significant (χ2 = 32.9[5], p < 0.001), and the model classified 85.2% of the subjects correctly. Advancing age and longer duration of injury were associated with prescribed antihypertensive drugs. Having injuries at the L1–L4 and T7–T12 levels were also associated with increased risk of being prescribed anti-hypertensive medication. Female gender was related to a decreased risk of having prescribed such drugs.
Overweight. The final model χ2 for the analysis was significant (χ2 = 8.6[1], p = 0.003), and the model classified 59.3% of the subjects correctly. The odds ratio of just over 1 shows a slightly increased risk of being overweight with increasing age.
Smoking. The final model χ2 for the analysis was significant (χ2 = 4.9[1], p = 0.027), and the model classified 83.7% of the subjects correctly. Younger age was related to an increased risk of being a smoker.
DISCUSSION
This study is the first of a series examining CVD risk in a regional, near-total prevalence population of persons with chronic paraplegia due to traumatic SCI. The current 135 study participants represent almost 90% of adults with wheelchair-dependent paraplegia living in the Greater Stockholm area.
Key findings of this study are the high prevalence of guideline-assessed CVD risk factors and the significant clustering of individual risks. These findings are consistent with earlier observations of various investigators in other regional SCI populations for DL, obesity, HTN, and CVD risk clustering (9, 20). However, the incidence of IFG/DM in our study cohort is lower than reported in some other SCI populations.
A high prevalence of low HDL-C, an independent risk factor for CVD (21) was found in our study, confirming previous findings in SCI populations (3, 20). Interestingly, while most of the observed CVD risks were partially or entirely explained by aging, dyslipidemia was not among them. We observed a TC: HDL ratio above the guideline-based criterion of 4.5 for high CVD risk (4) in 56/135 (41%) of study participants; a risk prevalence similar to that previously reported in Americans with paraplegia (20).
Despite having a mean age of less than 50 years, almost 40% of our study population either had an elevated blood pressure or were treated for HTN. This percentage is somewhat higher than that reported in a US veteran population (6), although assessment of anti-HTN drugs was not included in their study. As previously reported (22), conventional predictors as male gender, advancing age, and low level of injury explained pre-HTN and HTN risks (Table III).
Increased BMI has been widely reported among persons with SCI and was established in our population. Our population had a slightly higher prevalence of overweight (BMI ≥ 25–29.9), 36% vs 33%, but significantly lower prevalence of obesity (BMI ≥ 30), 6% vs 20%, than reported in a US veteran population (6). Various studies have indicated that persons with SCI have a greater percentage of body fat than persons without disability at almost every BMI level, and that BMI values within acceptable ranges in the general population may still be associated with overweight or obesity (23). In one study, this difference was found to be 9.4 kg of additional fat mass for any given BMI unit, which explains the suggestion that a criterion of 23 kg/m2 would better represent the cut-off score for the overweight condition in persons with SCI (24). If this criterion is applied to our study population, the prevalence of overweight increases from 42% to 65%.
While most of the major risk factors in our study population were observed at high frequencies, impaired fasting glucose was not among them. However, it is still higher than the 2–4% previously reported in the general Swedish population (25). In the USA, the prevalence of DM in subjects with SCI has been estimated to be 20% compared with 6% of non-disabled US controls (26). One explanation for the difference between the SCI population in Sweden and the USA could be the lower prevalence of obesity in the former. There is also a possibility that methods used in our study may have underestimated the incidence of this risk, as a study by Bauman (26) used an oral glucose tolerance test, while we used a single fasting blood glucose test.
In our study population, cigarette smoking was about as prevalent as that of the general Swedish population (27). However, at 16% this prevalence is lower than that of the 34% of veterans with SCI in the USA and the 21% prevalence in the general US population. Smoking has been shown to be the single most damaging lifestyle behavior adopted by persons with SCI (28).
Multiple risk factors for CVD act synergistically (29) and significantly shorten survival beyond 50 years (30). According to standards for the general population, most of our subjects (86%) had multiple risk factors and qualified for therapeutic lifestyle intervention and/or drug therapy according to guidelines (15). These findings corroborate previous studies pointing to an increased number of persons with SCI requiring intervention to prevent CVD (20).
A high percentage of the study participants fulfilled criteria for DL and HTN intervention but were not on any medication. Failure to initiate lipid-modifying pharmacotherapy is not an unusual finding for those with SCI, as a recent study of persons with paraplegia found that 63.4% of those who qualified for lipid lowering treatment by authoritative guidelines were not undergoing any indicated drug therapy (20).
Notable in our study was also the number of persons on medication who still failed to reach clinical targets.
The results of this study indicated that AIS level was not a significant predictor of CVD risk here assessed in prevalence of archetypical CVD risk factors. However, only 19% of the study population had an AIS of B or C, which makes room for the possibility that these groups were simply underrepresented in our population. Our study results showed that the only CVD risk factor that correlated with level of injury was HTN and drug use for HTN, which were more common in lower neurological levels of paraplegia (T7–T12 and L1–L4).
Our study findings should be interpreted while considering the following limitations. Assessments were obtained only once. Clinical testing for HTN and glucose intolerance sometimes warrants repeated measures prior to establishing a diagnosis (4), although sometimes not for population testing, as was undertaken here. Despite the fact that the study group comprised a near-total regional population, 135 subjects remains a rather small population when studying CVD risk factors. Thus, multicenter enrollment might strengthen the study if the participants remain a fairly homogenous regional population. The CVD risk factors included in this study have been adopted from those validated in able-bodied populations. However, in the absence of support for the notion that paraplegia should protect against these archetypical risks or any alternative ways to assess risk for CVD after SCI, we think it is reasonable to assess archetypical CVD risk factors also in SCI populations. We acknowledge that use of BMI with standard cut-off scores is not validated in SCI subjects. Waist circumference might be preferable, and/or a more sophisticated method for assessment of CVD risk after SCI (23). Tobacco use was limited to “smoking”, and thus excluded smokeless tobacco (i.e. chewing tobacco), whose CVD risk remains indistinct. Additional CVD risk factors, such as physical inactivity, alcohol over-consumption, psychosocial stress, and perceived health, all known to interact with the major independent risk factors, were not included in this study (31). The primary strengths of the study were the inclusion of a near-total regional cohort of persons with paraplegia and that 135 persons comprise a large SCI study group. In addition, every participant was examined and personally interviewed by the principal investigator (KW), which increased the validity of the assessments.
Systematic screening is essential to establish whether persons or populations are at risk for selected diseases and disorders, among them all-cause CVD. Unfortunately, evidence suggests that many persons with SCI are at risk for all-cause CVD, although are not referred for standard treatment. When many CVD risk factors are prevalent also in the general population it might be an important step towards increased awareness to screen for prevalence of risk factors, both before SCI as well as at every possible check-up. The annual check-ups may present an opportunity to perform such screening, institute therapeutic lifestyle intervention or drug therapy, as indicated, and to educate the patient about the need to adopt healthier diet, exercise, and behaviors as countermeasures to their risks. Follow-up is then made at the subsequent annual check-up to review these changes and determine their degree of success.
In conclusion, a high percentage of persons with chronic paraplegia in a homogenous Swedish regional population are at high risk for DL, HTN, and overweight. Impaired fasting glucose/DM was not as common as reported in some previous studies. Pharmacotherapy often failed to achieve recommended targets. The results indicate the need for screening for CVD risk in SCI populations and primary and secondary prevention programs to target reduced CVD risks. Further analysis and comparison with a regional sample of the same population matched for age and gender should be performed to evaluate whether persons with SCI are at particularly high risk for CVD.
ACKNOWLEDGEMENTS
The authors thank Anna-Carin Lagerström for her valuable and professional research contributions.
This study was supported by the Norrbacka-Eugenia Foundation, Cancer and Traffic Injury Fund, Stockholm County Council, The Spinalis Foundation, The Swedish Association for Persons with Neurological Disabilities, and Praktikertjänst (Research and Development Board).
No commercial party having a direct financial interest in the results of the research supporting this article has or will confer a benefit upon the author(s) or upon any organization with which the author(s) is/are associated.
REFERENCES