OBJECTIVE: To examine the dimensionality of the Zarit Burden Interview in a sample of carers of adults with acquired brain injury.
DESIGN: A cross-sectional UK survey using postal questionnaires.
PARTICIPANTS: A sample of 222 carers; 43 men (19.4%) and 179 women (80.6%); mean age 54 years. Types of brain injury included traumatic brain injury (49.5%), stroke (25.9%), brain infection (17.3%), hypoxia (4.1%), and “other” (3.2%).
METHODS: Exploratory and confirmatory factor analysis and Rasch analysis.
RESULTS: Unidimensionality was tested using confirmatory factor analysis, which showed a poor fit. The underlying structure of the Zarit Burden Interview was explored using principal components analysis and varimax rotation. This revealed 3 factors, although 1 comprised only 2 items. The 2 major factors identified were personal strain and role strain. They were then examined using Rasch analysis, which identified 2 brief and reliable unidimensional scales. There was no evidence of differential item functioning for different types of carer/brain injury.
CONCLUSION: The Zarit Burden Interview is a promising measure for the assessment of burden in carers of people with an acquired brain injury. It offers 2 reliable, brief subscales of personal strain and role strain for this purpose. However, it remains for these 2 brief subscales to be validated clinically in future research.
Key words: carer; brain injury; burden; Zarit Burden Interview; factor analysis; Rasch analysis.
J Rehabil Med 2010; 42: 302–309
Correspondence address: Richard J. Siegert, Department of Palliative Care, Policy and Rehabilitation, School of Medicine at Guy’s, King’s College and St Thomas’ Hospitals, King’s College London, Weston Education Centre, 3rd Floor, Cutcombe Road, Denmark Hill, London SE5 9RJ, UK. E-mail: richard.siegert@kcl.ac.uk
Submitted February 24, 2009; accepted November 12, 2009
INTRODUCTION
With an ageing population in Western countries and a greater demand for limited social care services, the burden placed upon family members or others who care for those with increasing dependency is of concern, not just to the family members themselves and those being cared for, but also to society in general (1–3). One major focus of contemporary research on people with cognitive or behavioural disorders, such as dementia, stroke and traumatic brain injury (TBI), is the strain that providing such supportive care can place on other family members. For example, recent evidence-based guidelines on caring for the carers of patients after stroke, noted high levels of carer burden are related to poorer mental, physical and social well-being for the carers, as well as increased depression and poorer rehabilitation outcomes for the patient (4). Consequently, the accurate ascertainment of “carer burden” becomes an important methodological issue, requiring the availability of psychometrically sound measures.
One such measure of carer burden that is widely used for research in dementia is the Zarit Burden Interview (ZBI) (5). While it was originally developed in this context, the ZBI has considerable promise as a measure of carer burden in a broader range of conditions. For example, it has already been used with carers of people after stroke, with other types of acquired brain injuries (ABI), and with non-cognitive conditions such as muscular dystrophy (6–8). In the present study, we examine some important psychometric properties of the ZBI as a measure of carer burden for people caring for a wider variety of ABI, including those resulting from stroke, TBI or infection. In particular we focus on the question: How many dimensions underpin the construct of burden as measured by the ZBI? To date, this issue has been addressed using both exploratory and confirmatory factor analysis in the context of dementia, although the issue remains far from resolved, with some authors reporting 2 factors and others reporting 3 (9–12). Moreover, the precise nature of the factors reported has varied. Part of this confusion might stem from the fact that different authors have used different factor analytical methods or have included different subsets of the 22 ZBI items. These studies are summarized in Table I. Arguably the most consistent finding here is the presence of two factors that reflect psychological distress (i.e. personal strain) and the impact on the carer’s life in general (i.e. role strain).
| Table I. Summary of existing factor analysis studies of the Zarit Burden Interview with dementia carers |
| Study reference | Carer sample | Factors reported | Items | Factor analysis | Conclusion |
| Whitlach et al., 1991 (9) | 133 dementia | Personal strain Role strain | 22 | EFA | Two factors |
| Knight et al., 2000 (10) | 222 dementia | Embarrassed/anger Dependency Self-criticism | 14 18 21 | EFA and CFA – 1, 2, 3 factor models | Three factors from 14 items |
| Bédard et al., 2001 (11) | 413 dementia | Personal strain Role strain | 22 | EFA | Two factors from 12 items |
| O’Rourke & Tuokko, (2003) (12) | 1095, 770 dementia | Personal strain Role strain | 12 | EFA and CFA | Two factors from 12 items |
| Ankri et al., 2005 (13) | 152 dementia | Psychological distress Impact on carer’s life Guilt | 22 | EFA | Three factors from 22 items |
| EFA: exploratory factor analysis; CFA: confirmatory factor analysis. |
Aims of the present research
The aim of the present research was to re-examine the psychometric characteristics of the ZBI with a sample of carers of people with an ABI. We were particularly concerned with establishing the dimensionality or factorial structure underpinning the ZBI. The issue of whether a questionnaire is unidimensional, or if it can be better characterized by a number of underlying constructs or dimensions, is an important aspect of establishing construct validity and has practical implications for how the test is scored and interpreted in healthcare settings. In addition to clarifying the underlying dimensionality of the ZBI with carers of people with an ABI we also wished to determine whether any such dimensions or subscales met modern psychometric standards for such scales.
These standards are exemplified by fit of data to the Rasch Measurement Model (14). The approach, in the general context of medical outcomes, has been described in detail elsewhere (15, 16). Moreover, the merits of Rasch methods for evaluating rehabilitation measures have been argued extensively (17–21). In brief, the Rasch model provides a mathematically simple template for the construction of interval scale measurement that is both valid and objective (sample free) and the task is to see if data with item responses meet the model expectations. A number of attributes are tested in this process, including appropriate stochastic ordering of items, freedom from differential item functioning (DIF), appropriate ordering of response options in polytomous items, and testing local independence assumptions, including unidimensionality (16). When these conditions are satisfied, the process orders all the participants in terms of their ability along the same log-odds scale that it orders the items in terms of their difficulty (or in this case the level of burden implied by the item). This transformation (into an interval scale) is presented graphically in a person-item threshold distribution, which gives an informative visual account of how well the items map onto the range of ability (i.e. burden) in the sample. For example, floor and ceiling effects are immediately apparent.
Another useful aspect of Rasch analysis for rehabilitation measures is the routine examination of DIF. This is where the response to an item differs for people at the same level of burden. This is particularly relevant, given that the same item may represent, for example, quite a different level of burden for a stroke carer compared with a TBI carer. Consequently, this study sets out to test the ZBI against the standards of the Rasch measurement model for a sample of carers of patients with ABI.
METHODS
Design
A cross-sectional UK-wide survey of carers of adults with ABI, using postal questionnaires with follow-up telephone interviews (8). Full ethical approval for the study was granted by the Harrow Research Ethics Committee.
Participants
Informal (unpaid) carers were recruited through: (i) national voluntary organizations that support families affected by ABI; and (ii) a specialist regional rehabilitation unit. To be eligible, they had to spend time every day caring for a family member with an ABI, who was aged 18 years or over at the time of the study, and who had been under 65 years old at the time of injury. ABI was defined as encompassing conditions affecting the brain that arise after birth, such as trauma, stroke, anoxia and infectious or metabolic diseases.
A total of 222 ABI carers met these criteria and were recruited. They comprised 43 men (19.4%) and 179 women (80.6%) with a mean age of 54 years (standard deviation (SD) 10.89). The type of brain injury concerned was as follows: 110 TBI (49.5%), 57 stroke (25.9%), 39 brain infections (17.3%), 9 hypoxia (4.1%) and 7 other (3.2%). After the factor analyses (analyses 1 and 3 below) and the Full-Scale Rasch analysis (analysis 2 below), and before commencing the Rasch subscale analyses (analysis 4 below), we removed 16 participants. We did this because one of the aims of the Rasch subscale analyses was to test for DIF across different groups of ABI carer and 2 groups (hypoxia and “other”) were very small. Consequently, the Rasch subscale analyses included 206 participants comprising 110 TBI carers (53.4%), 57 stroke carers (27.7%) and 39 brain infection carers (18.9%).
Data analysis
The analyses proceeded in 4 stages. The first stage (analysis 1 and 2) tested the unidimensionality of the ZBI. The second stage (analysis 3) explored the dimensions underpinning the ZBI. The third stage examined whether the 2 major factors identified in stage 2 met the criteria for Rasch scales (analysis 4). The final stage (analysis 5) involved confirmatory factor analyses of the 2 factor solutions.
Analysis 1 involved a confirmatory factor analysis (CFA) of the 22 items of the ZBI to test a 1-factor model. The rationale for this analysis was that failure to conform to a unifactorial model would be strong evidence for multi-dimensionality. Analysis 2 used Rasch analysis in an additional test of the unidimensionality of the ZBI. Analysis 3 involved an exploratory factor analysis (EFA) of the ZBI using parallel analysis to determine the appropriate number of factors to extract and rotate. The purpose of this analysis was to determine the number of distinct dimensions underpinning the ZBI.
Analysis 4 involved a separate Rasch analysis of the items comprising each of the major factors or dimensions identified in analysis 2. This analysis was included to establish whether any separate dimensions or subscales identified for the ZBI met the criteria for unidimensional Rasch scales. In analysis 5 we tested our 2-factor and Rasch-derived scales with a CFA.
Analysis 1: confirmatory factor analysis (CFA). The responses from the 222 participants on all 22 items of the ZBI were analysed using the AMOS 16 (published by SPSS, Chicago, http://www.spss.com) package for structural equation modelling. Prior to undertaking the CFA a polychoric correlation matrix was created from the participants’ responses. A polychoric correlation is used for estimating the association between 2 ordinal scales, such as 2 Likert scales on a questionnaire, that are each assumed to represent a latent variable with a normal distribution. It has been argued that a polychoric correlation matrix is preferred over other correlation methods (i.e. Pearson’s r, Spearman’s rho or Kendall’s tau) for confirmatory factor analysis (22). The CFA test of a single-factor model for the ZBI was then performed on this inter-item correlation matrix.
Analysis 2: full-scale Rasch analysis. The responses from the 222 participants on all 22 items of the ZBI were included in a Rasch analysis. Rasch analysis was completed using the RUMM2020 programme (published by Rumm Laboratory Pty Ltd., Duncraig, Western Australia, http://rummlab.com). The likelihood ratio test was performed on the output of the initial analysis to identify which version of the polytomous Rasch model (Rating Scale or Partial-Credit) was appropriate (23, 24). The Rasch analysis included the following sequential steps for both sets of items: (i) an overall test of how well the data fitted the Rasch model; (ii) re-scoring of all ZBI items that demonstrated “disordered thresholds”; (iii) stepwise deletion of the worst fitting item; (iv) re-analysis for overall model and individual item fit; (v) test for unidimensionality.
Briefly, disordered thresholds are those for which the transition (threshold) between response options within an item do not display an increasing level of the underlying trait. This can usually be dealt with by collapsing adjacent categories. For fit, summary and individual χ2 fit statistics, along with tests for DIF, were required to be non-significant (Bonferroni adjusted) and individual item and person-fit residuals were expected to be within the range ± 2.5.
Analysis 3: exploratory factor analysis (EFA). In the EFA we extracted factors and used principal components analysis with varimax rotation. We used Horn’s method of parallel analysis as the objective criterion for how many factors to extract (24). The choice of principal component analysis and varimax rotation was made because: (i) these methods typically provide clear, interpretable solutions (25); and (ii) to allow for direct comparisons with previous factor analyses of the ZBI that had used these methods (e.g. 11, 12). However, we also examined a 3-factor solution using Promax rotation to determine whether an oblique solution was very different.
Analysis 4: Rasch analysis of 2 ZBI subscales. Rasch analysis of the 2 ZBI subscales followed exactly the same procedure as in analysis 2, above, plus these 2 additional steps: (i) examination for DIF by type of brain injury (i.e. stroke vs TBI); (ii) inspection of the residual correlation matrix for evidence of local dependency.
Analysis 5: confirmatory factor analysis of the 2-factor solutions. In order to test the goodness-of-fit we performed a CFA on the results of the 2-factor solution from analysis 3 and also the 2 subscales identified by Rasch analysis in analysis 4. These CFAs provide a quantitative index of how well the covariance matrix used fits the models implied by the different solutions. As CFA should ideally be completed on an independent sample (which was not available) we also tested the best solution observed on a sub-sample; the 110 TBI caregivers.
RESULTS
Analysis 1: single factor confirmatory factor analysis
A single factor model in which all 22 items loaded high on a single, general “burden” factor resulted in a poor fit to the data, as reflected by a large, significant χ2 value of 1205.21 (df = 209, p = 0.000). This was supported by a range of fit indices reflecting a poor fit (comparative fit index = 0.717, goodness of fit index = 0.653, and root mean square error (RMSEA) = 0.148) (see Table V).
| Table V. Results of the confirmatory factor analyses. Number of items and factors in the model |
| Index of fit to the model | 22 items –
1 factor (n = 220) | 20 items – 2 factors (n = 220) | 11 items – 2 factors (n = 220) | 11 items –
2 factors (106 TBI carers) |
| χ2 | 1205.21 | 709.83 | 175.74 | 72.02 |
| df | 209 | 169 | 43 | 52 |
| p = | 0.00 | 0.00 | 0.00 | 0.03 |
| χ2/df | 5.76 | 4.20 | 4.08 | 1.38 |
| CFI | 0.717 | 0.832 | 0.90 | 0.95 |
| RMSEA | 0.148 | 0.121 | 0.119 | 0.06 |
| CFI: comparative fit index; RMSEA: root mean square error; TBI: traumatic brain injury. |
Analysis 2: full-scale Rasch analysis
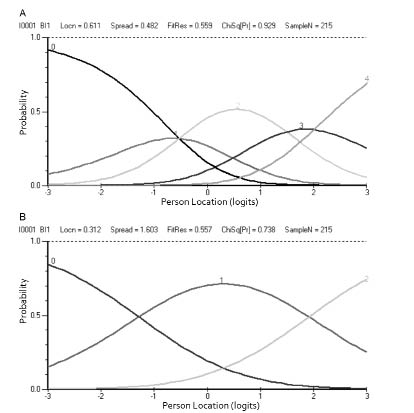
The Rasch analysis of the 22 items of the ZBI included 213 participants after 9 invalid or extreme scores were removed. The likelihood ratio test indicated that the partial credit version of the model was appropriate. The separation index was high at 0.93, indicating high internal reliability. However, the overall model fit was poor (see Table III, analysis 2) and 19 of the 22 items had disordered thresholds. Consequently, items were re-scored until all 22 items had orderly thresholds. The effect of item re-scoring on item thresholds is demonstrated in Fig. 1 using the results from item 1 of the ZBI. However, this still did not result in a good fit to the model (see Table III) so misfitting items were removed one at a time and the analysis repeated. A good fit to the model was achieved after removing items 3, 7, 8, 14, 15, 17, 20 and 21 (see Table III). To test for multidimensionality, person estimates from the 4 highest positive-loading items on the first residual component were compared with person estimates derived from the 4 highest negative-loading items, with both sets calibrated on the same metric. Of the 212 t-test comparisons 24 (11.32%) were significant at the 5% level, suggesting that the ZBI scale is not unidimensional.
Fig. 1. Zarit Burden Interview item 1, (A) before and (B) after re-scoring.
| Table III. Summary test-of-fit statistics for Rasch analysis of the Zarit Burden Inventory Full-Scale (22 items) and 2 factors |
| Analysis number | Item residual | Person residual | χ2 interaction | Person separation |
| Value | SD | Value | SD | Value (df) | p |
| 2 – Full-scale |
| 1 | 0.380 | 2.802 | –0.196 | 1.553 | 185.23 (44) | 0.0000 | 0.92 |
| 2 | 0.115 | 2.251 | –0.263 | 1.523 | 177.67 (44) | 0.0000 | 0.92 |
| 3 | 0.149 | 1.294 | –0.342 | 1.354 | 35.46 (28) | 0.1568 | 0.92 |
| 4 – Personal strain factor |
| 1 | 0.285 | 1.711 | –0.234 | 1.171 | 38.48 (20) | 0.0077 | 0.88 |
| 2 | –0.109 | 1.524 | –0.268 | 0.983 | 44.27 (20) | 0.0013 | 0.86 |
| 3 | –0.014 | 1.175 | –0.294 | 0.880 | 19.20 (14) | 0.1575 | 0.76 |
| 4 – Role strain factor |
| 4 | 0.131 | 2.151 | –0.233 | 1.199 | 71.41 (18) | 0.0000 | 0.88 |
| 5 | 0.100 | 2.106 | –0.193 | 1.050 | 63.19 (18) | 0.0000 | 0.86 |
| 6 | 0.407 | 1.141 | –0.409 | 1.088 | 12.04 (8) | 0.1494 | 0.81 |
| SD: standard deviation. |
Analysis 3: exploratory factor analysis
This indicated a 3-factor solution, which was rotated using the Varimax procedure. These 3 factors together accounted for approximately 64% of the total variance. Nineteen items had a high loading (i.e. > 0.45) on the first principal component and only 2 items (items 20 and 21) had low loadings (i.e. < 0.40). The results of the 3 factor varimax rotation are presented in Table II, where, for each item, the highest loading across the 3 factors is indicated in bold text. Both varimax and promax solutions gave similar patterns of item-factor loadings. The only difference was in the absolute values of these loadings. The correlations between factors resulting from the promax solution were as follows: personal strain × role strain (r = 0.69), personal strain × guilt (r = 0.34), and role strain × guilt (r = 0.26).
| Table II. Item-factor loadings from 3 factor varimax and promax rotations of 22 items of the Zarit Burden Interview (n = 222)* |
| Item | Factor 1 Personal strain | Factor 2 Role strain | Factor 3 Guilt |
| 1. I feel that the person I care for asks for more help than he/she needs. | 0.62 (0.68) | 0.21 (–0.03) | 0.13 (0.03) |
| 4. I feel embarrassed over his/her behaviour. | 0.75 (0.88) | 0.15 (–0.17) | 0.09 (–0.02) |
| 5. I feel angry when I am around the person I care for. | 0.85 (1.06) | 0.07 (–0.32) | 0.12 (–0.01) |
| 6. I feel that he/she currently affects my relationship with other family members or friends in a negative way. | 0.69 (0.67) | 0.36 (0.11) | 0.27 (0.16) |
| 9. I feel strained when I am around the person I care for. | 0.76 (0.78) | 0.34 (0.06) | 0.23 (0.11) |
| 13. I feel uncomfortable about having friends over because of him/her. | 0.77 (0.84) | 0.29 (–0.00) | 0.14 (0.01) |
| 14. I feel that this person expects me to take care of him/her as if I was the only one he/she could depend on. | 0.58 (0.56) | 0.33 (0.14) | –0.05 (–0.16) |
| 16. I feel that I will be unable to take care of him/her much longer. | 0.63 (0.62) | 0.35 (0.14) | 0.14 (0.03) |
| 18. I wish I could leave the care of this person to someone else. | 0.75 (0.84) | 0.28 (0.00) | –0.10 (–0.14) |
| 19. I feel uncertain about what to do about the person I care for. | 0.52 (0.42) | 0.35 (0.17) | 0.44 (0.36) |
| 2. Because of the time I spend with him/her, I do not have enough time for myself. | 0.40 (0.62) | 0.70 (0.80) | –0.13 (0.12) |
| 3. I feel stressed between caring for him/her and trying to meet other responsibilities for my family or work. | 0.53 (0.35) | 0.60 (0.50) | 0.20 (0.09) |
| 7. I am afraid of what the future holds for the person I care for. | 0.05 (–0.31) | 0.64 (0.80) | 0.24 (0.21) |
| 8. I feel he/she is dependent upon me. | 0.07 (–0.29) | 0.75 (0.93) | –0.03 (–0.09) |
| 10. I feel that my health has suffered because of my involvement with the person I care for. | 0.47 (0.28) | 0.60 (0.54) | 0.13 (0.03) |
| 11. I feel that I do not have as much privacy as I would like because of the person I care for. | 0.53 (0.38) | 0.60 (0.52) | 0.12 (–0.09) |
| 12. I feel that my social life has suffered because I am caring for this person. | 0.42 (0.16) | 0.75 (0.77) | –0.05 (–0.15) |
| 15. I feel that I do not have enough money to support this person in addition to the rest of our expenses. | 0.19 (–0.08) | 0.57 (0.64) | 0.16 (0.10) |
| 17. I feel that I have lost control of my own life since this person’s illness. | 0.49 (0.25) | 0.71 (0.68) | 0.09 (–0.01) |
| 20. I feel I should be doing more for him/her. | 0.09 (–0.09) | 0.09 (0.04) | 0.89 (0.90) |
| 21. I feel I could do a better job in caring for him/her. | 0.19 (0.06) | 0.05 (–0.07) | 0.91 (0.92) |
| 22. Overall, how burdened do you feel in caring for this person? | 0.53 (0.35) | 0.62 (0.54) | 0.13 (0.02) |
| *Promax item-factor loadings in parentheses. All factor loadings rounded to 2 decimal places. The highest loading of each item across the factors is highlighted in bold. |
Inspection of this table indicates that factor 1 represents personal strain. Factor 1’s 3 highest loading items reflect feelings of anger, discomfort and strain experienced by the carer. Factor 2 represents role strain; its highest loading items reflect feelings that the other person is dependent on the carer, that their social life has suffered and that he or she has lost control of my own life since this person’s illness. Factor 3 is comprised essentially of just 2 items (I should be doing more for him/her; I could do a better job in caring for him/her) that both might be said to reflect feelings of guilt. Since this third factor comprised so few items it was not included in the Rasch analyses below.
Analysis 4: Rasch analysis of 2 ZBI subscales
Data from the 2 groups of items comprising the 2 major ZBI subscales identified in the EFA were fitted to the Rasch model. The likelihood ratio test indicated that the partial credit version of the model was appropriate. We removed item 22, which asks “Overall” how burdened do you feel in caring for this person?”, from the analysis at this point. This item provides a global estimate of burden and loaded high on both factors 1 and 2 (Table II). In the Rasch analysis of each factor we included only those items that had their highest loading on that factor (Table I). Thus, personal strain comprised items 1, 4, 5, 6, 9, 13, 14, 16, 18, 19, and role strain comprised items 2, 3, 7, 8, 10, 11, 12, 15, 17.
Rasch analysis of factor 1: personal strain
The initial Rasch analysis of the personal strain factor included 194 participants after 12 extreme scores were removed. The separation index was high, at 0.88, which indicates that the personal strain subscale of the ZBI has a level of reliability consistent with use at the individual level. However, the overall model fit was not good (χ2 = 38.48, df = 20, p < 0.007) and 7 out of 10 items had disordered thresholds (Table III, analysis 4.1). These 7 items were re-scored before any further analysis. However, despite the orderly thresholds the data still did not fit the Rasch model very well (analysis 4.2) and it was necessary to delete the poorest fitting items 1 at a time, re-testing the model fit each time. After deleting items 6, 9 and 18, the model demonstrated an excellent fit to the Rasch model (analysis 4.3). This 7-item subscale also had good reliability, with Cronbach’s alpha = 0.82.
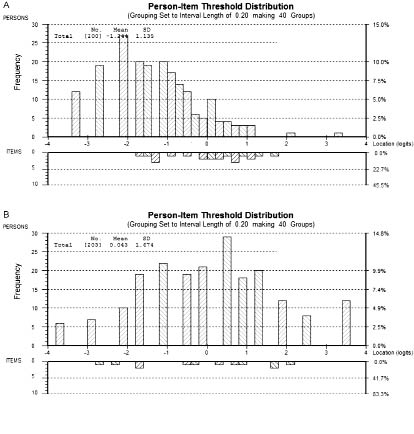
To test for multidimensionality, person estimates from the 2 highest positive-loading items on the first residual component were compared with person estimates derived from the 2 highest negative-loading items, with both sets calibrated on the same metric. Of the 187 t-test comparisons only 5 (2.67%) were significant. A test for DIF found no evidence of DIF for any of the 7 items across the 3 groups of carers (i.e. those caring for people with stroke, TBI, and infections). To check for local dependency we examined the inter-item residual correlation matrix and found a single correlation above 0.30, indicating minimal local dependency. Fig. 2 presents the person-item threshold distributions for the Rasch analyses of the personal strain items (Fig. 2A) and the role strain items (Fig. 2B). Showing that the personal strain items are quite well spread over the middle and upper range of the latent trait. In summary, a reliable (alpha = 0.81) and unidimensional 7-item subscale was identified that conformed to the Rasch measurement model expectations (Table III).
Fig. 2. Person-item threshold distributions for: (A) personal strain and (B) role strain Zarit Burden Interview items.
Rasch analysis of factor 2: role strain
The initial Rasch analysis of the 9 items comprising the role strain factor included 199 participants after 7 extreme scores were removed. The separation index was high, at 0.88, which indicates that the role strain subscale of the ZBI has a level of reliability consistent with use at the individual level. However, the overall model fit was not good (χ2 = 71.42, df = 18, p < 0.0000) and 6 out of 9 items had disordered thresholds (Table III, analysis 4.4). These 7 items were re-scored before any further analysis. While the re-scoring resulted in some improvement in overall fit, the data still did not fit the Rasch model (analysis 4.5). Consequently, it was necessary to delete the poorest fitting items, 1 item at a time, re-testing the model’s overall fit each time. After deleting items 7, 8, 12, 15 and 17, the model demonstrated a good fit to the Rasch model, as shown in Table III by the small, non-significant χ2 value (analysis 4.6). This 4-item subscale still retained good reliability, with Cronbach’s alpha = 0.80.
To test for multidimensionality, person estimates from the 2 highest positive-loading items on the first residual component were compared with person estimates derived from the 2 highest negative-loading items, with both sets calibrated on the same metric. Of the 185 t-test comparisons only 5 (2.70%) were significant at the 5% level. A test for DIF found no evidence of DIF for any of the 4 items across the 3 groups of carers (i.e. those caring for people with stroke, TBI, and infections). However, when we examined the inter-item residual correlation matrix there was evidence of some degree of local dependency, with one of the correlations above 0.40 (for items 2 and 10). As seen in Fig 2 the role strain items are reasonably well spread over the full range of the latent trait In summary, a reliable and unidimensional 4-item subscale that conforms to the Rasch measurement model was identified (Table IV).
| Table IV. Ten Zarit Burden Interview (ZBI) personal strain (factor 1) items and role strain (factor 2) items with χ2 and item location values from the initial analysis, χ2 value after re-scoring items and for final 7 items of personal strain subscale and final 4 items of role strain subscale |
| ZBI item | χ2 – 10 items | Location | χ2 – 10 items Re-scored | Final scoring | χ2 |
| Personal strain | | | | | |
| 1. I feel ….asks for help more than he/she needs | 0.616 | 0.016 | 6.070 | 0,1,2,3,4 | 2.986 |
| 4. I feel embarrassed… | 3.057 | 0.049 | 0.603 | 0,1,2,3,4 | 3.437 |
| 5. I feel angry… | 5.610 | 0.493 | 3.142 | 0,1,2,3,4 | 4.562 |
| 6. …affects relationship…other family members or friends… | 3.937 | –0.264 | 5.917 | N/A | Deleted |
| 9. I feel strained…. | 13.586 | –0.501 | 13.911 | N/A | Deleted |
| 13. I feel uncomfortable… | 0.776 | 0.118 | 5.160 | 0,0,1,2,3 | 3.354 |
| 14. I feel…only one he/she could depend on. | 5.882 | –0.612 | 1.033 | 0,0,1,1,2 | 0.587 |
| 16. I feel…unable to take care of…much longer | 1.648 | 0.382 | 2.384 | 0,0,1,2,3 | 1.747 |
| 18. I wish …leave the care of this person to someone else | 1.648 | 0.272 | 2.579 | N/A | deleted |
| 19. I feel uncertain…. | 1.727 | 0.047 | 3.962 | 0,0,1,2,3 | 2.525 |
| Role strain | | | | | |
| 2. Because…I do not have enough time for myself | 4.716 | –0.136 | 1.704 | 0,1,2,3,4 | 0.241 |
| 3. I feel stressed…other responsibilities for my family or work | 8.589 | –0.165 | 8.169 | 0,1,2,3 | 6.831 |
| 7. I feel afraid of what the future holds for the person I care for | 12.386 | –0.705 | 16.143 | 0,1,2,3, | Deleted |
| 8. I feel he/she is dependent upon me | –2.550 | –0.887 | 10.358 | 0,1,2,3,4 | Deleted |
| 10. I feel that my health has suffered…. | 2.903 | 0.442 | 0.615 | 0,1,2,3 | 3.168 |
| 11. I feel that I do not have as much privacy…. | 2.977 | 0.570 | 4.232 | 0,1,2 | 1.800 |
| 12. I feel that my social life has suffered…. | 9.856 | –0.041 | 7.255 | 0,1,2,3 | Deleted |
| 15. I feel that I do not have enough money…. | 22.653 | 0.662 | 2.743 | 0,1,2 | Deleted |
| 17. I feel that I have lost control of my own life…. | 4.779 | 0.260 | 11.971 | 0,1,2 | Deleted |
Analysis 5: confirmatory factor analyses of the 2-factor solutions
Results of the CFA of the 2-factor solutions identified by EFA and Rasch analysis are presented in Table V. For each of the models tested we obtained 4 indices of goodness-of-fit. Ullman suggests that good fit is reflected by (i) a low and non-significant χ2, (ii) a χ2 to degrees of freedom ratio (χ2/df) of less than 2.00, (iii) a comparative fit index (CFI) above 0.95, and (iv) a root mean square error (RMSEA) of 0.06 or smaller. Inspection of Table V shows that the 2-factor solution was an improvement on a single-factor model, but was still not a good fit. Moreover, while the 2-factor model based on the Rasch analyses might be described as an adequate fit it was only when this model was tested on a homogeneous subgroup of TBI carers that very good fit was observed (i.e. χ2/df = 1.38, CFI = 0.95, RMSEA = 0.06).
DISCUSSION
The current study examined a widely used carer burden instrument from the perspective of both traditional psychometric (factor analysis) and modern item response theory (Rasch analysis) perspectives. The factor analyses were necessary for clarifying the dimensionality of the ZBI, since the Rasch model assumes unidimensionality. The Rasch approach to exploring dimensionality is described by Kreiner & Christensen (26). Rasch analysis was then applied to test these 2 subscales for the appropriate stochastic ordering of items, DIF, appropriate ordering of response options and local independence assumptions including unidimensionality. Indeed, while item response methods have often been advocated as the alternative to classical test theory, our study is one of a small number of recent articles that have successfully used both approaches to better understand the psychometric characteristics of a questionnaire or rating scale (27, 28).
This is the first time that the ZBI, although widely used in dementia research, has been evaluated psychometrically with an ABI carer group. The results suggest that the ZBI is a promising measure for the assessment of carer burden among people caring for a family member with an ABI. However, the ZBI, in the context of caring for those with ABI, has been shown to be invalid in its original unidimensional form, rather comprising 2 subscales, personal and role strain. The present results suggest that these 2 factors or dimensions should be regarded as 2 separate or largely independent scores and not combined into a single burden score. In naming these items we proceeded empirically, by examining the semantic content of the highest loading items on each factor, and these corresponded closely with the names of factors reported by previous researchers (Table I). In summary, the ZBI is appropriate for assessing burden in ABI carers and provides separate scores for personal and role strain, albeit it in a markedly modified format.
The Rasch analyses of the 2 major factors we had identified, using EFA, confirmed that the personal strain and role strain items are both unidimensional scales. One advantage of these Rasch-derived scales is that they can be used by researchers or clinicians who want to use actual interval scale scores for each of the 2 dimensions. Admittedly, it was necessary to delete several items to find 2 groups of items that closely fitted the Rasch model. However, one of the concerns expressed over the ZBI has been its length and the strain this might impose on carers. Hence, the identification of 2 brief burden scales (4 and 7 items long) that provide unique information and meet the rigorous psychometric standards for Rasch scales is a useful finding. Moreover, both of these brief scales demonstrated good reliability, with Cronbach’s alpha of 0.82 for personal strain and 0.80 for role strain. They also resulted in a better model than either the single factor model or the 2 factors identified by EFA alone. A further strength of these 2 scales was that there was no evidence of DIF across the 3 groups of carers. Thus, the ZBI seems appropriate for use with people caring for someone with an ABI resulting from stroke, TBI or an infection. This means that the ZBI can be used to assess carer burden within each of these 3 groups of carer, but also to compare burden across them.
The identification of 11 items within the full 22-item ZBI that can provide interval scale scores on 2 distinct dimensions of burden has advantages for research purposes and may also be useful clinically. For researchers, for example, it opens up the possibility of modelling how these 2 different dimensions of burden can mediate the impact of the cared for person’s dependency on the quality of life of the carer. It may also help to identify different mechanisms for supporting the carer in their task. In particular, it raises the possibility of routinely assessing personal strain and role strain in carers. So, for example, a high level of personal strain might indicate a need for supportive counselling or cognitive-behavioural therapy aimed at helping the carer manage strong emotional responses, such as anger and anxiety. In contrast, a high level of role strain might suggest a need for additional respite care or home support aimed at freeing up the carer’s time so as to allow them to fulfil their other roles and tasks in life.
There remains the question of what to do with the 2 items that loaded high on the third factor in the EFA and seemed to reflect guilt felt by the carer (i.e. I feel I should be doing more for him/her, I feel I could do a better job in caring for him/her). These 2 items were not included in the subsequent Rasch analyses for the simple reason that a subscale of only 2 items will inevitably have low internal reliability. For research purposes it might be helpful to write some new items to expand this scale. In the clinical situation it could be useful to retain these 2 items, not to use them as a third scale with a score, but rather as “screening items”. In other words, if a carer responds with a high score on either or both of these items, a clinician might want to explore this issue further in conversation with the carer.
The present results are also broadly consistent with previous work on the dimensionality of the ZBI with dementia carers. Our results have also supported the existence of 2 important dimensions of burden, namely personal and role strain. In terms of the actual items comprising these 2 scales, our factor analysis results most closely resemble those reported by Whitlatch et al. (9) and Bédard et al. (11). Moreover, the guilt factor we identified comprises the same 2 items that Knight et al. called “self-criticism” and Ankri et al. also interpreted as guilt (10, 13).
One limitation of this study is that it is based upon a single UK sample of ABI carers who responded to a postal survey on caring. It would be desirable to replicate the results of both the factor analysis and the Rasch analyses with other types of carer, such as dementia carers. It would also strengthen the present findings if the EFA results we have reported here could be tested using confirmatory factor analysis with a different sample of ABI carers. Such an analysis might also explore the question of whether the 2 factors of personal and role strain form a higher-order general burden factor. Another important question for future research concerns the possibility of DIF in relation to the type of carer–cared for relationship. It would be useful to explore, for example, whether items work the same for mothers caring for a son after a TBI as they do for husbands caring for a wife who has had a stroke. It should also be emphasized that the 2 brief subscales that we have identified using Rasch analysis have not been clinically validated.
In conclusion, we examined the psychometric properties of the ZBI with 222 people caring for a person with an ABI. This is the first time the ZBI has been thoroughly evaluated for its psychometric properties with this group of carers. We used both classical and modern psychometric theory methods to gain further insight into the dimensionality of this measure. Both CFA and Rasch analysis indicated that the ZBI was not unidimensional, and EFA revealed a 3-factor structure, although 1 of these factors comprised only 2 very specific items concerning guilt. The 2 remaining factors, personal strain and role strain, were analysed using Rasch and 2 brief, reliable, unidimensional scales were identified. There was no evidence of DIF for the 3 types of ABI/carer within this sample. A CFA was able to identify these 2 factors clearly in a sub-sample of 106 TBI carers. These findings suggest that a modified 11-item ZBI is a promising measure for the assessment of burden for research on carers of people with an ABI and it offers 2 subscales, personal strain and role strain, for this purpose. However, it remains for these 2 brief subscales to be validated clinically in future research.
ACKNOWLEDGEMENTS
The authors are grateful to all the carers who participated in this research project, and to representatives of Headway, The Encephalitis Society and The Meningitis Trust for their help with recruitment. The project was commissioned and funded by the Department of Health (R&D grant 030/0066), but conducted and written up by an external group of researchers. The views expressed are not necessarily those of the Department of Health. Financial support for the preparation of this manuscript was provided by the Dunhill Medical Trust and the Luff Foundation.
REFERENCES