Cheng-Chih Chung, MD1, Wei-Chun Huang, MD1,2, Kuan-Rau Chiou, MD1,2, Ko-long Lin, MD3, Feng-Yu Kuo, MD1, Chin-Chang Cheng, MD1, Shih-Hung Hsiao, MD1,2 and Chun-Peng Liu, MD1,2
From the 1Cardiovascular Medical Center, Kaohsiung Veterans General Hospital, Kaohsiung, 2School of Medicine, National Yang-Ming University, Taipei and 3Department of Physical Medicine and Rehabilitation, Kaohsiung Veterans General Hospital, Kaohsiung, Taiwan
OBJECTIVE: To use the ratio of early mitral inflow peak velocity (E) to mitral flow propagation velocity (FPV) measured in the early phase of myocardial infarction (early phase E/FPV) to evaluate the training effects of 8 weeks’ cardiopulmonary rehabilitation in patients post-myocardial infarction.
DESIGN: Single-blinded, randomized control trial.
PARTICIPANTS: Eighty-seven patients with acute myocardial infarction who had undergone primary coronary intervention.
METHODS: Participants were enrolled randomly to either the cardiac rehabilitation or the control group. The rehabilitation group followed an 8-week supervised rehabilitation programme. All patients completed exercise testing and echo- cardiography at both the beginning and at 8-week follow-up.
RESULTS: The value of E/FPV was significantly reduced at 8-week follow-up in the rehabilitation group (p = 0.005). After cardiac rehabilitation, the increase in peak VO2 (p = 0.002) and cardiac clinical outcome (composition of mortality, cardiac readmission rate, and revascularization rate) (p = 0.001) were significantly greater in patients with an early phase E/FPV < 1.5 than in patients with early phase E/FPV ≥ 1.5. There were no significant differences in the increase in peak V O2 and cardiac clinical outcome in patients with early phase E/FPV ≥ 1.5.
CONCLUSION: Early phase E/FPV < 1.5 predicts more beneficial effects of cardiac rehabilitation in post-acute myocardial infarction patients who have undergone primary coronary intervention.
Key words: echocardiography; flow propagation velocity; myocardial infarction; rehabilitation; exercise therapy; anaerobic threshold; oxygen consumption.
J Rehabil Med 2010; 42: 232–238
Correspondence address: Chun-Peng Liu, Cardiovascular Medical Center, Kaohsiung Veterans General Hospital, No. 386, Dazhong 1st Road, Kaohsiung City 813, Taiwan. E-mail: cpliu@isca.vghks.gov.tw
Submitted July 19, 2009; accepted November 25, 2009
INTRODUCTION
Early mitral inflow peak velocity (E) divided by mitral flow propagation velocity (FPV) has been documented to predict left ventricular (LV) filling pressure in patients with various degrees of LV dysfunction (1), and the value of ≥ 1.5 predicted a negative outcome in patients with acute myocardial infarction (AMI) (2, 3). Peak oxygen uptake (VO2) is considered the most accurate method for assessing cardiopulmonary capacity (4, 5). Oxygen uptake at ventilatory anaerobic threshold (VO2AT) is also considered to be a useful, quantitative index to evaluate exercise capacity (6). Cardiac rehabilitation after AMI has been shown to improve VO2 , VO2AT and reduce cardiac mortality (7–9). Exercise capacity after AMI is related to LV diastolic function (10). However, there is little published data addressing the issue of using echocardiographic parameters as predictors of the effects of cardiac rehabilitation in patients post-AMI. Accordingly, this study investigated whether ratio of E to FPV could be used to predict the beneficial effects of cardiac rehabilitation in patients post-AMI.
METHODS
Study population
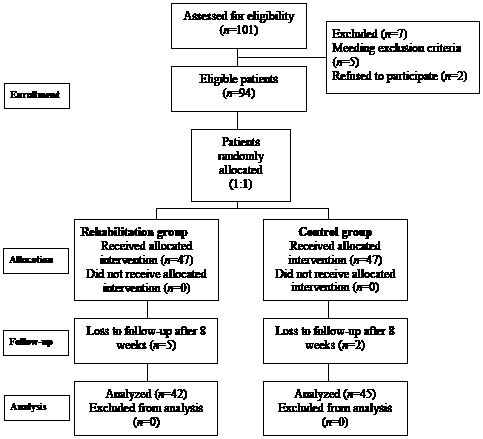
A total of 101 consecutive AMI patients with ST-segment elevation on ECG who had undergone primary coronary intervention within 12 h after the attack were screened. The exclusion criteria included ST-segment elevation AMI > 12 h, atrial fibrillation, lethal post-AMI ventricular arrhythmias, post-infarction residual myocardial ischaemia, respiratory failure requiring mechanical ventilator, cardiogenic shock requiring intra-aortic balloon counterpulsation or vasopressors, advanced heart failure (functional class IV), severe valvular disease, lower extremities orthopaedic limitations for exercise and the usual contraindications for exercise training. After screening, 94 patients were enrolled in the study. Patients were stratified and randomized 1:1 to the rehabilitation group (Group R: 3 sessions per week for 8 weeks) or the control group (Group C: conventional therapy) (Fig. 1). Conventional therapy included optimal medication, risk factor modification, lifestyle and exercise education, and adequate revascularization therapy according to American College of Cardiology/American Heart Association (ACC/AHA) guidelines (11, 12) without a cardiac rehabilitation programme. However, during the echo follow-up study, 5 patients in Group R and 2 patients in Group C were lost to follow-up. Therefore, 87 patients underwent echocardiography and maximal symptom-limited cardiopulmonary exercise test on an upright bicycle ergometer at the beginning and the end of 8-week follow-up. The examiners were blinded to the group allocation. The study protocol was approved by the ethics committee of our hospital and informed written consent was obtained from all patients.
Fig. 1. Randomization diagram.
Cardiopulmonary rehabilitation programme
Group R underwent a cardiopulmonary rehabilitation outpatient programme consisting of exercise training and education for 8 weeks. Patients began exercise training approximately one week (6–8 days) after AMI. The programme consisted of walking and cycling for a duration of 50 min each session, at a frequency of 3 sessions per week. Because cardiac rehabilitation started earlier after AMI in comparison with previous studies (13, 14), the intensity in the first week for patients using beta-blockers was set at the slightly lower level of 10–12 of the 6–20 scale (original Borg’s scale) (15). In the 2nd week, the intensity was set at the level of 13 of the Borg’s scale (13, 15). For patients not taking beta-blockers, we defined the slightly lower level of exercise intensity as 40–50% heart rate reserve in the first week, and 50–60% heart rate reserve in the 2nd week (13, 16). During subsequent weeks, the intensity of the training was gradually increased until the ventilatory anaerobic threshold was reached according to the result of a symptom-limited exercise test (17). All rehabilitation courses were monitored by electrocardiography and pulse oximetry under the supervision of physical therapists. Patients were encouraged to continue exercise training at home at the end of the 8-week programme.
Cardiopulmonary exercise testing
A symptom-limited bicycle exercise testing by open circuit spirometry was performed to measure aerobic capacity at baseline and the end of the 8-week exercise training. It was conducted on a system of Metamax 3B (Cortex Biophysik Co., Germany) which consisted of the bicycle ergometer, gas analyser and electrocardiography monitoring. All patients underwent maximal symptom-limited cardiopulmonary exercise tests on an upright bicycle ergometer to assess peak VO2 and VO2AT at both beginning and at 8-week follow-up. In the test, after a 2-minute resting period on the bicycle ergometer, exercise began with an intensity of 0 W workload for a 1-minute warm-up, followed by incremental loading using a ramp protocol (10 W/min) until exhaustion (18). Blood pressure was measured every minute. A 12-lead electrocardiography was monitored continuously during exercise. All patients completed the test safely. The increases in peak V O2 (∆peak V O2) and V O2AT (∆V O2AT) between the 2 tests were calculated.
Echocardiography study
Standard echocardiography was performed with the subjects in the partial left lateral decubitus position, using a commercially available ultrasound system (Sonos 7500; Philips Medical Systems, Andover, MA, USA) with an S3 phased-array transducer. Subjects were examined in the standard parasternal and apical views. All echocardiographic studies were performed following the recommendations of the American Society of Echocardiography (19, 20). Baseline 2- dimensional echocardiography followed generally accepted procedures, and Doppler measurements were made at end-expiration to ensure that subjects were not under strain at the time. Transmitral flow was measured by pulsed-wave Doppler as early diastolic (E) peak velocity and late diastolic (A) peak velocity. LV ejection fraction was estimated by biplane Simpson’s methods. For the colour M-mode FPV study, the colour velocity scale was adjusted to produce aliasing in the early diastolic signal. The cursor line was moved parallel to the ultrasound beam between the mitral leaflets at the apical 4-chamber sector plane. FPV was measured according to Garcia et al. (21). Five continuous beats were obtained for analysis. Electrocardiography was recorded simultaneously. Two experienced independent reviewers blinded to the patients’ data analysed the echocardiographic data.
Follow-up
All patients were followed up at the cardiologic clinic for at least one year. All readmissions, mortalities, and revascularizations were reviewed, and the causes were recorded.
Statistical analysis
Categorical data are presented as absolute values and percentages, whereas continuous variable are expressed as mean (standard deviation). χ2 tests were used for comparisons of categorical data. The independent t-test was used to compare the differences between the rehabilitation and control groups. The paired t-test was used to compare the differences between the beginning and the end of 8-week treatment. Differences were considered statistically significant at p-values < 0.05. To determine the inter-observer variability, the average value of the first observer was compared with the reading of the second observer, who was blind to the initial results. The mean difference between the measurements of the 2 observers was calculated, and the percentage variability was derived as the absolute difference between the 2 sets of measurements, divided by the mean of the 2 observations. Intra-observer variability was also calculated using this method. All statistical analyses were performed using the software package SPSS, version 12.0 (SPSS Inc., Chicago, USA)
RESULTS
Clinical characteristics
Table I shows the baseline demographic data and clinical outcome of both groups. There were no significant differences in location of myocardial infarction, angiographic characteristics, symptom to reperfusion period, peak creatine kinase level, Killip classification or cardiovascular risk factors. There was no mortality during 1-year follow-up in either group. Although there were no significant differences in cardiac readmission or revascularization rate between the groups, there was a trend showing that the cardiac clinical outcome (composition of mortality, cardiac readmission rate, and revascularization rate) was better in Group R than in Group C (p = 0.065).
| Table I. Baseline characteristics of the 2 study groups |
| | Rehabilitation group (n = 42) | Control group (n = 45) | p-value |
| Age, years, mean (SD) | 55.8 (12.6) | 59.6 (13.6) | 0.231 |
| Male/female, n (%) | 39 (93)/3 (7) | 39 (87)/6 (13) | 0.343 |
| Anterior MI/inferior MI, n (%) | 27 (64)/15 (36) | 25 (56)/20 (44) | 0.407 |
| Killip ≥ 2, n (%) | 21 (50) | 27 (60) | 0.349 |
| Peak creatine kinase (IU/l), mean (SD) | 2257.5 (2224.1) | 2506.9 (2491.0) | 0.626 |
| Symptom to reperfusion time, min, mean (SD) | 224.1 (94.4) | 227.2 (86.4) | 0.870 |
| Left ventricle end-diastolic pressure, mmHg, mean (SD) | 18.9 (4.5) | 19.6 (4.8) | 0.498 |
| Angiographic characteristics | | | |
| No. of coronary arteries with ≥ 50% stenosis, n, mean (SD) | 1.9 (0.8) | 1.8 (0.8) | 0.725 |
| No. of diseased vessels and value | | | 0.919 |
| Single vessel disease, n (%) | 15 (36) | 18 (40) | |
| Double vessel disease, n (%) | 18 (43) | 18 (40) | |
| Triple vessel disease, n (%) | 9 (21) | 9 (20) | |
| Hypertension, n (%) | 20 (48) | 27 (60) | 0.247 |
| Diabetes mellitus, n (%) | 11 (26) | 17 (38) | 0.248 |
| Dyslipidaemia, n (%) | 23 (55) | 28 (62) | 0.480 |
| Smoking, n (%) | 25 (60) | 28 (62) | 0.797 |
| Total cholesterol, mg/dl, mean (SD) | 181.8 (35.8) | 184.3 (41.1) | 0.779 |
| LDL-cholesterol, mg/dl, mean (SD) | 114.0 (31.8) | 111.7 (29.4) | 0.744 |
| HDL-cholesterol, mg/dl, mean (SD) | 38.1 (11.5) | 38.2 (8.9) | 0.949 |
| Triglyceride, mg/dl, mean (SD) | 113.9 (68.2) | 118.4 (70.71) | 0.790 |
| Height, cm, mean (SD) | 165.8 (7.7) | 162.3 (8.3) | 0.055 |
| Weight, kg, mean (SD) | 69.1 (9.7) | 67.9 (11.3) | 0.597 |
| BMI, mean (SD) | 25.2 (3.1) | 25.9 (3.5) | 0.413 |
| Medications | | | |
| Aspirin, n (%) | 40 (95) | 43 (96) | 0.944 |
| Clopidogrel, n (%) | 42 (100) | 45 (100) | 1 |
| Beta-blocker, n (%) | 32 (76) | 35 (78) | 0.860 |
| ACEI, n (%) | 39 (93) | 41 (91) | 0.765 |
| Statin, n (%) | 23 (55) | 27 (60) | 0.621 |
| Clinical event | | | |
| Cardiac clinical outcome (per patient per year), mean (SD) | 0.6 (0.6) | 0.8 (0.7) | 0.065 |
| Cardiac readmission event, n | 12 | 18 | |
| Revascularization event, n | 11 | 18 | |
| Mortality event, n | 0 | 0 | |
| SD: standard deviation; anterior MI: anterior and anteroseptal wall myocardial infarction; inferior MI: inferior and posterior wall myocardial infarction; Symptom to reperfusion time: duration between the onset time of symptom of myocardial infarction (dyspnoea or chest tightness) to the timing of angioplasty; LDL: low-density lipoprotein; HDL: high-density lipoprotein; BMI: body mass index; ACEI: angiotensin-converting enzyme inhibitor; Cardiac clinical outcome: the composition of cardiac readmission rate, revascularization rate, and mortality rate. |
Echocardiography results
There were no significant differences in baseline echocardiographic parameters (Table II) between the 2 groups. After 8-weeks’ rehabilitation, both groups had significant increases in LV intraventricular end-diastolic dimension (LVIDd), LV intraventricular end-systolic dimension (LVIDs) and LV ejection fraction. There was a significant increase in deceleration time (DT) of mitral E wave in Group R, whereas there was no significant change in that of Group C. Although there were no significant changes in velocity of mitral E wave, mitral A wave, or ratio of E wave velocity to A wave (E/A), there were significant differences in the velocity of mitral A wave and the E/A measured after 8-week follow-up between the 2 groups. There was a significant decrease in E/FPV in Group R after 8-week rehabilitation, whereas there was no significant change in E/FPV in Group C.
| Table II. Echocardiographic characteristics of the 2 study groups at early phase and after 8 weeks exercise training |
| Variables | Rehabilitation group (Group R) (n = 42) | Control group (Group C) (n = 45) | p-values |
| Early phase Mean (SD) | 8 weeks Mean (SD) | Early phase
vs 8 weeks p-values | Early phase Mean (SD) | 8 weeks Mean (SD) | Early phase vs
8 weeks p-values | Early phase
Group R vs C | 8 weeks Group R vs C |
| Aortic root (mm) | 31.6 (2.6) | 31.3 (2.6) | 0.365 | 30.9 (2.7) | 31.0 (2.4) | 0.700 | 0.184 | 0.529 |
| Left atrium (mm) | 36.5 (2.9) | 36.7 (2.8) | 0.590 | 36.8 (3.1) | 36.4 (3.7) | 0.227 | 0.672 | 0.649 |
| IVS (mm) | 9.8 (1.5) | 9.7 (1.5) | 0.219 | 9.4 (1.7) | 9.3 (1.6) | 0.304 | 0.246 | 0.291 |
| LVIDd (mm) | 50.3 (4.2) | 52.4 (4.2) | < 0.001 | 50.2 (3.6) | 52.8 (3.8) | < 0.001 | 0.897 | 0.625 |
| LVIDs (mm) | 31.2 (3.5) | 33.3 (3.9) | < 0.001 | 31.5 (3.8) | 34.1 (3.6) | < 0.001 | 0.643 | 0.335 |
| Mitral E (cm/s) | 62.1 (16.6) | 64.4 (13.6) | 0.437 | 64.9 (19.8) | 65.8 (16.7) | 0.734 | 0.478 | 0.659 |
| Mitral A (cm/s) | 66.1 (17.4) | 65.2 (17.8) | 0.744 | 73.1 (20.2) | 75.9 (19.5) | 0.281 | 0.089 | 0.009 |
| Mitral E/A | 1.0 (0.3) | 1.1 (0.5) | 0.284 | 1.0 (0.4) | 0.9 (0.3) | 0.401 | 0.689 | 0.046 |
| DT of mitral E (cm/s) | 172.4 (60.5) | 199.0 (50.3) | 0.003 | 173.3 (57.6) | 178.0 (40.8) | 0.571 | 0.940 | 0.035 |
| PV-S (cm/s) | 55.3 (27.6) | 50.2 (11.1) | 0.218 | 56.8 (12.7) | 55.8 (11.7) | 0.640 | 0.748 | 0.024 |
| PV-D (cm/s) | 40.4 (13.3) | 41.9 (12.4) | 0.461 | 43.3 (14.5) | 39.0 (8.9) | 0.055 | 0.332 | 0.218 |
| PV-Ar (cm/s) | 33.0 (9.6) | 30.3 (5.9) | 0.095 | 32.8 (6.9) | 35.2 (10.9) | 0.223 | 0.942 | 0.011 |
| LVEF | 45.9 (7.0) | 49.4 (6.6) | < 0.001 | 46.2 (5.5) | 49.4 (5.3) | < 0.001 | 0.801 | 0.993 |
| FPV | 37.5 (10.7) | 44.7 (8.5) | < 0.001 | 36.3 (7.8) | 41.1 (11.7) | 0.002 | 0.556 | 0.105 |
| E/FPV | 1.7 (0.5) | 1.5 (0.4) | 0.005 | 1.9 (0.7) | 1.7 (0.6) | 0.174 | 0.322 | 0.043 |
| SD: standard deviation; IVS: interventricular septum; LVIDd: left ventricular end-diastolic diameter; LVIDs: left ventricular end-systolic diameter; mitral E: peak velocity of early-diastolic mitral inflow; mitral A: peak velocity of late-diastolic mitral inflow; mitral E/A: peak velocity of early-diastolic mitral inflow divided by peak velocity of late-diastolic mitral inflow. DT: deceleration time; PV-S: peak systolic velocity of pulmonary vein; PV-D: peak diastolic velocity of pulmonary vein; PV-Ar: peak velocity of atrial reverse in pulmonary vein; LVEF: left ventricular ejection fraction; FPV: mitral flow propagation velocity; E/FPV: early-diastolic velocity of mitral inflow divided by mitral flow propagation velocity. |
Exercise results
There were no significant differences in exercise parameters between the 2 groups during baseline test (Table III). However, these parameters were significantly greater after 8-week follow-up in Group R than in Group C. Peak VO2, VO2AT and peak work rate of both groups also increased significantly. However, the peak VO2, VO2AT and peak work rate measured after 8-week follow-up in Group R were still significantly greater than those in Group C.
| Table II. Echocardiographic characteristics of the 2 study groups at early phase and after 8 weeks exercise training |
| Variables | Rehabilitation group (Group R) (n = 42) | Control group (Group C) (n = 45) | p-values |
| Early phase Mean (SD) | 8 weeks Mean (SD) | Early phase
vs 8 weeks p-values | Early phase Mean (SD) | 8 weeks Mean (SD) | Early phase vs
8 weeks p-values | Early phase
Group R vs C | 8 weeks Group R vs C |
| Aortic root (mm) | 31.6 (2.6) | 31.3 (2.6) | 0.365 | 30.9 (2.7) | 31.0 (2.4) | 0.700 | 0.184 | 0.529 |
| Left atrium (mm) | 36.5 (2.9) | 36.7 (2.8) | 0.590 | 36.8 (3.1) | 36.4 (3.7) | 0.227 | 0.672 | 0.649 |
| IVS (mm) | 9.8 (1.5) | 9.7 (1.5) | 0.219 | 9.4 (1.7) | 9.3 (1.6) | 0.304 | 0.246 | 0.291 |
| LVIDd (mm) | 50.3 (4.2) | 52.4 (4.2) | < 0.001 | 50.2 (3.6) | 52.8 (3.8) | < 0.001 | 0.897 | 0.625 |
| LVIDs (mm) | 31.2 (3.5) | 33.3 (3.9) | < 0.001 | 31.5 (3.8) | 34.1 (3.6) | < 0.001 | 0.643 | 0.335 |
| Mitral E (cm/s) | 62.1 (16.6) | 64.4 (13.6) | 0.437 | 64.9 (19.8) | 65.8 (16.7) | 0.734 | 0.478 | 0.659 |
| Mitral A (cm/s) | 66.1 (17.4) | 65.2 (17.8) | 0.744 | 73.1 (20.2) | 75.9 (19.5) | 0.281 | 0.089 | 0.009 |
| Mitral E/A | 1.0 (0.3) | 1.1 (0.5) | 0.284 | 1.0 (0.4) | 0.9 (0.3) | 0.401 | 0.689 | 0.046 |
| DT of mitral E (cm/s) | 172.4 (60.5) | 199.0 (50.3) | 0.003 | 173.3 (57.6) | 178.0 (40.8) | 0.571 | 0.940 | 0.035 |
| PV-S (cm/s) | 55.3 (27.6) | 50.2 (11.1) | 0.218 | 56.8 (12.7) | 55.8 (11.7) | 0.640 | 0.748 | 0.024 |
| PV-D (cm/s) | 40.4 (13.3) | 41.9 (12.4) | 0.461 | 43.3 (14.5) | 39.0 (8.9) | 0.055 | 0.332 | 0.218 |
| PV-Ar (cm/s) | 33.0 (9.6) | 30.3 (5.9) | 0.095 | 32.8 (6.9) | 35.2 (10.9) | 0.223 | 0.942 | 0.011 |
| LVEF | 45.9 (7.0) | 49.4 (6.6) | < 0.001 | 46.2 (5.5) | 49.4 (5.3) | < 0.001 | 0.801 | 0.993 |
| FPV | 37.5 (10.7) | 44.7 (8.5) | < 0.001 | 36.3 (7.8) | 41.1 (11.7) | 0.002 | 0.556 | 0.105 |
| E/FPV | 1.7 (0.5) | 1.5 (0.4) | 0.005 | 1.9 (0.7) | 1.7 (0.6) | 0.174 | 0.322 | 0.043 |
| SD: standard deviation; IVS: interventricular septum; LVIDd: left ventricular end-diastolic diameter; LVIDs: left ventricular end-systolic diameter; mitral E: peak velocity of early-diastolic mitral inflow; mitral A: peak velocity of late-diastolic mitral inflow; mitral E/A: peak velocity of early-diastolic mitral inflow divided by peak velocity of late-diastolic mitral inflow. DT: deceleration time; PV-S: peak systolic velocity of pulmonary vein; PV-D: peak diastolic velocity of pulmonary vein; PV-Ar: peak velocity of atrial reverse in pulmonary vein; LVEF: left ventricular ejection fraction; FPV: mitral flow propagation velocity; E/FPV: early-diastolic velocity of mitral inflow divided by mitral flow propagation velocity. |
Relationship between E/FPV and ∆peak VO2.and ∆ VO2AT
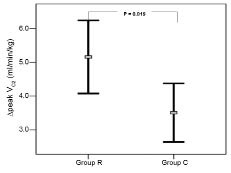
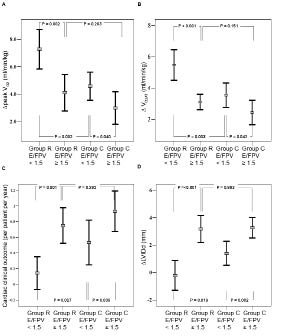
Fig. 2 shows that the mean increase in peak VO2 (∆peak VO2) in Group R was significantly higher than that of Group C (5.2 (SD 3.5) vs 3.5 (SD 2.9), p = 0.019). Further subgroup analysis is shown in Fig. 3A. The ∆peak VO2 of patients in Group R with early phase E/FPV < 1.5 (n = 14) was significantly greater than that of patients in Group R with early phase E/FPV ≥ 1.5 (n = 28) (7.3 (SD 2.5) vs 4.1 (SD 3.4), p = 0.002) and patients in Group C with early phase E/FPV < 1.5 (n = 15) (7.3 (SD 2.5) vs 4.6 (SD 1.8), p = 0.002). However, the ∆peak VO2 of patients in Group R with early phase E/FPV ≥ 1.5 and patients in Group C with early phase E/FPV ≥ 1.5 (n = 30) had no significant difference (4.1 (SD 3.4) vs 3.0 (SD 3.2), p = 0.203). The subgroup analysis of ∆ VO2AT (Fig. 3B) had a similar result as ∆peak VO2. The ∆ VO2AT of patients in Group R with early phase E/FPV < 1.5 was significantly greater than that of patients in Group R with early phase E/FPV ≥ 1.5 (5.5 (SD 1.7) vs 3.1 (SD 1.3), p < 0.001) and patients in Group C with early phase E/FPV < 1.5 (5.5 (SD 1.7) vs 3.6 (SD 1.4), p = 0.003). However, the ∆V O2AT of patients in Group R with early phase E/FPV ≥ 1.5 and patients in Group C with early phase E/FPV ≥ 1.5 had no significant difference (3.1 (SD 1.3) vs 2.4 (SD 2.1), p = 0.151).
Fig. 2. The mean increase in peak oxygen uptake (∆peak VO2) between the 2 tests at baseline and the end of 8-week follow-up in the control group (Group C) was lower than that in the rehabilitation group (Group R). Whiskers show the standard deviation.
Fig. 3. The comparison between patients in rehabilitation group (Group R) with early phase ratio of early mitral inflow peak velocity to flow propagation velocity (E/FPV) < 1.5 and E/FPV ≥ 1.5 and patients in control group (Group C) with early phase E/FPV < 1.5 and E/FPV ≥ 1.5. (A) The increase in peak oxygen uptake (∆peak VO2) between the 2 tests at baseline and the end of 8-week follow-up. (B) The increase in oxygen uptake at ventilatory anaerobic threshold (∆VO2AT) between the 2 tests at baseline and the end of 8-week follow-up. (C) The cardiac clinical outcome (composition of mortality, cardiac readmission rate, and revascularization rate). (D) The increase in left ventricular intraventricular end-diastolic dimension (∆LVIDd) between the 2 tests at baseline and the end of 8-week follow-up.
Relation between E/FPV and cardiac clinical outcome
Further subgroup analysis of cardiac clinical outcome is shown in Fig. 3C. The cardiac clinical outcome of patients in Group R with early phase E/FPV < 1.5 was significantly better than both patients in Group R with early phase E/FPV ≥ 1.5 (0.1 (SD 0.4) vs 0.8 (SD 0.6), p = 0.001) and patients in Group C with early phase E/FPV < 1.5 (0.1 (SD 0.4) vs 0.5 (SD 0.5), p = 0.027). The cardiac clinical outcome of patients with early phase E/FPV ≥ 1.5 in Group R and C showed no significant difference (0.8 (SD 0.6) vs 0.9 (SD 0.7), p = 0.282).
The intraobserver variability of mitral E velocity was 3.5% (3.2%); interobserver variability was 4.5% (3.6%). The intraobserver difference of FPV was 3.5 (2.3) cm/s with variability of 7.7% (4.7%), and the interobserver difference was 4.2 (3.4) cm/s, with variability of 9.1% (8.9%).
DISCUSSION
To our knowledge, the present study is the first to use E/FPV to predict the training effects of cardiac rehabilitation in patients post-AMI. The major findings of the study are that: (i) E/FPV decreased significantly after 2 months of cardiac rehabilitation started early after AMI; (ii) patients whose early phase E/FPV < 1.5 after AMI have more beneficial effects of cardiac rehabilitation; (iii) patients with early phase E/FPV ≥ 1.5 after AMI have no significant change in exercise capacity at 2 months after AMI, whether participating in a cardiac rehabilitation programme or not; (iv) patients with early phase E/FPV ≥ 1.5 after AMI have worse 1-year cardiac clinical outcome, regardless of participation in cardiac rehabilitation. These findings suggest that in patients post-AMI, the early measurement of E/FPV is necessary, as it not only predicts future events, but also determines the training effect of cardiac rehabilitation.
Cardiac rehabilitation post-AMI has been shown to improve exercise capacity and reduce cardiac mortality (7–9). However, there is still controversy concerning the effect of exercise training on LV remodelling. In previous studies, exercise training did not worsen the spontaneous deterioration of LV remodelling after anterior AMI (14, 22). Artur et al. (23) also reported an anti-remodelling effect of training in patients with ischaemic congestive heart failure. However, another report suggested that exercise training in patients with reduced LV function after AMI leads to further LV functional and topographic deterioration (24). Studies have shown that exercise training aggravates LV remodelling in patients with extensive anterior AMI (25). In this study, there was no significant difference in LVIDd after 8-week follow-up between the 2 groups. However, after further subgroup analysis (Fig. 3D), we found the mean increase of LVIDd (∆LVIDd) in patients in Group R with early phase E/FPV < 1.5 was significantly less than that of patients in Group R with early phase E/FPV ≥ 1.5 (–0.2 (SD 1.9) vs 3.2 (SD 2.5), p < 0.001) and patients in Group C with early phase E/FPV < 1.5 (–0.2 (SD 1.9) vs 1.4 (SD 1.6), p = 0.019). The ∆LVIDd of patients in Group R with early phase E/FPV ≥ 1.5 was significantly greater than that of patients in Group C with early phase E/FPV < 1.5 (3.2 (SD 2.5) vs 1.4 (SD 1.6), p = 0.07). The ∆LVIDd of patients in Group R with early phase E/FPV ≥ 1.5 and patients in Group C with early phase E/FPV ≥ 1.5 had no significant difference (3.2 (SD 2.5) vs 3.3 (SD 2.0), p = 0.883). That means in patients with early phase E/FPV < 1.5, the effect of rehabilitation can attenuate the severity of LV remodelling. However, in patients with early phase E/FPV ≥ 1.5, there was no attenuated effect of LV remodelling of cardiac rehabilitation. This might explain the controversial results in previous studies regarding the effect of exercise training on LV remodelling. This result also correlates with the previous report that E/FPV measured in the acute phase of AMI provides an early and accurate predictor for LV remodelling (26). Advanced diastolic dysfunction is a powerful predictor of heart failure and cardiac death after AMI (27, 28). One of the factors that influence the diastolic function after AMI is LV remodelling (29, 30). The exercise capacity measured after AMI also depends on the early phase of diastolic function (10). Therefore, the training effect after cardiac rehabilitation might not be demonstrable among all patients post-AMI. Hence, the process of LV remodelling is ongoing, even among patients with early phase E/FPV ≥ 1.5 who participate in cardiac rehabilitation. This may explain why patients in Group R with early phase E/FPV ≥ 1.5 did not have the same training effect as those in Group R with early phase E/FPV < 1.5, and why there was no significant difference in the increase in exercise capacity in Group R with early phase E/FPV ≥ 1.5 and Group C with early phase E/FPV ≥ 1.5.
As shown in a previous study, E/FPV is highly correlated with pulmonary capillary wedge pressure and diastolic function in patients with AMI (31). In the study, the deceleration time of mitral E wave increased significantly in Group R, and the E/FPV of Group R decreased significantly after 8-week of cardiac rehabilitation; meanwhile, the index of Group C showed no significant change. This result was in agreement with the previous statements that cardiac rehabilitation can improve the diastolic function in patients with AMI (32). In the present study, although the cardiac clinical outcome of Group R was not significantly better than Group C (p = 0.065), the subgroup analysis still shows that patients with early phase E/FPV ≥ 1.5 have a worse cardiac clinical outcome, even if they participate in the cardiac rehabilitation. This result was also compatible with the previous report that the index (E/FPV ≥ 1.5) measured in the early phase of AMI correlates to a high in-hospital heart failure and future cardiac event rate (2, 3).
In conclusion, this study, which approached rehabilitation from an organ-specific functional viewpoint, demonstrates that LV diastolic function post-AMI improves significantly after cardiac rehabilitation. The value of early phase E/FPV < 1.5 predicts more beneficial effects of cardiopulmonary rehabilitation in patients post-AMI.
Limitation
There were some limitations in this study. First, the study enrolled predominantly men who underwent primary coronary intervention; the reason for the mostly male cohort is the fact that our institution is a Veterans Hospital Center. Thus, the data needs further investigation to determine whether it is applicable to women or patients not undergoing primary angioplasty. Secondly, the number of patients was limited, and further larger studies need to be carried out.
ACKNOWLEDGEMENT
This study is supported by the Kaohsiung Veterans General Hospital, Grant No. VGHKS 97-004.
REFERENCES