OBJECTIVE: In order to facilitate comparisons of pain rehabilitation programmes in Sweden and to enable audit spirals for single programmes as well as outcome studies, the Swedish Association for Rehabilitation Medicine initiated a national quality registry in 1995.
Patients: Referred for rehabilitation due to pain-related disability.
METHODS: The registry collects standardized self-reports before assessment, after rehabilitation and one year later, covering demographic, educational and psychometric data, pain intensity, physical disability and life satisfaction. Sick leave data are collected from the National Insurance Board before and up to two years after rehabilitation. At each programme unit self-reports are processed into individual assessment profiles relevant to plan rehabilitation. Data are sent annually to the central registry for analysis and compared with “return to work” data. Each unit can compare its results with national means.
RESULTS AND CONCLUSION: The organization of the registry is described. Data indicating that contextual factors, but not pain characteristics, depression or activity limitations vary between patients referred to different centres, makes comparisons difficult. As of 2007, data from the multidisciplinary assessment of 19,833 patients have been collected. A total of 7289 patients attended a rehabilitation programme, generating two more self-reports. A limitation of the study is a lack of follow-up data from some units.
Key words: activity limitations; audit; chronic pain; monitoring; sick leave.
J Rehabil Med 2011; 43: 50–57
Correspondence address: Bengt H. Sjölund, Rehabilitation and Research Centre for Torture Victims, PO Box 2107, DK-1014 Copenhagen K, Denmark. E-mail: bsj@rct.dk
Submitted September 21, 2009; accepted September 7, 2010
Introduction
An important aspect of quality assurance is to monitor outcomes of a healthcare process. This is a central component of most quality assurance systems, including those designed for rehabilitation programmes (1). Such systems usually stress the importance of an audit spiral, in which outcome data are fed back into the programmes in order to improve their process characteristics. It is therefore very important for maintaining quality of care to have access to reliable outcome data.
Long-term pain may cause a patient suffering as well as limiting their activities of daily living (2). Controlled studies show that cognitive-behavioural interdisciplinary rehabilitation has a positive effect on functioning in patients who have been disabled by chronic non-malignant pain conditions (3, 4). However, the results vary between centres and have been considered highly context-sensitive (e.g. type of insurance or social support system) as well as being dependent on the design and content of the programme employed. From its original behaviourally oriented form (5), the programme has gradually taken on cognitive elements (6) as well symptomatic pain treatment (7, 8). Positive outcomes described include lower pain intensity, less preoccupation with pain, greater independence and lower consumption of healthcare. On the other hand, the return to work rate varies.
Attempts to evaluate the effects of different programmes are made difficult by the possible heterogeneity of referred patients as well as by the differences in inclusion and exclusion criteria for the various programmes. To facilitate comparisons on the national level and to enable audit spirals for single programmes as part of the ongoing quality assurance in healthcare, the Swedish Association for Rehabilitation Medicine initiated the formation of a national quality registry for patients referred for pain rehabilitation in 1995. This registry, the Swedish Quality Registry for Pain Rehabilitation (SQRP), has aggregated data since 1998 and compares all patients referred to the majority of Swedish rehabilitation units, firstly at a multidisciplinary assessment and, secondly, if indicated at the assessment, after participation in a rehabilitation programme.
A standardized protocol of data collection provides the opportunity to evaluate and compare patients individually and in groups, provided that a sufficient number of assessment variables are at hand, covering functioning as well as context. The individual dependence upon the national insurance allowance one and two years after rehabilitation in Sweden (an indirect measure of return to work) can be collected from the National Insurance Board.
This paper describes the design and implementation of the SQRP, and will form the basis of a series of forthcoming studies on SQRP data. Furthermore, it aims to clarify whether there are major variations between patient cohorts with disabilities due to chronic pain, referred to different rehabilitation centres in a country with a homogenous social security and healthcare system. Such variations may contribute to differences in outcomes, and hence be crucial for the interpretation of comparisons.
Methods
Design
All specialized assessment and rehabilitation units for persons with disabilities due to musculoskeletal pain in Sweden (population 9.1 million) were invited to participate in the present registry. A team of rehabilitation medicine physicians and one psychologist, all experienced in pain rehabilitation, were assembled by the National Swedish Rehabilitation Medicine Association in 1995 to develop the registry. Two issues were especially attended to in this work: (i) factors crucial to the characterization of patients referred to the units; and (ii) factors usable as outcome measures for pain rehabilitation, giving consideration both to diagnostic (International Classification of Diseases, 10th version (ICD-10)) and functional (International Classification of Disability, Impairments and Handicap (ICIDH)) components.
Protocol
Standardized self-reporting was considered the only viable alternative, performed at 3 defined moments in time: (i) before assessment, and for those entering rehabilitation; (ii) just after the rehabilitation programme; and (iii) at a 1-year follow-up. It was decided that patients referred to participating units should be sent a postal questionnaire 2–3 weeks before their first visit to the outpatient clinic. At the end of the rehabilitation programme a new self-report would be completed by the patient. In addition, the staff would complete a form containing information about referral source, ICD-10 diagnoses, probable mechanism of pain (nociceptive/neuropathic/psychogenic/unknown), type of intervention, and assessment of future vocational capacity. After one year, a third self-report postal questionnaire would be sent to all patients with a remainder to return the completed questionnaire to the respective unit. The forms were collected by a secretary who transferred the data into a local database with a software programme provided by the registry. Once a year, these data on all referred patients would be sent to the registry centre for analysis. Individual sick leave data would be collected from the National Insurance Board before, one and two years after rehabilitation according to a special agreement with our registry. Annual reports containing the compiled data with means/medians from the particular unit as well as national mean data would then be returned to each individual rehabilitation unit for internal audit.
Data selection
The data selected cover standard demographic and educational domains (Table I) as well as ICD-10 diagnoses. In addition, instruments vital to characterizing pain and its sequelae were chosen if they were available in Swedish at the time (1995–1997), taking into account validity and reliability as well as sensitivity to changes that could be hypothesized to occur. Moreover, it was considered necessary to collect information on the patient’s beliefs on his or her health and on return to work in the future, since this has been found to influence outcomes heavily by several previous studies (9–12). Additionally, participating centres had the option to include other instruments and questions from local needs.
| Table I. Demographic characteristics at assessment |
| | 1999–2004 n = 11,803 | 2005–2007 n = 8,030 | 1999–2007 n = 19,833 |
| Age, years, mean (SD) | 42 (10.1) | 41 (10.3) | 42 (10.1) |
| Women, n (%) | 8135 (69) | 5696 (71) | 13831 (70) |
| Education, n (%) | | | |
| None | 169 (1) | 132 (1) | 301 (1) |
| Primary school | 3159 (27) | 1594 (20) | 4753 (24) |
| Secondary school | 6218 (53) | 4576 (57) | 10794 (54) |
| University | 1855 (16) | 1418 (18) | 3273 (17) |
| Missing data | 403 (3) | 310 (4) | 713 (4) |
| Occupation, n (%) | | | |
| Employed | 7145 (61) | 4619 (58) | 11764 (59) |
| Unemployed | 3177 (27) | 2023 (25) | 5200 (27) |
| Students | 388 (3) | 288 (4) | 676 (3) |
| Other | 668 (6) | 749 (9) | 1437 (7) |
| Missing data | 405 (3) | 351 (4) | 756 (4) |
| SD: standard deviation. |
Instruments
Demographic data. The patient’s age, sex and education (none/primary/secondary/university level) were collected initially, as was current vocational status and dependence on benefits.
Pain intensity was assessed in a self-administered form, where the patient indicated his or her experienced level of pain on a continuous 100-mm horizontal visual analogue scale (VAS) (13, 14). The anchor points were “no pain” = 0 and “worst pain imaginable” = 100. VAS has proven to be user-friendly and reliable (15), has been validity-tested for both chronic and experimentally induced pain (16) and has shown reproducibility for both experimental and chronic pain (17).
Pain characteristics in the form of the number of months since the pain started and of the distribution of pain, number of regions in pain defined as 10 different regions (“neck”, “arm”, “low back”, etc.) and an 11th alternative, “varying main localization”. Digitizing real pain drawings was not considered a feasible large-scale alternative.
Perceived health was assessed in a self-administered form, where the patient indicated his or her perceived level of health on a continuous 100-mm horizontal VAS (13, 14). The anchor points were “full health” = 0 and “as ill as you can be” = 100.
The Hospital Anxiety and Depression scale (HAD) is a self-screening questionnaire for depression and anxiety (18, 19). It consists of 14 questions, 7 (odd numbers) for anxiety and 7 (even numbers) for depression. Each group of questions is given 0–3 points and > 10 points on either set of questions indicates anxiety or depression. Based on data from a large population, the basic psychometric properties of the HAD scale as a self-rating instrument should be considered as quite good in terms of factor structure, intercorrelation, homogeneity and internal consistency (20).
The Modified Somatic Perception Questionnaire (MSPQ) was derived for use with chronic backache patients, although it is also used with other chronic pain problems. The 13-item scale (each given 0–3 points with a maximum sum-score of 39 (39 = worst)) was designed to measure heightened somatic awareness among patients with chronic pain from a study of 102 chronic backache patients and its construct validity confirmed on a further study of 200 backache patients. The scale has been shown to be of importance in the understanding of functional disability and the simple self-report design is easy to administer and has high patient compliance (21). The MSPQ appears to be reliable and valid, but was only weakly associated with pain outcomes in a study by Deyo et al. (22).
The Disability Rating Index (DRI) was used to obtain the perceived capacity to carry out daily activities (23). The DRI is an instrument covering 12 items concerning physical function only and is most commonly self-administered. Patients are asked how they manage the following activities: (1) dressing (without help); (2) outdoor walks; (3) climbing stairs; (4) sitting for a longer time; (5) standing bent over a sink; (6) carrying a bag; (7) making a bed; (8) running; (9) light work; (10) heavy work; (11) lifting heavy objects; and (12) participating in exercise/sports. Patients were instructed to mark their perceived capacity for each item on a 100-mm VAS with the anchor points “manage without difficulty” = 0 and “ not manage at all” = 100. The DRI items can be analysed as a total mean index score (all item scores in mm added together and divided by 12; 0, no activity limitations at all, to 100, maximal limitations) or separately for each of the 12 items. The DRI has proven to be both reliable and valid for patients with chronic neck, shoulder and low back pain (23, 24).
The Multidimensional Pain Inventory (MPI) (25), a widely used self-report questionnaire for describing chronic pain problems and their consequences from several perspectives, was used to explore the various dimensions involved in the experience of chronic pain (26). The 61 MPI questions are used to create scores on 9 separate scales that are empirically derived from factor analytical studies (26, 27). Section I comprises 5 scales reporting “pain severity”, “interference” with life, “support” from significant other, “life control”, and “affective distress”. Section II contains reports of perceived responses from significant others. Fourteen specific behavioural responses are recorded and are used to create 3 scales derived from factor analytical evaluation (25), “punishing responses”, “solicitous responses” and “distracting responses”. Section III contains questions concerning 18 common activities and creates 4 primary activity scales on a single “general activity level” scale, but has later been found not to be reliable in a Swedish context (28). The SQRP registry stores answers to all 61 questions from each patient. Thus, the exclusion of section III can be done during analysis. The strength of MPI is its factor structure with 3 empirically established clusters and its psychometric properties have been replicated in the USA and Sweden (28, 29). The Initiative on Methods, Measurement, and Pain Assessment in Clinical Trials (IMMPACT) now recommends the MPI Pain Interference Scale as a core outcome measure for (perceived) physical functioning in clinical trials of chronic pain treatment for efficacy and effectiveness (30).
Patient’s beliefs concerning recovery and return to work. Simple 5-category scales were constructed for this purpose. All patients were asked before the programme to indicate on a self-administered form how convinced they were about their recovery. The anchor points were 1 = “entirely convinced to recover”; 5 = “not at all convinced to recover”. Categories 2–4 were not specified. They were also asked how easy they thought it would be to resume work (anchor points 1 = “very easy”; 5 = “very difficult”) and when this would happen (1 = “immediately; 5 = “never”).
Few if any instruments were available to assess participation at the outset of the registry. As an approximation, we chose to use the Life Satisfaction Scale (31), which has 11 items: “My life as a whole is”, “my vocational situation is”, “my financial situation is”, “my leisure situation is”, “my contact with friends and acquaintances is”, “my sexual life is”, “my ability to self care is”, “my family life is”, “my partner relationship is,” my physical health is”, and “my psychological health is”. For each of the above statements the patients were asked to mark a category from 1 to 6, where C1 = “very dissatisfying”, C2 = “dissatisfying”, C3 = “rather dissatisfying”, C4 = “rather satisfying”, C5 = “satisfying” and C6 = “very satisfying”. For comparison purposes, the LiSat-11 scale can be dichotomized into either satisfied (C5–C6) or not satisfied (C1–C4) (31).
Diagnoses relevant to rehabilitation (pain condition first; up to 4), according ICD-10 (32) was registered at assessment (by the team physician).
Pain mechanism. Nociceptive, neuropathic, psychogenic or unknown (classified by the team physician according to the criteria by the International Association for the Study of Pain; 33).
Computer software
A special software application to run on ordinary personal computers was developed using the Microsoft Access database program as a platform. The program allows a non-expert to feed in the data, either the patient or an administrator transferring the data from paper sheets completed by the patient. After completion, the data are stored and can be recalled by entering the patient’s social security number.
Assessment profile – a tool for patient evaluation
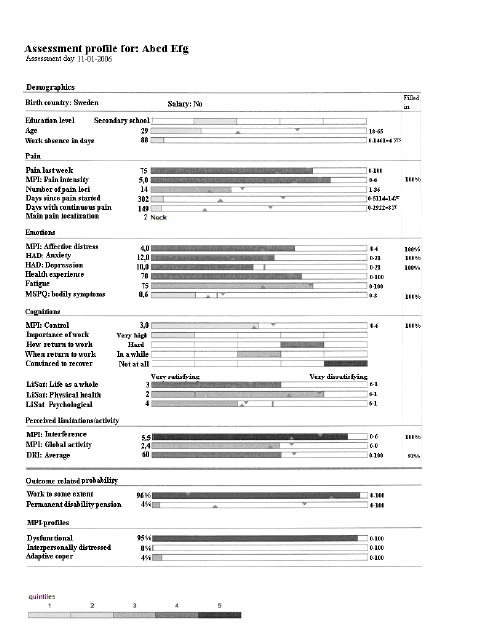
At each unit the results from the self-reports are directly processed and presented in an individual assessment profile by the software (Fig. 1). This profile is intended to support the clinical assessment made by the interdisciplinary rehabilitation team, since it includes several factors of importance for pain rehabilitation toward improving work capacity, including prognosis.
Fig. 1. An individual assessment profile. The major characteristics given to the left, organized from top to bottom in demographics, pain variables, emotions, cognitions, life satisfaction and perceived activity limitations. At the bottom are given the probability of being at work 2 years after the assessment (see text) and the probability of belonging to 1 of the 3 primary Multidimensional Pain Inventory (MPI) profiles. HAD: Hospital Anxiety and Depression scale; MSPQ: Modified Somatic Perception Questionnaire; DRI: Disability Rating Index; LiSat: Life Satisfaction.
The results in the profile are presented as coloured horizontal bars (in Fig. 1 shades of grey) where the length of each bar corresponds to a variable value, structured so that advantageous conditions are oriented to the left side of the diagrams. For categorical variables, the bars are divided into 5 parts representing different levels of the item. For continuous variables, the minimum and maximum values are given to the right of the scales. The level of response of the particular patient to each item is also given numerically to the left of the scales. The colours (shades) of the bars are based on calculations of quintiles of the total group in the central registry.
The computer software was designed to present reference values on each scale. For those instruments with established cut-off points, e.g. HAD, the reference is indicated as a vertical line. Other reference values were set from the central registry average value for each specific item of: (i) the patients having no or part-time insurance support (triangle at the bottom) or (ii) of those on full-time insurance benefits (triangle at the top) two years after completed rehabilitation, respectively.
Outcome-related probability of being at work/having permanent disability pension
It was considered of value to construct items in the profile for the estimation of probability of being at work, either full- or part-time or being on a permanent disability pension two years after a completed pain rehabilitation programme. This probability calculus was based on the association between individual assessment variables included in the SQRP questionnaire and the register data on dependence on benefits from the National Health Insurance. The analysis was carried out on data from 2822 patients who were either assessed only (n = 1924) or were assessed and had completed a rehabilitation programme aimed at improving working capacity (n = 898) during 2000–2002. Forty variables included in the SQRP questionnaire were included in logistic binary analysis. Being at work to some extent and having full disability pension, respectively, were used as dependent variables in the analysis. The logistic regression analysis was carried out in 3 steps: (i) forward stepwise (conditional) with all 40 variables; (ii) include the variables that had a p-value < 0.2 in Step 1; (iii) all variables with p < 0.05 or more from Step 2 were included in the analysis according to the “Enter” method.
Step 3 resulted in 7 variables that were of statistical significance for the outcome variables, i.e. (i) being at work to some extent or (ii) having permanent disability pension: age; not being at work; when to resume work; outdoor walks (DRI item); heavy work (DRI item); level of education and General Activity Index (MPI subscale).
Beta-coefficients for these variables were used in a probability equation of: (i) being at work to some extent; or (ii) having permanent disability pension two years after the assessment, respectively, and the results are presented in the profile as two scales (Fig. 1, bottom). A darker shaded bar indicates a stronger probability of a certain outcome. Two reference values are presented as triangles on each scale. For the scale “Probability of being at work to some extent” the lower triangle indicates the average probability of being at work two years after the assessment for those persons that were actually at work when the assessment was made (83%). The upper triangle indicates the average probability of being at work for two years among those who were on a permanent disability pension at the time of the assessment (17%). For the scale “Probability of having permanent disability pension” the reference values were 71% (being in pension) and 29% (being at work), respectively, for those who already had disability pension at the time of the assessment.
MPI profiles
The 3 scales at the very bottom of the profile (Fig. 1) present the probability for each patient of being classified into one of the 3 empirically-derived prototypic profiles on the MPI (dysfunctional, interpersonally distressed or adaptive coper) – or not prototypic. The algorithm for classification is provided in the commercially available computer program for analysis of the MPI data and is calculated according to the multivariate discriminate model developed and validated by Kerns et al. (25) and Turk & Rudy (26).
Ethical considerations
For data collection, the ethical principles of the World Medical Association Declaration of Helsinki were adhered to. The data were collected as part of the ongoing quality control of clinical care activities in the participating departments and the data stored with the consent of the National Swedish Data Inspection Agency (permission no1580-97). Informed consent was always received and participation was entirely voluntary (34). Data from the National Social Insurance Central Registry on social benefits were delivered to the registry as permitted by the Swedish Secrecy Act (Permission 10372/03 SSA).
Results
All in all, the patients were asked to answer 119 questions each and the team staff another 15.
At the start of the registry in 1998, 11 pain rehabilitation units participated. The number had grown to 23 in 2004 and decreased (mainly due to mergers between units) to 18 in 2007. The database included 1810 patients in 1999 and this number had grown to 11,803 in 2004 and to 19,833 in 2007 (Table I). Of these patients, 12,594 were assessed once only, usually for determining vocational capacity, creating 1 data-set for the registry. Furthermore, 7289 patients were assessed and had participated in rehabilitation programmes, creating 3 data-sets for the registry.
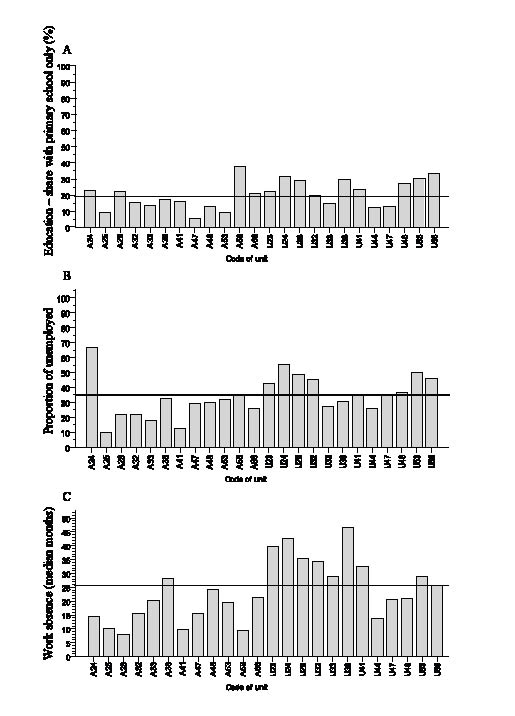
The mean demographic characteristics did not change appreciably over the years of data collection (Table I) and few data were missing from the first data-set. However, the analysis of the initial data-sets showed considerable variations in demographic profile of the patients between units, as regards educational level (6–38%; Fig. 2A), as well as concerning the proportion of unemployed (10–67%) and the time of absence from work (8–47 months) as is illustrated in Figs 2B and C.
Fig. 2. (A) Education – share with primary school only (%) at the assessment in 2007 (n = 2095). (B) Share of unemployed (%) (n = 2104). (C) Work absence in months (md) (n = 2104) in 2007. Solid line indicates mean. Bottom: A = Units with rehabilitation programmes; U = Units with assessment only; Numbers denotes specific units.
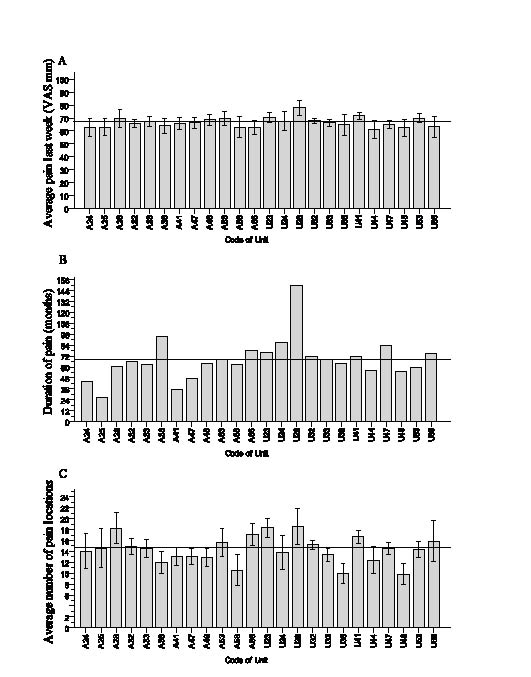
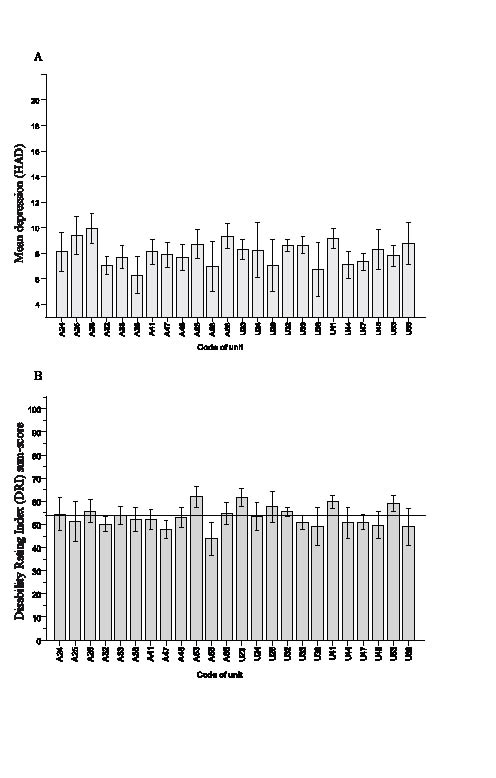
As regards pain characteristics, there was little variation between mean VAS pain intensities (Fig. 3A) and the overall mean pain intensity was high (68 mm). On the other hand, there were marked differences between patients referred to different centres as regards duration and distribution of pain (Fig. 3 B–C). Interestingly, none of the centres reported a mean number of pain locations of less than 10 in a single patient. When screening for emotional problems, several of the centres reported that the patients referred had a mean depression score (HAD) above the cut-off for “possible depression” (Fig. 4A). Most importantly, the patients included in the registry perceived pronounced activity limitations with a mean DRI sum-score of no less than 54 mm (Fig. 4B) and with little variation between centres.
Fig. 3. (A) Average pain last week (visual analogue scale (VAS) mm) (n = 2176). (B) Duration of pain in months (md) (n = 2104). (C) Average number of pain locations at the assessment in 2007 (n = 1208). Error bars, 95% confidence interval. Solid line indicates mean. A, U, Numbers, see text Fig. 2.
Fig. 4. (A) Mean depression score (Hospital Anxiety and Depression scale (HAD)) (n = 2052) at the assessment in 2007. Scores of 8–10 indicate possible depression and a score of 11 (or more) probable depression on HAD. (B) Mean disability Rating Index sum-score (DRI; n = 2165) at the same point in time. A normal population scores 6 mm or less. Error bars, 95% confidence interval. Solid line indicates mean. A, U, Numbers, see text Fig. 2.
Feedback of registry analyses to rehabilitation units
Annual reports containing analysed data with national means of the different instruments for all patients included in the registry are posted to all participating units, as is a corresponding overview of the data from the specific unit for comparison. The implications of the observed differences are discussed at annual meetings between local contact persons, medical directors and the registry administrators and regular internal audits are encouraged with the analysed data as a basis.
Missing data during one-year follow-up
Whereas few data are missing from the first data-set (Table I), this is so far not the case for the one-year follow-up data. In Table II, the average response rates are given for data from 3 instruments, “average pain intensity last week” (VAS), the DRI (12 VAS items) and the 61-item MPI questionnaire. It can be seen that whereas the second data-set (after rehabilitation) had a response rate of 83–88% for the instruments examined, the third data-set (the one year follow-up) had a rate of only 53–56%. When analysed further, this turned out to be due to severe lack of data from a limited number of participating rehabilitation units during extended time periods, whereas the majority of units did well.
| Table II. Response rate for data on average pain last week, Disability Rating Index (DRI) and Multidimensional Pain Inventory (MPI) during the period 1999–2007 |
| | At assessment n | After rehab n (%) | At 1-year follow-up n (%) | Maximum drop-out % |
| Pain (VAS) | 7210 | 6005 (83) | 3847 (53) | 47 |
| DRI | 7241 | 6401 (88) | 4055 (56) | 44 |
| MPI | 7277 | 6341 (87) | 4072 (56) | 44 |
| VAS: visual analogue scale (0–100). |
Discussion
As can be seen from the data-sets presented here, there are major differences among some characteristics of chronic pain patients referred to Swedish pain rehabilitation programmes. These differences are mainly contextual, which is remarkable considering that Sweden has uniform public social security and healthcare systems. They must be taken into account when attempting to compare outcomes from different programmes. Interestingly, however, both the impairments (mean pain intensity, number of pain locations, depression scores) and the mean perceived activity limitations vary little between centres, indicating that the thresholds for referral to these rehabilitation programmes are similar over the country. However, the duration of pain (Fig. 3B) and the time of absence from work before being admitted (Fig. 2C) vary considerably between the reporting units, indicating local variations in the referral process, both regarding selection mechanisms and resources.
We thus observe a large group of patients with chronic pain in the musculoskeletal system, presenting a varying demographic background, a scattered flora of symptoms, but with similar mean pain intensity and pronounced and similar perceived activity limitations (mean sum-score 54 mm; normal subjects score less than 6 mm (23)). Beyond the pain, perceived at an impressive mean intensity, the patient often complains of ill health, depression, anxiety, cognitive problems, difficulties in handling everyday problems, not least the vocational situation, and especially coping with pain and its consequences. The multitude of problems and the variation in composition thereof in a single person makes assessment as well as selecting adequate rehabilitative interventions complicated. Indeed, this adds considerably to the complexity of including homogenous cohorts in controlled outcome studies of pain rehabilitation.
The instruments and data selected for this registry represent a compromise, attempting to balance all the above aspects with a realistic chance of adequate collection. A complex blend of problems and disabilities related to pain in the musculoskeletal system is usually the cause of referral to pain rehabilitation and, therefore, influences the mix of patients referred. This, along with the multidimensional character of the rehabilitation process situation, adds a special need for outcome measures to guide and evaluate the rehabilitation process. When the registry was designed, the prevailing system for assessing functioning was the ICIDH (35) with its hierarchal structure, not taking into account the context of the person. All the same, we decided to include a large number of contextual components, since our rehabilitation experience clearly indicated these to be most important for the outcome. Today, the taxonomic situation is different, with the more recent concept of ICF (8, 36), emphasizing the context as an important domain.
Statistical interpretation of the registry data has to consider the large number of observations, resulting in that even minor differences pre - vs post-rehabilitation may be statistically significant at the group level. However, it is important to interpret such results in view of the clinical situation and to keep in mind or to determine what a minimum clinically important change is (37–38).
Against this background, the purposes of the national quality registry for pain rehabilitation are:
• To compare patient populations in different types of rehabilitation programmes to initiate a fact-based discussion of patient referral, selection and prioritization, i.e. resource utilization.
• To study the influence of patient characteristics on the outcome of functioning in different domains, including life satisfaction and return to work, i.e. the rehabilitation potential of the patient.
• To compare the effects of the rehabilitation process between differently designed rehabilitation programmes by compensating for the influence of differences in patient profile, i.e. the effectiveness of the rehabilitation programme (39).
• To analyse which outcome variables are used for the prospective assessment of work ability.
• To assess outcomes regarding the ability to support oneself by using data from the national insurance board registry of sick leaves and analyse predictive factors, i.e. clinical predictors.
It is hoped that future analyses will contribute to more well-founded knowledge in all of the above-mentioned aspects.
Limitations of the system are the relatively low number of variables assessing activities and that it was designed before the publication of the ICF (36), thus it does not contain an established instrument to assess participation. Furthermore, the reduction in response rate in the follow-up data is unacceptable. This influences the possibility to analyse the relationship between various factors of importance for long-term outcomes. This problem has been addressed both through direct advice to the local units on the administrative routines in managing the questionnaires and by discussions at the annual meetings for contact persons for the registry and for department managers. In addition, the high response rate in the first data-set, which is also needed to provide the assessment profiles (Fig. 1) for the team assessment, indicates that the data collection may improve by making the data instantly meaningful at the local level. For this to occur with the second two data-sets, a development process has been initiated whereby the registry will be accessed via the web with an on-line connection to allow instant analysis and follow-up comparisons at the local level at all 3 data collection points.
Another limitation of the registry is that assessment data (15 per patient) originate from many programmes and assessors. However, care is taken to collaborate annually to compare and discuss data.
Acknowledgements
The study was made possible by financial support from the Swedish Board of Health and Welfare, of Umeå University and of the Västra Götaland Region. The technical assistance of Annelie Inghilesi-Larsson, MSc, and professor Anders Odén, PhD, statisticians; Roger Salomonsson, software developer, Roland Hammeland, administrative secretary, and the contributions of members of the development and registry steering groups, Rolf Nordemar, MD, PhD, Margareta Fridén, OT, Marcelo Rivano, PhD and Britt Marie Stålnacke, MD, PhD, are gratefully acknowledged.
References