OBJECTIVE: To conduct a systematic review of the psychometric evidence relating to presenteeism scales in workers with musculoskeletal disorders.
METHODS: A structured search was conducted in 3 databases (MEDLINE, CINAHL, Embase) for articles published between 1966 and 2010. Sixteen articles met eligibility criteria. Pairs of raters used structured tools to analyse these articles through critical appraisal and data extraction. Descriptive synthesis of the psychometric evidence was then performed.
RESULTS: Methodological quality ratings of 56% of the studies reviewed reached a level of 75% or higher. Seven presenteeism scales were evaluated. Overall, presenteeism scales demonstrated acceptable validity content, were moderately to highly correlated (r > 0.50) to each other and to work- and disease-oriented constructs, and were able to differentiate between different populations and disability levels (p < 0.05). Limited evidence exists on the reliability and responsiveness of presenteeism scales, as reliability had only been evaluated for two scales and responsiveness in two studies.
CONCLUSION: None of the identified scales demonstrated satisfactory results for all evaluated psychometric properties. For most scales, data regarding properties such as reliability and responsiveness were insufficient. Therefore, there is no substantial evidence to recommend one questionnaire over the others based solely on psychometric properties.
Key words: musculoskeletal disorders; questionnaires; reliability; systematic review; validity, work.
J Rehabil Med 2011; 43: 23–31
Correspondence address: Jean-Sébastien Roy, Centre for Interdisciplinary Research in Rehabilitation and Social Integration, Quebec Rehabilitation Institute, 525, Boulevard Wilfrid-Hamel, Local H-1710, Québec (Qc), Canada, G1M 2S8. E-mail: jean-sebastien.roy@rea.ulaval.ca
Submitted April 29, 2010; accepted September 1, 2010
INTRODUCTION
Musculoskeletal disorders (MSD) can lead to work disability that may results in absence from work, time off work or loss of productivity (1). Worker productivity has been traditionally quantified by days absent from work, also called absenteeism. Recently, another concept called presenteeism has emerged as an important component of worker productivity. Presenteeism reflects the phenomenon of loss of work productivity in terms of quantity or quality of work done due to illness or injury in people who are present at their job (2–4) and is often referred as at-work productivity loss or at-work disability. However, conceptual frameworks and exact definition are continuing to evolve (5).
Monitoring of presenteeism is fundamental to fully assess worker’s disabilities or to supervise progress following medical interventions or rehabilitation (6). Yet, adequate measurement of presenteeism remains a challenge (5). Presenteeism scales have to show adequate validity, reliability and responsiveness to change to enable clinicians to use presenteeism for different clinical purposes. Although a number of presenteeism scales have been developed in the past decade (6, 7), limited evidence exists on the psychometric qualities of presenteeism scales. A systematic review published in 2007 on the psychometric properties of presenteeism scales for workers with MSD concluded that none of the scales identified had sufficient supporting psychometric evidence (6). In this review, 6 presenteeism scales were included and 8 published studies up to December 2006 were reviewed. Four of the reviewed studies were on the Work Limitations Questionnaire and each of the remaining 4 studies focused on 4 different scales. More methodologically sound studies were therefore recommended by the authors to further validate the presenteeism scales.
Since that systematic review (6), 4 new scales have been introduced, the number of studies on psychometric properties of presenteeism scales for MSD has doubled and recent studies have compared multiple scales with different populations or settings (8, 9). Furthermore, recent development of structured critical appraisal scales for analysing the quality of psychometric studies allows for a more structured approach (10). Critical appraisal is recognized as a fundamental component of systematic reviews. The previous review did not incorporate this key step because of a lack of critical appraisal scales. Hence, the previous review was a narrative review, not a systematic review. It is now possible to conduct a systematic review using validated critical appraisal scales to analyse both the quality and content of psychometric evidences. This should yield stronger conclusions on the current evidence supporting presenteeism scales for MSD. The purpose of this study was to conduct a systematic review of the quality and content of the psychometric evidence for presenteeism scales for workers with MSD.
METHODS
Literature search and study identification
A search in 3 databases, MEDLINE, CINAHL and Embase, was performed using the key words used by Williams et al. (6) in their review: [(musculoskeletal diseases or musculoskeletal injury) and (work or work capacity or work resumption or work disability) and questionnaires and (disability evaluation or employment) and (psychometrics or validity or reliability)]. Thereafter, 7 presenteeism scales were included. Four of these scales were not included in the review by Williams et al. (6). A second search was performed using the presenteeism scales included as key words: [(Stanford Presenteeism Scale or Work Instability Scale or Work Limitations Questionnaire or Work Role Functioning or Endicott Work Productivity Scale or Workplace Activity Limitations Scale) and (reliability or validity or responsiveness or minimal detectable change or clinically important difference or Rasch or factor analysis or translation or validation)]. Manual searches of retrieved study reference lists were also conducted. Articles published between 1966 and June 2010 were included.
Data extraction and quality assessment
The abstract of each article was reviewed by the authors to determine eligibility. Then, pair of raters independently reviewed each article that met the following inclusion criteria: (i) evaluated self-report health-related presenteeism scale, (ii) reported on at least one psychometric property, (iii) written in French or English, (iv) included workers with MSD, (v) evaluated scale not specific to anatomical region or profession. Structured data extraction form and critical appraisal scale were used. The critical appraisal scale rates 12 items on a scale of 0–2 (Table I) and a percentage score is calculated (10). Excellent pre-consensus inter-rater reliability (intraclass correlation coefficient (ICC): 0.82–0.91) has been demonstrated for the scale across a number of systematic reviews (11–13). Pairs of raters independently evaluated an assigned subset of articles using the data extraction form and critical appraisal scale. After the independent evaluation, raters met to compare ratings and resolve differences. A structured consensus process was used that involved: first re-checking of the facts in the text; secondly, a discussion of the adherence to standards; and, thirdly, use of an independent third evaluator if consensus was not achieved. Each total score was converted into a percentage. Weighted kappa was used to calculate pre-concensus inter-rater agreement on individual items and ICC to evaluate inter-rater reliability of the total score. There was no formal mechanism to exclude studies on the basis of quality, since understanding the scope of psychometric properties across different contexts is essential to a full understanding of the overall quality and utility of an instrument. However, studies were rank ordered for quality. Definitions of the psychometric properties extracted for this systematic review are presented in Table II (11, 14, 15).
| Table I. Quality of studies on the psychometric properties of presenteeism scales |
| Study number in Table III | Authors | Item Evaluation Criteriab (maximum = 2; minimum = 0) | Total (%) |
| 1 | 2 | 3 | 4 | 5 | 6 | 7 | 8 | 9 | 10 | 11 | 12 |
| 14 | Beaton et al. 2010 | 2 | 2 | 2 | 2 | 2 | 1 | 2 | 1 | 2 | 2 | 2 | 2 | 92 |
| 3 | Lerner et al. 2002 | 2 | 2 | 2 | 2 | 1 | N/A | 2 | 2 | 2 | 2 | 1 | 2 | 91 |
| 15 | Tang et al. 2010 | 1 | 2 | 2 | 2 | 2 | 1 | 2 | 1 | 2 | 2 | 2 | 2 | 88 |
| 16 | Tang et al. 2010 | 2 | 2 | 1 | 2 | 1 | 1 | 2 | 1 | 2 | 2 | 2 | 2 | 83 |
| 5 | Durand et al. 2004 | 2 | 2 | 2 | 2 | 0 | N/A | 2 | 1 | 2 | 2 | 1 | 2 | 82 |
| 13 | Tang et al. 2009 | 2 | 2 | 2 | 2 | 0 | N/A | 2 | 1 | 2 | 2 | 1 | 2 | 82 |
| 6 | Turpin et al. 2004 | 2 | 1 | 1 | 2 | 2 | N/A | 2 | 2 | 2 | 2 | 1 | 1 | 82 |
| 8 | Gallasch et al. 2007 | 2 | 2 | 1 | 2 | 1 | N/A | 2 | 1 | 2 | 2 | 1 | 1 | 77 |
| 1 | Lerner et al. 2001 | 1 | 2 | 2 | 2 | 1 | N/A | 1 | 1 | 2 | 2 | 1 | 2 | 77 |
| 11 | Gilworth et al. 2009 | 2 | 1 | 1 | 1 | 0 | N/A | 2 | 2 | 2 | 2 | 2 | 1 | 73 |
| 2 | Koopman et al. 2002 | 1 | 1 | 1 | 2 | 1 | N/A | 2 | 1 | 2 | 2 | 1 | 1 | 73 |
| 7 | Walker et al. 2005 | 2 | 1 | 1 | 1 | 1 | N/A | 2 | 2 | 2 | 2 | 0 | 1 | 68 |
| 10 | Yamashita et al. 2008 | 1 | 2 | 1 | 2 | 1 | N/A | 1 | 2 | 2 | 2 | 0 | 1 | 68 |
| 12 | Macedo et al. 2009 | 2 | 1 | 1 | 0 | 0 | N/A | 2 | 2 | 2 | 2 | 1 | 2 | 64 |
| 4 | Gilworth et al. 2003 | 1 | 2 | 1 | 2 | 1 | 0 | 2 | 1 | 2 | 1 | 1 | 1 | 63 |
| 9 | Gignac et al. 2008a | 0 | 2 | 0 | 0 | 1 | N/A | 2 | 2 | 2 | 2 | 0 | 0 | 50 |
| N/A: not applicable to paper. aDenotes paper where evaluation of the presenteeism scales were performed while the primary purpose was not to evaluate psychometric properties, quality scores were rated in content for the evaluation of psychometric properties. bItem 1: thorough literature review to define the research question; Item 2: specific inclusion/exclusion criteria; Item 3: specific hypotheses; Item 4: appropriate scope of psychometric properties; Item 5: sample size calculation/justification; Item 6: appropriate retention/follow-up; Item 7: authors referenced specific procedures for administration, scoring and interpretation of procedures; Item 8: measurement techniques were standardized; Item 9: data was presented for each hypothesis; Item 10: appropriate statistics-point estimate; Item 11: appropriate statistical error estimates; Item 12: valid conclusions and clinical recommendations. |
| Table II. Definitions of psychometric properties |
| Psychometric properties | Definition |
| Validity | |
| Content validity | The extent to which the domain of interest is adequately sampled by the items in the scale. |
| Floor–ceiling effect | The extent to which scores cluster near the less (floor)/more (ceiling) desirable health state extreme on the scale. |
| Factorial validity | The extent to which a factor analysis supports the interrelationship between a set of items on a scale and the domains or the constructs theoretically measured by the scale or by subscale structure. |
| Construct validity | The extent to which a scale performs according to a priori defined constructs. |
| Known-group validity | The extent to which a scale discriminates between a group of individuals known to have a particular trait and a group who do not have the trait. |
| Predictive validity | The extent to which a scale can forecast the outcomes at later points in time. |
| Reliability | |
| Test–retest reliability | The extent to which a scale is stable and produces similar results when administered repeatedly. |
| Intraclass correlation coefficient (ICC) | A measure of relative reliability; variance owing to the objects of measurement divided by the total variance (coefficient: –1 to 1). ICC were considered poor < 0.20; fair from 0.21 to 0.40; moderate from 0.41 to 0.60; good from 0.61 to 0.80; excellent > 0.81. |
| Standard error of the measure (SEM) | A measure of absolute reliability; represents the standard deviation (SD) of measurement errors. |
| Minimal detectable change (MDC) | An estimate of the smallest change in score that can be detected by a scale regarding a patient. |
| Internal consistency: | The extent to which items on a scale or subscale are homogeneous and measure various aspects of the same construct. Cronbach’s alpha > 0.70 and < 0.90 or Kuder-Richardson Formula 20 ≥ 0.90 is deemed acceptable at the group level. |
| Item-to-total correlation | An estimate of the correlation between the question score and the overall score of the scale. Item-to-total correlations > 0.3 for individual scale items are desirable. |
| Responsiveness | The extent to which a scale has the ability to assess clinically important change over time. |
| Effect size (ES) | Mean change in score divided by the SD of the pre-treatment score. ES were considered large ≥ 0.8, moderate between 0.5–0.8, and small between 0.2–0.5. |
| Standardized response mean (SRM) | Mean change in score divided by the SD of the change in score. |
| Clinically important difference (CID) | The smallest change that represents an important difference for the patient. |
Description of the presenteeism scales included
Endicott Work Productivity Scale (EWPS) assesses the degree to which a medical condition affects work functioning (8, 16). It covers 4 domains: attendance, quality of work, performance capacity, and personal factors (8). The 25 items are rated on a 5-point scale of how often the behaviour, feeling or attitude has been manifested (16). The total score ranges from 0 to 100 (lowest productivity).
The 6-item Stanford Presenteeism Scale (SPS-6) measures the impact of a worker’s perceived ability to concentrate on work tasks despite the distractions of health impairments and pain (4, 9). It consists of 6 questions on a 5-item Likert scale. The SPS-6 total score is the sum of the values of the items, and ranges from 6 to 30 (peak performance) (4).
The 13-item Stanford Presenteeism Scale (SPS-13) provides information on the health condition most likely to affect productivity (17). The degree of impairment experienced from the primary health condition is evaluated with the Work Impairment Score, which is the sum of responses to 10 Likert-type questions (0–100). Then, the percentage of usual productivity that the worker is able to achieve is assessed using a single item on a 100-point scale: the Work Output Score. Finally, hours of absenteeism experienced over the past 4 weeks are outlined.
The Workplace Activity Limitations Scale (WALS) is an 11-item scale that asks about employment activity limitations (18, 19). Items include getting to, from, and around the workplace; sitting/standing for long periods; lifting; reaching; and the schedule and pace of work (19). Responses are on a 4-point Likert-type scale and summed with scores ranging from 0 to 33 (greater difficulties at work).
Work Instability Scale (RA-WIS) assesses potential mismatch between workers’ functional abilities and job demands (20). The RA-WIS consists of 23 questions with dichotomous (yes/no) response options. The scale is scored by summing all 23 items. Scores can range from 0 to 23 (higher risk of work disability).
The 25-items Work Limitations Questionnaire (WLQ-25) asks respondents to rate their levels of difficulty or ability to perform specific job demands grouped into 4 types of demands: Time-Management, Physical-Demands, Mental-Interpersonal-Demands and Output-Demands (21, 22). Scores are derived by averaging all item responses (scored 0–4) and multiplying by 25.
The Work Role Functioning Questionnaire (WRFQ) assesses the degree to which a worker is experiencing on-the-job limitations due to health problems (23, 24). It includes 27 items divided into 5 scales: Work-Scheduling-Demands, Physical-Demands, Mental-Demands, Social-Demands and Output-Demands. Items are scored on a 5-level response scale. Each scale is scored separately, by adding the response of each item, and is converted to a score varying from 0 to 100 (never limited) (25).
RESULTS
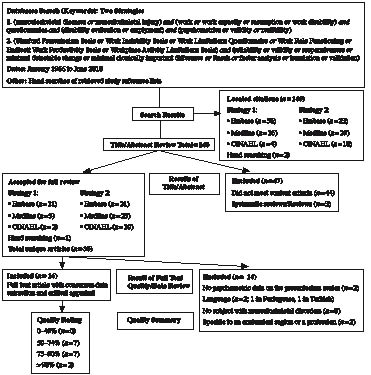
A total of 16 articles met all inclusion criteria and were included (Fig. 1; Table III). Only 5 of these studies were included in the review by Williams et al. (6). The quality of the individual studies ranged from 50% to 92%; with 56% of papers reaching or exceeding a score of 75% on the quality rating (Table I). Overall inter-rater reliability of the critical appraisal tool was excellent (ICC = 0.91; 95% confidence interval = 0.76–0.97), with agreement on individual item ranging from good to excellent (κ = 0.62–1.00), except for item 8 (standardization of measurement techniques) which was poor (κ = 0.18).
Fig. 1. Systematic review evidence flowchart. CINAHL: Cumulative Index to Nursing and Allied Healrth Literature.
| Table III. Summary of studies addressing psychometric properties of presenteeism scales |
| Study | Scale(s) evaluated | Population | n | Properties evaluated |
| 1. Lerner et al. (2001) (21)a | WLQ-25 | Employed individuals from several chronic condition groups. | 48/121 | Validity, reliability |
| 2. Koopman et al. (2002) (4) | SPS-6 | Employees with health problem from 6 occupational risk category levels. Mean age = 47 years, 52% men. | 164 | Reliability, validity |
| 3. Lerner et al. (2002) (22)a | WLQ-25 | Patients with osteoarthritis (OA) from divisions of rheumatology, immunology and orthopaedics of a medical centre. Mean age = 54 years, 35% men. | 230 | Validity |
| 4. Gilworth et al. (2003) (20) | RA-WIS | Workers with rheumatoid arthritis (RA) recruited from rheumatology clinics. Qualitative interviews for item generation: mean age = 40 years, 45% men. Postal questionnaire: mean age = 44 years, 27% men. | 49/206 | Validity, reliability |
| 5. Durand et al. (2004) (25)a | WRFQ | Workers with musculoskeletal disorders (MSD) receiving work rehabilitation services. Mean age = 41 years; 53% men. | 40 | Translation, reliability, validity |
| 6. Turpin et al. (2004) (17) | SPS-13 | Employees at a large research and manufacturing corporation with multiple facilities throughout the USA. | 7797 | Reliability, validity |
| 7. Walker et al. (2005) (26)a | WLQ-25 | Employees with RA recruited from the practices of 915 rheumatologists. Mean age = 53 years; 23% men. | 836 | Reliability, validity |
| 8. Gallash et al. (2007) (24) | WRFQ | Pre-test: 30 patients with MSD receiving physiotherapy treatment. 105 patients from a physiotherapy department with chronic MSD. | 30/105 | Translation, reliability, validity |
| 9. Gignac et al. (2008) (19) | WALS | Individuals with RA or OA recruited from community advertisements and rheumatology and rehabilitation clinics. Mean age = 51 years; 22% men. | 490 | Reliability |
| 10. Yamashita et al. (2008) (28) | SPS-13 | Female employees affiliated with a trade-union. | 359 | Reliability, validity, translation |
| 11. Gilworth et al. (2009) (30)a | RA-WIS | Patients with RA from 3 countries: France (n = 75, mean age = 46 years, 21% men), Netherland (n = 85, mean age = 45 years, 27% men) and Germany (n = 73, mean age = 43 years, 28% men). | 306 | Translation, validity |
| 12. Macedo et al. (2009) (31) | RA-WIS | Workers with RA attending specialized inflammatory arthritis clinics. Mean age = 48 years; 22% men. | 90 | Validity |
| 13. Tang et al. (2009) (9) | RA-WIS, SPS-6 | Workers who attended a shoulder and elbow specialty clinic. Mean age = 43 years; 54% men. | 80 | Reliability, validity |
| 14. Beaton et al. (2010) (8) | RA-WIS, SPS-6, WLQ-25, EWPS, WALS | Workers with RA and OA from rheumatology clinics and outpatient arthritis treatment programme. Mean age = 51 years; 17% men. | 250 | Reliability, validity, responsiveness |
| 15. Tang et al. (2010) (29) | RA-WIS, | Workers with OA from rheumatology clinics and outpatient arthritis treatment programme. Mean age = 54 years; 20% men. | 130 | Reliability, validity, responsiveness |
| 16. Tang et al. (2010) (32) | RA-WIS, | Workers with RA and OA from rheumatology clinics and outpatient arthritis treatment programme. Mean age = 51 years; 17% men. | 250 | Validity |
| aArticles included in the systematic review by Williams et al. (6). WLQ-25: 25-items Work Limitations Questionnaire; SPS-6: 6-item Stanford Presenteeism Scale; RA-WIS: Work Instability Scale; WRFQ: Work Role Functioning Questionnaire; WALS: Workplace Activity Limitations Scale; EWPS: Endicott Work Productivity Scale. |
Validity
Content validity. Overall, presenteeism scales demonstrated acceptable validity content despite evidence for some scales that items may not apply to all individuals and scores are affected by demographics. For the Work Impairment Score of SPS-13, Turpin et al. (17) have shown significant differences across sex and age, with men claiming slightly less impaired presenteeism and a trend for less reported impaired presenteeism with increasing age of employees. Walker et al. (26) have shown that some WLQ-25 items are often missing, such as “lifting”, “repetitive activities”, and “difficulty thinking clearly” (15–22%) (26). Beaton et al. (8) have also mention that the lack of applicability of some items to the person’s job is problematic in the WLQ-25 Physical-Demands, leading to a high rate of missing data.
Floor-ceiling effect. Floor-ceiling effects have been observed only for the subscales of WRFQ and WLQ-25. Floor effect, as indicated by 15% or more of the participants achieving the lowest possible scores (27), was shown for the Mental-Demands (33%) and Social-Demands (35%) scales of WRFQ (25). In most of the studies evaluating WLQ-25, a floor effect was observed for the subscales varying from 13% to 36% (8, 21, 22). Floor-ceiling effect has not been evaluated for the SPS-13.
Factorial validity. Overall, studies suggest that presenteeism is not a unidimensional concept and are insufficient to validate the current structure of a number of scales. Koopman et al. (4), using factor analysis, found two dimensions for the SPS-6. Turpin et al. (17) and Yamashita et al. (28), using factor analysis, also observed two dimensions for the Work Impairment Score of the SPS-13. For these two SPS versions, the first factor (“Completing Work”) included the positively worded items, while the second factor (“Avoiding Distraction”) included the negatively worded items. The dimensional structure of the WLQ-25 has been evaluated in two studies that found contrasting results. Using MAP-R software to determine whether the WLQ-25 met the scaling assumptions, Lerner et al. (21) determined that 4 subscales were present. Walker et al. (26) extracted 3 factors (eigenvalues > 1) in factor analysis with all the items loading highly on the first factor (> 0.50). According to Walker et al. (26), the second factor (loading of 0.41–0.45) appeared to identify a mental domain, while the third factor (loadings between 0.40 and 0.44) identified finishing work and working without mistakes. The dimensional structure of EWPS, RA-WIS, WALS and WRFQ has not been evaluated with factor analysis. However, for RA-WIS, Gilworth et al. (20) identified 23 items on a single construct of work instability using the Rasch model in patients with rheumatoid arthritis (RA); therefore suggesting unidimensionality. Furthermore, analysis performed by Tang et al. (29) showed that RA-WIS achieved adequate fit to the Rasch model in its original 23-item form; also supporting unidimensionality for RA-WIS in workers with osteoarthritis (OA).
Construct validity. Evidence on construct validity supports that presenteeism scales are distinct from, but somewhat related to, health constructs. Beaton et al. (8) have evaluated the correlation between EWPS, SPS-13, RA-WIS, WALS and WLQ-25. High correlations were observed between RA-WIS and WALS (r = 0.77), while moderate correlations (0.55 ≤ r ≤ 0.69) were obtained between the other presenteeism scales. Low to moderate correlations were also observed between WLQ-25, SF-36 and SPS-13 (17, 26). In workers with RA or OA, low to moderate correlations (0.30 ≤ r ≤ 0.70) were observed between EWPS, SPS-13, RA-WIS, WALS and WLQ-25 and work-oriented and disease-oriented constructs, except for RA-WIS and WALS for which moderate to high correlations were obtained (8). In workers with OA, RA-WIS achieved moderate to high correlations to both work-oriented (r = 0.55–0.77) and disease-oriented (r = 0.70–0.79) constructs (29).
Known-group validity. Overall, limited evidence exists, but supports the ability of presenteeism to differentiate between different subgroups within injured worker populations (Table IV). According to Beaton et al. (8), RA-WIS demonstrated the strongest known-group validity in differentiating workers experiencing varying levels of arthritis hindrance to work when compared with WALS, SPS-6, EWPS and WLQ-25, while according to Tang et al. (9), SPS-6 is slightly stronger than RA-WIS in differentiating workers working normal hours to those working reduced hours.
| Table IV. Known-groups validity |
| Questionnaire | |
| EWPS | Detected differences between workers experiencing varying levels of arthritis hindrance to work (F = 40.8; p < 0.05) (8) |
| SPS-6 | Detected differences between: Workers experiencing varying levels of arthritis hindrance to work (F = 55.2; p < 0.05) (8) Employees reporting (mean score = 21.0) and not reporting a disability (mean score = 23.5) (p < 0.001) (4) Workers with elbow and shoulder disorders working reduced hours and full hours (t = 2.98; p < 0.05) (9) |
| SPS-13 | The Work Impairment Score of the SPS-13 detected differences between: Workers with arthritis/joint pain in knowledge-based jobs (mean score = 18.7) and in production-based jobs (mean score = 22.5) (t = 3.18; p = 0.002) (17) Workers with knowledge-based jobs (mean score = 20.4) and with production-based jobs (mean score = 22.7) (p < 0.001) (17) |
| WALS | Detected differences between workers experiencing varying levels of arthritis hindrance to work (F = 68.9; p < 0.05) (8) |
| RA-WIS | Detected differences between: Workers with osteoarthritis (OA) and rheumatoid arthritis experiencing varying levels of arthritis hindrance to work (F = 105.1; p < 0.05) (8) Workers with elbow and shoulder disorders working reduced hours and full hours (t = 2.96; p < 0.05) (9) Workers with OA experiencing varying levels of arthritis hindrance to work (F = 70.0; p < 0.05) (29) |
| WLQ-25 | Detected differences between: Workers experiencing varying levels of arthritis hindrance to work (F = 51.8; p < 0.05) (8) Employed individuals with chronic conditions and control subjects (on each WLQ-25 scale; p < 0.05) (21) Workers with OA and control subjects for the Physical Demands scale (OA = 22.7; controls = 8.5; p = 0.0001), Time Management scale (OA = 28.5; controls = 10.6; p = 0.002), and Output Demands scale (OA = 21.2; controls = 8.8; p = 0.014) (22) Workers with back OA and other subgroups (hand, knee, neck and hip) with OA for the Physical Demands (back = 30.9; other = 21.4–27.8; p < 0.05) and Output Demands scales (back = 27.5; other = 17.9–26.7; p < 0.05) (22) Workers who rated their osteoarthritis as “very good” from those rating it as “good” (p < 0.05) (22) |
| WRFQ | Detected differences between: Workers receiving work rehabilitation services and workers from the chemical industry for each WRFQ scale, except for the Social demands scale (p ≤ 0.02) (25) Workers with and without musculoskeletal symptoms for the Work scheduling (with = 70.3, without = 89.2), Physical (with = 71.4, without = 83.8), and Output demands subscales (with = 60.3, without = 87.7) (p < 0.001) (24) |
| EWPS: Endicott Work Productivity Scale; SPS-6: 6-item Stanford Presenteeism Scale; WALS: Workplace Activity Limitations Scale; RA-WIS: Work Instability Scale; WLQ-25: 25-items Work Limitations Questionnaire; WRFQ: Work Role Functioning Questionnaire. |
Predictive validity. Higher baseline RA-WIS (score > 18) was found to be predictive of impending work transitions (relative risk = 1.05, p = 0.04) within 12 months (32). Work transition was defined as composite of 4 types of work transition: reductions in work hours, disability leaves of absence, changes in job/occupation, temporary unemployment. An optimal predictive cut-point > 13 (sensitivity = 51%, specificity = 83%) was determined for predicting work transition. Furthermore, a score of 10 or more on the RA-WIS was shown to have 82% sensitivity to the need for workplace modifications, a score of 17 or more gave 95% specificity (20).
Reliability
Test-retest reliability. Very limited evidence exists on the test-retest reliability of presenteeism scales. In fact, it has only been evaluated in MSD populations for RA-WIS and WRFQ (Table V). Gilworth et al. (20) evaluated test-retest reliability of RA-WIS using Spearman’s rho and found r = 0.89. However, no ICCs were presented. Gallasch et al. (24) shown that 4 of the 5 scales of WRFQ have excellent reliability with ICC > 0.82, while Mental-Demands scale has good reliability with ICC = 0.68. Minimal detectable change (MDC) was not reported for any of the scales. Test-retest reliability has been evaluated for EWPS, but only in workers with depression (ICC = 0.92) (16).
| Table V. Reliability and responsiveness of presenteeism scales for musculoskeletal populations |
| | | EWPS | SPS-6 | SPS-13 | WALS | RA-WIS | WLQ-25 | WRFQ |
| ICC | Range | N/D | N/D | N/D | N/D | N/D | N/D | 0.68–0.91a |
| | # of subjects | | | | | | | 105 |
| | # of studies | | | | | | | 1 |
| SEM | Range | N/D | N/D | N/D | N/D | N/D | N/D | N/D |
| MDC | Range | N/D | N/D | N/D | N/D | N/D | N/D | N/D |
| Cronbach’s α or KR-20‡ | Range | 0.94 | 0.71–0.80 | 0.82–0.87b | 0.78–0.87 | 0.86–0.93d | 0.77–0.97c | 0.57–0.93c |
| | # of subjects | 250 | 494 | 8156 | 663 | 460 | 1437 | 145 |
| | # of studies | 1 | 3 | 2 | 2 | 3 | 4 | 2 |
| EWPS: Endicott Work Productivity Scale; SPS-6: 6-item Stanford Presenteeism Scale; SPS-13: 13-item Stanford Presenteeism Scale; WALS: Workplace Activity Limitations Scale; RA-WIS: Work Instability Scale;WLQ-25: 25-items Work Limitations Questionnaire; WRFQ: Work Role Functioning Questionnaire; ICC: intraclass correlation coefficient; SEM: standard error of the measure; MDC: minimal detectable change; N/D: not defined; KR-20: Kuder-Richardson Formula 20. aRange of the ICC for the 5 subscales of the WRFQ. bFor the Work Impairment Score subscale of the SPS-13. cFor the subscales of the WLQ-25 and WRFQ. dKR-20 was used for the RA-WIS. |
Internal consistency. Except for EWPS and 1 subscales of WRFQ, acceptable ranges of Cronbach’s alpha or Kuder-Richardson Formula-20 were observed (Table V). For SPS-6, SPS-13, WALS, and for most of the studies evaluating WLQ-25, Cronbach’s alpha ranged between 0.71 and 0.92. For the EWPS and for one study on WLQ-25 evaluating workers with OA (22), Cronbach’s alpha were higher than the desirable value (> 0.93). For WRFQ, the Social-Demands scale has lower than desirable Cronbach’s alpha (≤ 0.66) (24, 25).
Item-to-total correlation. For all the presenteeism scales, except for SPS-6 and SPS-13, item-to-total correlation values for each item were above 0.3. For SPS-6, item-to-total correlation lower than 0.3 was shown for item 4 (“Feel hopeless about tasks”) (9). Item-to-total correlation has not been evaluated for SPS-13.
Responsiveness
Very limited evidence exists on the responsiveness of presenteeism scales since it has only been evaluated in two studies. Beaton et al. (8) have used two self-rated global indicators of change (work ability, work productivity) to evaluate the responsiveness of EWPS, SPS-6, WALS, RA-WIS and WLQ-25 in workers with OA and RA. In those who improved their work ability, responsiveness indices (effect size (ES) and standardized response mean (SRM)) were moderate for WALS, small to moderate for SPS-6 and RA-WIS, and small for EWPS and WLQ-25. In workers who improved their work productivity, small to moderate responsiveness was observed for WLQ-25, and small responsiveness was observed for SPS-6, WALS, and RA-WIS. In workers who felt their work ability was deteriorated, responsiveness indices were moderate for WALS and EWPS, small to large for RA-WIS and small for SPS-6. The WLQ-25 was considered non-responsive. Responsiveness indices were small for EWPS, SPS-6 and WALS in workers who felt their work productivity deteriorated. Tang et al. (29) have used 3 self-rated global indicators of change (work ability, work productivity and intrusiveness of arthritis on work) to evaluate the responsiveness of RA-WIS in workers with OA. For improvements, moderate to high indices were observed, with changes in work productivity ranked the highest (SRM = 0.80). For deteriorations, RA-WIS was highly responsive in intrusiveness of arthritis on work (SRM = 1.12), exceeding the other two constructs (SRM = 0.71/0.06 for work ability/productivity). Effect size and SRM have not been defined for the SPS-13 or WRFQ. No reports of clinically important difference (CID) were found for any of the scales.
Administration burden, language and cultural translation
Administration burden refers to the time taken to complete a scale or the time taken to analyse the results. No reports of the administration burden for the presenteeism scales were found. The EWPS has been translated in Turkish (33), SPS-13 in Japanese (28), RA-WIS in French, Dutch and German (32), WLQ-25 in Brazilian Portuguese (34), and WRFQ in Canadian-French and Brazilian Portuguese (24, 25). Overall, English and all translated versions were comprehensive and had items that were easy to understand (9, 24, 25, 28, 30).
DISCUSSION
This systematic review focused on evaluating the quality and content of the psychometric properties of presenteeism scales for workers with MSD. Sixteen studies met the eligibility criteria. The methodological quality was adequate for the majority of the studies as 9 out 16 of papers exceeded a score of 75%. Seven presenteeism scales were evaluated. RA-WIS was the most often studied scale with 7 studies; 4 of these studies were among the highest in terms of quality. Compared with the review by Williams et al. (6), 4 new scales were introduced (SPS-6, SPS-13, EWPS, WALS) and 11 new articles reviewed. Furthermore, all of the scales, except EWPS, had more than one study evaluating its psychometric properties, compared with only WLQ-25 in the previous review. Therefore, our systematic review provides a more comprehensive and accurate view of the measurement properties of these scales.
None of the identified scales demonstrated satisfactory results for all evaluated psychometric properties. For most scales, data regarding properties such as reliability and responsiveness were insufficient. These properties are fundamental when appraising the quality of a questionnaire. Therefore, there is no substantial evidence to recommend one questionnaire over the others based solely on psychometric properties. However, RA-WIS is the only presenteeism scale with clinically acceptable responsiveness indices and predictive abilities. Furthermore, in studies evaluating multiple scales, it has been one of the top performers in terms of validity and responsiveness (8, 9). Since the RA-WIS has limited published reliability statistics, it is recommended with caution, pending additional psychometric studies.
Content validity was acceptable for all presenteeism scale, although WLQ-25 tended to have more missing data and the applicability of some items may be potentially questionable for some workers or setting. None of the scales included in this study showed a floor-ceiling effect. However, subscales of WRFQ and WLQ-25 showed problems with floor effects and therefore the use of only one of these subscales alone is not warranted. Contrasting results have been observed for the dimensional structure of WLQ-25. Therefore, additional studies are needed to inform our understanding of the structure of WLQ-25. Rasch analysis support unidimensionality for RA-WIS. The factorial structure of EWPS, WALS, and WRFQ still need to be defined.
Mostly moderate relationships (0.5 < r < 0.7) were observed between the presenteeism scales (8, 9, 17, 26). This is not entirely surprising given conceptual differences between these measures. Escorpizo et al. (35) have described the content of presenteeism scales using the International Classification of Functioning Disability and Health (ICF) as reference. They found that most items of presenteeism scales are related to activities limitations and participation restrictions and body functions; but that the emphasis of these concepts is variable between scales. For WALS, WLQ-25 and WRFQ most of the items are related to activities limitations and participation restrictions, for RA-WIS most items are related to body functions, whereas for EWPS, SPS-6 and SPS-13, items are balanced between the two categories. Of note, the two scales that were the most highly correlated, RA-WIS and WALS (r = 0.77) (8), have highly variable content according to ICF classification; suggesting that other factors may contribute to this relationship. Concordance in item difficulty, response structures and level of cognitive evaluation required to interpret items may contribute to the relationship between different measures. Given the established differences in content and emphasis between presenteeism scales, content relevance would be one factor in determining whether a specific scale is appropriate for any given application. Other aspects might also lead clinicians to choose a specific scale. For example, RA-WIS provides benchmarks for workers with RA: low risk of work disability < 10, medium risk = 10–17, and high > 17 (20) and has been shown to have predictive abilities (30); whereas the WLQ-25 can be converted into an estimate of productivity loss, thus permitting an immediate interpretability of the scale and the calculation of economic burden.
Test-retest reliability is a prerequisite to using presenteeism scales in longitudinal clinical studies. Only the test-retest reliability of WRFQ has been defined using ICC in MSD populations (24). EWPS has been addressed but in a population with depression. Although depression may have affected the individual’s interpretation of their work disability, reliability estimates may still be generalizable. Indicators of reliability that apply to the interpretation of individual results such as MDC are absent from the literature. These parameters would assist clinicians to evaluate change in work ability over time based on quantitative criteria.
Responsiveness to change has been evaluated in only two studies. In the study by Beaton et al. (8) small to moderate responsiveness indices were observed for presenteeism scales. Based on a summation of rankings, they concluded that, in terms of responsiveness in work ability, WALS was the stronger performer, followed by RA-WIS, whereas in terms of responsiveness in work productivity, SPS-6 was the most consistent performer, followed by WALS (8). A single scale did not emerge as clearly superior to the others since responsiveness indices were variable according to the construct used. Even though the responsiveness indices reported were low, it should not be concluded that presenteeism scales are not responsive. Responsiveness indices are dependent on the size of the clinical effect observed and thus vary across populations and interventions. Since the populations studied by Beaton et al. (8) had chronic MSD, small changes over time would be anticipated. In contrast, Tang et al. (29) found moderate to high responsiveness indices for RA-WIS following improvement on 3 work-related global indicators of change in workers with OA. Therefore, based on responsiveness, RA-WIS should be favoured when evaluating change in time in workers with OA. Studies in more acute populations are still needed to fully understand the responsiveness of presenteeism scales.
A limitation of this systematic review is that two articles had to be excluded because they were written in Portuguese and Turkish (31, 33). A second limitation is that we decided to exclude scales specific to an anatomical region in order to review those that can be used with any MSD. Therefore, two scales evaluated by Williams et al. (6) in their review, the Functional Abilities Confidence Scale (36) and Occupational Role Questionnaire (37), were excluded since they are specific to low back pain. Of note, since the review by Williams et al. (6) no other psychometric studies have been published on these scales. WLQ-16 (9, 38) was excluded because it is a version of WLQ-25 that was later changed and called the WRFQ. Finally, an 8-item version of WLQ-25 is also available; however, no psychometric properties were found for this version.
In conclusion, presenteeism scales provide a useful perspective on injured workers, since they focus specifically on the difficulties that workers encounter in their jobs. A number of presenteeism scales have been developed, and these scales vary in terms of content and performance. There is currently insufficient evidence on important psychometric properties to enable definitive determinations to be made about which instruments are preferable. However, the psychometric properties of RA-WIS have been evaluated in high-quality studies, and have shown very promising results in terms of validity and responsiveness. If good reliability is demonstrated in future studies, RA-WIS would be an adequate choice in terms of psychometric properties to measure presenteeism. Future research should focus on the lack of evidence on reliability and responsiveness of existing scales. Application for individual clients/patients is limited by the lack of data on MDC and CID. Given the importance of presenteeism, it is important to continue work on validating presenteeism scales to ensure that adequate psychometric properties are established across a variety of populations.
ACKNOWLEDGEMENTS
J.-S. Roy is supported by training fellowships from the Fonds de recherche en Santé du Québec and Canadian Institute of Health Research. F. Desmeules is supported by training fellowships from the Fonds de recherche en Santé du Québec and the Chair sur la gouverne et transformation des organisations de santé (GETOS).
REFERENCES