OBJECTIVE: To investigate the internal construct validity of the Rivermead Post-Concussion Symptoms Questionnaire (RPQ) by Rasch analysis of data from a national cohort of patients with mild traumatic brain injury.
Methods: Data collected at 3 months after mild traumatic brain injury from 2,523 patients were analysed using the partial credit model, describing rating scale structure, local dependency, age and gender differential functioning, dimensionality and model fit.
RESULTS: Categories did not work in a consistent manner; however, collapsing of Categories 1 and 2 yielded ordered thresholds. Local dependency of items was present and 2 item pairs were combined. There was no differential item functioning by gender or age. The Rasch factor explained 47.7% of the variance and the first contrast explained 12.4% of the unexplained variance (eigenvalue 1.9). Further analysis indicated 3 or more dimensions. Person measure had a mean of –2.16, showing poor targeting of persons to items. Person reliability was 0.71 and person separation index was 1.56.
CONCLUSION: According to this Rasch analysis of data from a representative sample of mild traumatic brain injury, the RPQ may not be optimal for this population. Even after reducing the number of categories and collapsing items with local dependency, unidimensionality was not reached, which argues against summation of a total score. However, the scale is unbiased for gender and age.
Key words: mild traumatic brain injury; Rivermead Post-Concussion Symptoms Questionnaire; Rasch analysis.
J Rehabil Med 2011; 43: 997–1002
Correspondence address: Marianne Lannsjö, Rehabilitation Medicine, Sandviken Hospital, SE-811 89 Sandviken, Sweden. E-mail: marianne.lannsjo@lg.se
Submitted October 10, 2010; accepted August 8, 2011
This article has been fully handled by one of the Associate Editors, who has made the decision for acceptance, as one author represents the institute where the Editor-in-Chief is active.
INTRODUCTION
Mild traumatic brain injury (MTBI) is a common condition, as reflected by annual incidence rates of 300–500/100,000 for patients seen in emergency hospitals in Western countries (1). Although most patients have a favourable outcome (2), a subgroup of patients report symptoms, such as headache, dizziness and fatigue, and activity limitations that persist for 3 months or longer (3–8). Prognostic factors include medical, socio-demographic and psychosocial factors (2, 3), but the relative impact of these remains to be clarified. Persisting symptoms constitute the core, clinical feature of a poor outcome, as reflected in the criteria for a post-concussional condition listed in the International Classification of Diseases (ICD 10) (9, 10) and the Diagnostic and Statistical Manual of Mental Disorders, 4th edition (DSM-IV) (11), as well as in several symptom questionnaires or checklists used in studies of this condition. Thus, adequate collection and interpretation of symptom data after MTBI are crucial in order to understand the condition and to develop adequate prevention and treatment interventions.
The Rivermead Post-Concussion Symptoms Questionnaire (RPQ) (12) is commonly used to measure severity of symptoms following mild or moderate traumatic brain injury, by presenting 5 response alternatives on an ordinal level. The RPQ has been regarded as a unitary construct without any further analysis of its underlying structure (6). In a study by Potter et al. (6), factor analysis of RPQ data yielded weak support for a 1-factor solution, while Lannsjö et al. (4) demonstrated strong support for 1 factor in common for RPQ symptoms reported by a large cohort of patients at 3 months after MTBI. However, both these studies also demonstrated discernable constellations of cognitive, emotional and somatic symptoms in accordance with previous suggestions by Smith-Seemiller et al. (13). This was also found by Herrman et al. (14) in a study on moderate and mild traumatic brain injury.
Another approach to elucidate the construct and usability of instruments with ordinal data is offered by Rasch analysis, which has been proved valuable, not least in the rehabilitation context (15). A Rasch analysis examines how data conform to the model, in contrast to the traditional approach whereby the model is used to explain the data (16, 17). It is a probabilistic model specifying that a reasonable uniform level of randomness must exist throughout the data (17).
A study by Eyres et al. (18) examined the construct of the RPQ through Rasch analysis of RPQ data from 369 subjects with prior head injuries of varying severity. They found significant deviations from the Rasch model’s expectations, and that half of the 16 RPQ items displayed disordered thresholds. Removal of the first 3 items (headache, dizziness and nausea) with very large residuals improved the overall fit. The resulting 13-item scale exhibited unidimensionality, as did the 3 removed items combined, indicating that the RPQ comprises two different constructs. As pointed out by the authors, further studies of well-defined study samples are needed. The aim of the present study was to examine the construct of the RPQ by Rasch analysis, in a homogenous study sample consisting of data derived from a national cohort of patients, who were followed up at 3 months after MTBI. All participants fulfilled established diagnostic criteria for MTBI (19) and had a presenting Glasgow Coma Scale (GCS) (20) score of 15, and thus represented the vast majority of patients with MTBI (21).
METHODS
Participants
During the period from May 2001 to January 2004, 39 of 75 emergency departments in Sweden participated in a study comparing the effects and costs of two acute management policies for MTBI (22). Participating departments represented hospitals of all sizes and all parts of the country, and correspond to the geographical distribution of the Swedish population. Patients with MTBI, aged 6 years or older were recruited to the study. The eligibility criteria were: head trauma within the past 24 h, confirmed or suspected loss of consciousness (LOC) and/or amnesia, normal neurological examination and a GCS score of 15, and no associated injuries that required admission. A total of 2,602 patients were recruited to the study. Three months after their visit to the emergency department, patients were sent questionnaires (with a reminder letter to those who had not answered), including the RPQ. Questionnaires were returned by 2,523 patients (97% response rate).
Ethics
No financial incentives were offered. Eligible patients received oral and written information about the study and gave written consent to participate. Consent in children was obtained from a parent or accompanying caregiver. All regional research ethics committees in Sweden approved the study. The Swedish national health and pharmaceutical insurance plan covered all patients included in the study.
Rivermead Post-Concussion Symptoms Questionnaire
In this study a Swedish version of the RPQ (after forward-backward translation) was used. The RPQ (12) consists of 16 items asking the patient about the degree of experienced headaches, dizziness, nausea, noise sensitivity, sleep disturbance, fatigue, irritability, depression, frustration, poor memory, poor concentration, taking longer to think, blurred vision, light sensitivity, double vision and restlessness, over the previous 24 hours compared with before the head injury. Symptoms are assessed on a 5-point scale with the response alternatives: never had symptoms (Category 0), have had symptoms but they have resolved (Category 1), have mild problems with symptoms (Category 2), have moderate problems with symptoms (Category 3), and have severe problems with symptoms (Category 4). The total RPQ score is the sum of a subject’s score for each of the 16 items. Thus, the lowest possible total score is 0 (if the subject has answered never have symptoms for all items) and the highest 64 (if the person has answered had severe problems with symptoms for all items). RPQ has demonstrated validity and reliability in studies using classical test theory (23, 24).
Rasch analysis
The Rasch analysis was performed using the computer program Winsteps 3.66.0 (25). The partial credit model (26) was applied, as it was assumed that the thresholds would differ for each item.
The Rasch analysis is a mathematical measurement model developed by the Danish mathematician Georg Rasch (27). In the Rasch model, cumulative raw scores, achieved by a person across items or by an item across persons, are transformed into linear continuous measures of ability (for persons) and difficulty (for items) (15). The model is probabilistic, which means that the easier the item the more likely it will be passed, and the more able the person the larger the probability that he or she will pass a difficult item compared with a less able person (27). Applying this to a symptom questionnaire as RPQ, the latent variable will correspond to a continuum of persons with increasing problems related to symptoms and a dispersion of items along that continuum with symptoms from common to rare. Each observation is considered to indicate “less” or “more” of the latent variable, i.e. the concept of interest.
Category function was analysed according to ordering of thresholds. Disordering might reflect problems with the scale or a poorly defined concept (16). Collapsing of categories was performed based on the patterns in the average measure values with regard to the descriptions of the categories, until ordered thresholds were reached. Collapsing was performed in the same way for all items for clinical feasibility. A critical number of at least 10 observations were requested for each category (16). The critical value of < 2.0 was chosen for mean square (MNSQ) outfit for categories (16).
Testing of dimensionality included analysis of local dependency, i.e. the degree of residual correlations between items. When local dependency was detected, the scores of the dependent items were summated in Excel, resulting in a sum score (personal communication with Professor Mike Linacre). Thus, the total score for each respondent was kept unchanged. These so-called super-items were then used in further analysis in Winsteps.
Within the framework of the Rasch model, the scale should work the same way irrespective of which group (e.g. gender) is being assessed (28). The probability should be the same for persons at the same level of the trait. Items that do not yield the same item response function for 2 or more groups display differential item functioning (DIF) and are violating the requirement of measurement invariance (29). The data were analysed within the Winsteps program for uniform DIF by age and gender. Uniform DIF means a consistent systematic difference in the responses to an item assuming that the DIF is the same for all ability levels. To account for multiple comparisons, Bonferroni corrections were applied to adjust the χ2 p-value (30).
Further testing of unidimensionality comprised a principal components analysis of the residuals, i.e. the standardized person-item differences between the observed data and what is expected in the model for every person’s response to every item. After the “Rasch factor” is extracted, there should be no further pattern in the data (31). Eigenvalues greater than 1.5 in the contrasts (contrasts of items with opposite loadings) were considered indicative of a second component (32).
Statistics for item fit are presented as value for item reliability and item separation index. Item fit was also analysed using values of MNSQ statistics: MNSQ infit (influenced by response patterns) and MNSQ outfit (influenced by outliers). The critical values for the MNSQ infit and outfit are affected by the number of persons in the calibration. The critical values were calculated by the formula suggested by Smith et al. (33) for large samples, resulting in MNSQ infit 0.94–1.06 and MNSQ outfit 0.88–1.12.
Statistics for person fit are presented as mean values for person reliability and person separation index. The Winsteps person reliability can be interpreted as the traditional test reliability. A minimum value of 0.7 is required for group use and 0.85 for individual use (17). The person reliability coefficient is related to person separation index. With a separation index of 1.5, one can discern 2 strata (high, low) comparable to a reliability coefficient of 0.7 (acceptable); with an index of 2.0, one can discern 3 strata (high, average, low) comparable to a reliability coefficient of 0.8 (good); and with an index of 3.0, one can discern 4 strata comparable to a reliability coefficient of 0.9 (excellent) (34).
The mean values for person and item measures were compared to determine the extent to which the set of items was at the appropriate level according to the person’s degree of problem with symptoms. The mean difficulty level across items and rating scale categories is fixed at zero and a mean person measure of zero would represent perfect targeting. The more the mean person measure differs from zero, the more the set of items is mistargeted. A mean person measure of ±1.0 would indicate more substantial mistargeting (34).
RESULTS
Of 2,523 questionnaires, 2,508 were available for the Rasch analysis. Of the respondents, 59% were males and 41% females. Mean age was 31 years (median 22), range 6–96 years. The respondents were divided into 5 age groups: 6–15 (30% of the sample), 15–30 (30%), 30–60 (26%), 60–80 (11%) and > 80 (3%) years. A previous analysis demonstrated homogeneous symptom frequencies in these groups and no significant interactions between age and gender (Lannsjö M, unpublished data).
Of the sample 35% were children, age range 6–16 years, 32% were working, 15% studying, 13% were retired and 5% had other occupation. A total of 966 persons (38%) responded 0 (never had symptoms) on every item.
Analysis of category function showed that threshold values were disordered, except for the items headaches, dizziness and nausea (Items 1–3). Collapsing of Category 1 (have had symptoms but they have resolved) and 2 (have mild problems with symptoms) resulted in ordered thresholds. Collapsing was performed in the same way for all items for clinical feasibility. This resulted in a 4-category scale (0 = never had symptoms, 1 = have had symptoms but they have resolved/have mild problems with symptoms, 2 = have moderate problems with symptoms, 3 = have severe problems with symptoms).
The analysis of category function included investigation of MNSQ outfit values of each category. Category 3 (have severe problems with symptoms) showed too high MNSQ outfit values for the items blurred vision (3.0), light sensitivity (2.1) and double vision (3.0). In Category 3 in item double vision there was only 4 responses. Deletion of the item double vision or one or more of the other 2 items in the visual area, did not substantially change the results. It was decided to keep these items in further analysis.
After ordering of thresholds was obtained, the local dependency of items was analysed. This showed dependency between the items poor concentration (Item 11) and longer to think (Item 12) with a residual correlation of 0.36 and for the items irritability (Item 7) and frustration (Item 9) with a residual correlation of 0.23. These were the 2 item-pairs with the highest residual correlations. Items 11 and 12 as well as 7 and 9, respectively, were therefore combined to create “super-items” which improved fit, first and foremost to MNSQ values for item fit (see Table I).
| Table I. Alternative 1 show fit statistics after collapsing of Category 1 and 2. Alternative 2 shows fit statistics after collapsing of Category 1 and 2 with super-items included due to local dependency |
| Alternative | Person reliability | Person separation | Item reliability | Item separation | Rasch dimension (%) | MNSQ infit | MNSQ outfit |
| 1 | 0.73 | 1.66 | 0.99 | 12.2 | 52.5 | 0.77–1.23 | 0.65–1.43 |
| 2 | 0.71 | 1.56 | 0.99 | 13.06 | 47.7 | 0.85–1.18 | 0.70–1.32 |
| MNSQ: mean square. |
Differential item functioning (DIF) was analysed with uniform DIF for age and gender. According to Bonferroni-adjusted probability values, there was no DIF for age or gender.
Further testing of dimensionality using principal component analysis (PCA) of the residuals showed that the Rasch dimension explained 47.7% of the variance. The first contrast explained 12.4% of the unexplained variance (eigenvalue 1.7), which is too high and an indication of multidimensionality. The items headache, dizziness and nausea (item 1, 2 and 3) formed a separate dimension. A PCA analysis of the remaining items (item 4–14) showed that the Rasch dimension explained 46% of the variance and the first contrast explained 14.2% (eigenvalue 1.6) of the unexplained variance. This analysis showed that RPQ is not unidimensional, but consists of at least 3 dimensions. It was decided not to analyse these dimensions further.
After re-scoring of categories and consideration of local dependency, the value for item reliability was 0.99 and item separation index was 13.06. Value for person reliability was 0.71, which was lower than the critical value of 0.85 for individual use. The person separation index was 1.56, which indicated that RPQ are only usable on a group level, with the possibility of reliably separating the sample into a maximum of 2 strata.
Fit was then analysed by MNSQ values for all items (see Table II). MNSQ infit varied between 0.85 and 1.18 and MNSQ outfit between 0.75 and 1.32. The critical values of MNSQ infit and outfit were reached only for 4 items (irritability/frustration, poor memory, light sensitivity, double vision).
| Table II. Mean square (MNSQ) values for all items after collapsing of Category 1 and 2 and construction of super-items irritability/frustration and poor concentration/longer to think |
| Item | Item measure | MNSQ infit | MNSQ outfit |
| Double vision | 1.59 | 0.98 | 0.94 |
| Nausea | 0.59 | 1.08 | 1.03 |
| Blurred vision | 0.58 | 1.17 | 1.32 |
| Light sensitivity | 0.43 | 1.06 | 0.93 |
| Noise sensitivity | 0.20 | 1.06 | 1.13 |
| Depression | 0.14 | 0.86 | 0.75 |
| Restlessness | 0.01 | 0.88 | 0.70 |
| Poor concentration/Longer to think | –0.21 | 0.92 | 0.79 |
| Irritability/Frustration | –0.23 | 0.98 | 0.90 |
| Sleep disturbance | –0.31 | 1.08 | 1.10 |
| Poor memory | –0.42 | 0.96 | 1.00 |
| Dizziness | –0.46 | 1.09 | 1.07 |
| Fatigue | –0.91 | 0.85 | 0.85 |
| Headaches | –1.01 | 1.18 | 1.17 |
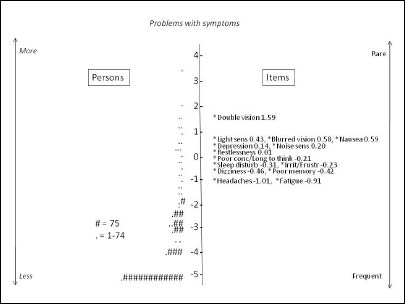
Values for item measure varied between –1.01 and 1.59 (Table II) and values for person measure varied between –5.33 and 3.56, with a mean measure of –2.16, which definitely diverged from the critical value of ±1.0 from zero. The values for person and item measures imply that the targeting of persons to items was poor. This is illustrated in Fig. 1.
Fig. 1. Map of persons and items along the latent variable. Persons are ordered according to measure on the left-hand side. Each ‘#’ in the person column is 75 persons and each ‘.’ is 1–74 persons (mean 26). A value of –5 indicates a low degree of experience of problems with symptoms and a value of 2 indicates a high degree. The items are ordered by measure on the right-hand side, with the highest rated items on top. A value of –1.01 indicates that the item is more frequent than an item with a value of 1.59.
DISCUSSION
The main finding of this study is that symptom data obtained by use of the RPQ do not reflect only one dimension according to the probabilistic Rasch model. Instead, findings indicate that these data correspond to 3 or more dimensions. Several factors may contribute to the multidimensionality. Poor targeting of persons to items is probably one main factor. It should be noted that our study included only patients with a mild MTBI, i.e. a presenting GCS score of 15, and a large proportion of the respondents (38%) reported no symptoms ever after the MTBI.
According to current opinion, unidimensionality of a clinical rating scale is one prerequisite for a total scale score to be calculated (35, 36). From that perspective, our findings argue against summating all 16 RPQ item scores to a total sum score for data from patients with mild MTBI. The demonstrated lack of unidimensionality is partially in agreement with a previous Rasch analysis of RPQ data by Eyres et al. (18). However, in their study support was found for 2 dimensions, comprising item 1–3 and item 4–16, respectively. In the present study the first contrast in the PCA analysis consisted of items 1–3, showing that these items clearly fall outside the scale. However, further analysis of the remaining items gave an indication of 3 or more dimensions. One reason for the discrepancies between the studies is probably that study samples differed. Our study included a well-defined sample of patients with mild MTBI, while the sample in Eyres’ study was more heterogeneous regarding head injury. In the literature, the suggested critical levels for eigenvalues in PCA to indicate a dimension beyond the Rasch dimension, vary between 1.4 (37), 1.5 (32) and 2.0 in the manual of Winsteps. We chose the value 1.5 as indicative of a further dimension to correspond to strict critical values for MNSQ for large samples. Applying a less strict critical value, e.g. as suggested in the Winsteps manual, the results would probably have been more similar to the results reported by Eyres et al. Other studies with factor analysis on RPQ data have also given support for multidimensionality (4, 6, 14).
The analysis of scale categories demonstrated disordered thresholds, which required rescoring of categories. This indicates difficulties for respondents to differentiate between degrees of problems with symptoms according to the originally suggested categories. From a clinical point of view there are arguments for collapsing Category 1 with either Category 0 or 2. The distinction between symptoms perceived during the past 24 h and “have had symptoms but they have resolved” as well as between categories when symptoms occur intermittently, may be difficult. Our analysis demonstrated that only collapsing of Category 1 and 2 resulted in ordered thresholds. The need for collapsing categories is in agreement with the findings reported by Eyres et al. (18), who suggested Category 0/1 be collapsed with Category 2, or Category 2 be collapsed with Category 3. The construct with 4 categories needs to be confirmed by a new study with Rasch analysis.
Data from items in the visual area exhibited several problems. The items blurred vision and light sensitivity had too high unpredictability with regard to Category 3 (severe problems). The item double vision showed unpredictability and too few responses in Category 3 and thus might better be deleted. However, deletion of this item had no impact on the fit statistics. Even the categorical misfit of all 3 visual items had no impact on the overall fit of the items, and deletion of 1 or more of them had no impact on fit statistics in other respects. Accordingly, no item was deleted.
Furthermore, there was local dependency between 2 pairs of items: irritability/frustration and poor concentration/longer to think, respectively. Combining the responses of these pair of items in 2 super-items improved fit. Another alternative would be to delete one item in each pair as redundant. However, it can be argued that all these items capture problems that can be perceived by persons after a mild MTBI, and thus it may be considered relevant from a clinical perspective to keep them in the scale. Symptoms are not necessarily hierarchical and the particular set of symptoms exhibited after MTBI can vary considerably across individuals.
There was no DIF related to gender or age, which is in agreement with findings by Eyres et al. (18). This indicates that the RPQ construct is similar for both females and males and over the age groups, while symptom frequencies are associated with gender and age, as demonstrated in previous studies (38–43). The observed value for item reliability (0.99) indicates that the sample size was large enough. The item separation index (13.06) indicates a potentially wider range of problems with symptoms than the item set can measure. The value of person reliability (0.71) and the person separation index (1.56) clearly indicate low test reliability of RPQ in this sample. A reasonable overall conclusion from these fit statistics is that reliability is insufficient on the individual level, but allows the distinction of 2 strata (high- and low-grade of problems with symptoms) on group level.
MNSQ fit statistics exceeded the suggested limits for the current sample size, according to Smith et al. (33), although not much. Fit in large samples is a recognized problem (44). The χ2 test, which is also used in Winsteps, is very sensitive to large sample sizes. The study by Eyres et al. (18) with a smaller sample size reported problem with dimensionality in the analysis of residuals, but not with misfit of MNSQ. Obviously, there are issues of methodological sample size and MNSQ fit that remain to be resolved.
The results of this study, with data from a large, representative cohort of patients with MTBI, extend previous knowledge on the interpretation and use of data collected by use of the RPQ, which is an extensively used instrument in clinical MTBI practice and research. The study design of many participating hospitals, the large sample size and the high participation rate argue that the RPQ symptom data analysed in this study are representative of the mild MTBI population. The observed symptom frequencies are in agreement with previous studies on corresponding samples of patients with MTBI (5, 45). After combining 2 pairs of locally dependent items and collapsing Category 1 and 2 (scoring key 01123), the Rasch analysis yielded a 14-item version of RPQ with 4 scale steps. However, problems with dimensionality remained. The results of this study should be considered when RPQ is used in corresponding study populations, with a large proportion of study participants with no remaining symptoms. However, from a clinical point of view when screening for problems in persons with mild MTBI (GSC = 15) a large proportion of persons without symptoms is expected and desirable, which highlights some of the psychometric analysis difficulties that deserve further attention for this kind of data.
In conclusion, according to this Rasch analysis of data from a representative sample of mild MTBI, the RPQ may not be optimal for the mild MTBI population. Even after reducing the number of categories and collapsing items with local dependency, unidimensionality was not reached, which argues against summation of a total score. However, the scale is unbiased for gender and age.
ACKNOWLEDGEMENTS
This study was supported by grants from the Swedish insurance company AFA and the Centre for Research and Development, Uppsala University/County Council of Gävleborg. Special thanks to Dr Mike Linacre for his kind support and statistical advice.
REFERENCES