OBJECTIVE: To evaluate the reliability and validity of WHODAS II within the spinal cord injury population.
SUBJECTS: Sixty-three people with traumatic spinal cord injury.
METHODS: The World Health Organization Disability Assessment Scale II (WHODAS II), Craig Handicap Assessment and Reporting Technique, and Medical Outcomes Study 36-item Short-Form Health Survey (MOS SF-36) were administered at 2 years post discharge from rehabilitation. Distribution, reliability, discriminant validity, and convergent/divergent validity were evaluated using classical tests. Rasch analyses were applied to assess dimensionality, item spread, and person/item reliability.
RESULTS: Cronbach’s alpha coefficients ranged from 0.61 (getting around) to 0.97 (participation). Ceiling effects were present in 4 out of 6 domains. WHODAS II discriminated between levels of impairment and work force status on ‘self-care’, ‘getting around’, ‘life activities’, and total score. Correlations with MOS SF-36 supported convergent/divergent validity. Five items didn’t fit the Rasch model. The item/person map reveald a shortage of items able to differentiate the more able person. WHODAS II demonstrated good person and item separation and reliability.
CONCLUSION: This study provides preliminary support for reliability and validity of WHODAS II in a spinal cord injured population. Limitations were noted for dimensionality and item person distribution. Findings need to be confirmed in larger samples.
Key words: spinal cord injury; participation; disability; assessment; psychometric properties; Rasch analyses.
J Rehabil Med 2012; 00: 00–00
Correspondence address: Annelies C. De Wolf, MPH, Rehabilitation Studies Unit, University of Sydney and Royal Rehabilitation Centre Sydney, 59 Charles Street, Ryde NSW 2112, Australia. E-mail: anneliesd@med.usyd.edu.au
Submitted August 28, 2011; accepted March 30, 2012
Introduction
Returning to full participation in daily life is the ultimate goal of rehabilitation. Yet, activity and participation is fraught with challenges, particularly in the spinal cord injury (SCI) population. Some of the unique challenges that present to this population are associated conditions (1), physical and/or structural barriers (2), lack of accessible transportation (3), limited work opportunities (4), limited social support (2), and secondary health complications (5, 6).
The World Health Organization Disability Assessment Scale II (WHODAS II) is an instrument that measures everyday functioning across 6 domains that correspond with the activities and participation components of the International Classification of Functioning, Disability and Health (ICF; WHO, 2001). It was designed as a generic measure, suitable for use with different health conditions, in different countries and cultures (7, 8). The WHO website advises that information from the WHODAS II can be used to identify needs, match patients to interventions, track functioning over time, and measure clinical outcomes and treatment effectiveness. Specific to the SCI population, the WHODAS II has attractive features compared to other SCI validated participation measures in that no other measure has a subscale structures matching directly with components of the ICF (9, 10).
Psychometric properties of the WHODAS II have been evaluated for a number of clinical conditions, including musculoskeletal diseases (11–14), chronic diseases (13, 15), psychiatric conditions (11, 13, 15), cancer (15), hearing loss (16), stroke (13, 15, 17), and spinal conditions (18, 19). Noonan et al. (20) recently reported on distribution, reliability, and construct validity of WHODAS II in 145 persons with SCI who were around 5 years post discharge from hospital. Dimensionality using item to scale correlations was assessed in a population of spinal conditions which included the same 145 persons with SCI, as well as persons with none neurological involved spinal degeneration and fractures (n = 400) (18). Psychometric properties for WHODAS II have generally been found adequate (21) although the presence of a ceiling effect has been identified as a concern (13, 20).
To our knowledge, only one other study examined the psychometric properties of the WHODAS II when applied to the population with SCI (20). Internal scale validity for this population has not been thoroughly examined. In our quest to find suitable measures of activity and participation for use in this clinical group, we seek to confirm and examine further whether the WHODAS II is a reliable and valid instrument to measure activity and participation in the spinal cord injury population. To determine the construct validity of the WHODAS II in this clinical group, both classical tests and item response theories were applied. Convergent/divergent validity was examined with reference to the Craig Handicap Assessment and Reporting Technique (CHART) and the Medical Outcomes Study (MOS SF-36).
Methods
Participants/study design
The data used to examine the psychometric properties of the WHODAS II were obtained from a prospective cohort study designed to evaluate community reintegration following SCI. (22) Participants (n = 75) who sustained traumatic SCI were recruited from three SCI rehabilitation units in Sydney, Australia (Prince of Wales Hospital, Royal North Shore Hospital, and Royal Rehabilitation Centre Sydney) between October 2003 and September 2007. Individuals were excluded from this study if they required permanent ventilation, or had (in addition to SCI) a severe traumatic brain injury (post traumatic amnesia > 7 days) or significant mental health disorder. The study sample consisted of 63 participants who were followed up at 2 years after discharge from the inpatient unit. The study was approved by the respective institutional ethics committees.
Outcome measures
WHODAS II is a 36-item generic measure of disability that examines difficulties in 6 domains of life during the previous 30 days (7): understanding and communicating (6 items), getting around (5 items), self-care (4 items), getting along with others (5 items), life activities (8 items), and participation in society (8 items). Each item is rated on a 5-point scale, from 1 (no difficulty) to 5 (extreme difficulty/cannot do). The instrument produces a total score (disability index) and 6 domain scores, ranging from 0 (best) to 100 (worst). The domain scores are transformed from the total raw score (sum of items) of each domain according to the following formula: Transformed score=[(actual raw score – lowest possible raw score) / (possible raw score range)] x 100. The disability score is calculated using the Statistical Package for the Social Sciences (SPSS) – (syntax available from World Health Organization). The disability score in this study was calculated from 32 items (omitting questions related to work/school because 44% of participants were not employed and/or not involved in school at 2 years post discharge). The self-administered version was used for the study. Item 2.5 ‘Walking a long distance such as a kilometer’ was reworded to ‘Walk or wheel a long distance such as a kilometer’.
The CHART is a 32-item scale specifically developed to measure handicap in people with SCI living in the community. The 6 dimensions (physical independence, mobility, occupation, societal integration, economic self-sufficiency, and cognitive independence) focus on objective, observable criteria that are easily quantifiable. 5 of the 6 domains (economic domain omitted) plus the total score of 5 domains were examined in the present study. Domain scores range from 0 to 100 (total score 0–500) with higher scores indicative of less handicap. The domain scores are calculated using a scoring formula that was calibrated on a non-disabled population (USA) where the majority receives a score of 100 (full test manual is available from www.craighospital.org). The CHART has demonstrated strong psychometric properties in the SCI population (23–25).
The Medical Outcomes Study 36-item Short Form Health Survey (MOS SF-36) is a generic, multidimensional, self-report health questionnaire. The SF-36 measures 8 health concepts or domains: physical functioning, role (physical) limitation, bodily pain, general health, vitality, social functioning, role (emotional) limitation, and mental health. Two component scores, physical and mental component score (PCS and MCS) can be derived from the domain scores (26). The domain and component scores are standardized to Australian norms with a mean score of 50 (standard deviation (SD) 10). The walk-wheel version (27) was used in the study, which replaces the walk language with ‘walk or wheeling’. The SF-36 has demonstrated acceptable psychometric properties within the SCI population (27, 28).
Data analysis
Statistical analyses for psychometric tests were performed using SPSS 18.0 for Windows. The percentage of participants with lowest and highest possible score were calculated with values greater than 15 percent considered to reflect floor and ceiling effects respectively. (29) Kolmogorov-Smirnov (K-S) tests examined the distribution of the domain and total scores. Because 4 out of 6 domains deviated from the normal distribution, non-parametric analyses were performed across all domains to allow uniformity of statistical methods. The equivalent parametric tests were carried out on the two domains and total score which were normally distributed to confirm strength of findings – results are reported when strength differs from non-parametric test results.
Internal consistency was evaluated for the total scale and for the domains using Cronbach’s alpha coefficient, where > 0.8 was considered excellent, 0.7 to 0.8 adequate, 0.6 to 0.7 questionable, and < 0.6 poor (30).
Discriminant validity was examined by i) comparing different impairment levels (high versus low), and ii) comparing those participants who were in the workforce (paid employment or volunteer) with those not in the work force. Mann-Whitney U analyses was applied and Hodges Lehman confidence intervals (31) were calculated to assist with interpretation of statistically significant between-group differences. It was hypothesized that persons with higher levels of impairment (tetraplegia AIS A-C) would have higher scores (more disability) on domains related to getting around, self-care, life activities, participation, and the total score than persons with low impairment SCI (tetraplegia AIS D and paraplegia). Likewise, we hypothesized that persons in the workforce would have lower scores (less disability) for domains related to getting around, self-care, life activities, participation, and total score.
To establish convergent/divergent validity, correlations were examined between domains of WHODAS II and domains of CHART and MOS SF-36 that were thought to have similar/dissimilar underlying constructs. Spearman correlation coefficients were interpreted according to the following criteria: > 0.80 = high, 0.61 to 0.80 = marked, 0.41 to 0.60 = moderate, 0.20 to 0.40 = fair, and < 0.20 = no relationship (17). It was hypothesized that moderate or stronger correlations would be found between domains of WHODAS II and domains of CHART and SF-36 with similar underlying constructs and that no relationship would be found between domains with dissimilar underlying constructs (Table IV). Convergent/divergent validity was rated sufficient if at least 75% of the a priori hypotheses were confirmed (29).
Construct validity was further investigated using Rasch analysis. Rasch analyses was chosen over confirmatory factor analysis (CFA) because of the information the former provides at the item level and thus allowed for a meaningful interpretation of the difficulty of the items and ability of persons. This was particularly of interest given the assessed ceiling effects. Additionally, the Rasch model (unlike CFA) has no problems accommodating the missing data from work-related items and therefore allowed the analyses to be carried out on the set of 36 items (32). Rasch rating scale analysis was conducted using the Winstep program (33) to evaluate WHODAS II in terms of the following:
i) Unidimensionality: to determine whether all items represent a similar construct. The infit mean square (MnSq) statistic was used with criterion for misfit set at > 1.4 (34). Misfit items were investigated in terms of participant characteristics and associated factors to seek an understanding for the reason that items may have misfit. No minimum MnSq fit cutoff was set because identifying overfit items (MnSq < 0.6), for the purpose of eliminating and/or replacing the item with more efficient ones, was not the objective of our study (34).
ii) Hierarchy of items: to determine the order of item difficulty in relation to the distribution of person ability and to identify item gaps the person-item map was visually inspected.
iii) Person reliability and separation: to determine the extent to which the WHODAS II distinguished among persons with different levels of functioning and participation (with separation index criterion set at ≥ 2.0, and reliability at ≥ 0.80). Discernible strata of person ability were calculated using the formula by Fisher (35): (4 x separation index + 1) / 3. Item reliability was calculated to examine the degree to which the item response categories reflected increasing levels of disability (item separation with the criterion set at ≥ 2.0, and reliability at ≥ 0.80).
Results
Demographic and injury variables of participants are presented in Table I.
| Table I. Demographic and injury variables of participants (n=63) |
| Age at injury, years, mean (SD) | 34.7 (14.6) |
| Sex, n (%) | |
| Male | 51 (81) |
| Female | 12 (19) |
| Work status at 2 years, n (%) | |
| Paid employment or volunteer | 21 (33) |
| Not working | 42 (67) |
| Lesion level, n (%) | |
| Paraplegia | 26 (41) |
| Tetraplegia | 37 (59) |
| ASIA Impairment Scale (AIS), n (%) | |
| A | 37 (59) |
| B | 4 (6) |
| C | 4 (6) |
| D | 18 (29) |
| Impairment level, n (%) | |
| High (tetraplegia AIS A–C) | 25 (40) |
| Low (tetraplegia AIS D & paraplegia) | 38 (60) |
| ASIA: American Spinal Injury Association; A: no motor or sensory function preserved in sacral segments S4–S5; B: sensory but not motor function preserved below neurological level, C: motor function preserved below neurological level with more than half key muscles graded less than 3; D: motor function preserved below neurological level with at least half of key muscles graded 3 or more. SD: standard deviation. |
Calculation of WHODAS II total and domain scores provided information about the self-rated activity and participation limitations of adults with SCI 2 years after discharge (Table II and III). The greatest limitations were found in the domains of ‘getting around’, ‘self-care’, and ‘life activities’. The least limitation was found for ‘understanding and communicating’. Within different levels of impairment, the single greatest limitation was found among individuals with tetraplegia (ASIA A–C) within the domain of ‘self-care’. The total score and two domains, ‘life activities’ and ‘participation’ were normally distributed (K-S > 0.05). The other domains were not normally distributed. Positive skewness with potential for ceiling effect (best score) were seen for ‘understanding and communicating’, ‘self care’, ‘getting along with others’, and ‘life activities’. There were no major floor effects.
| Table II. Mean (SD), Median (IQ), Skewness, Cronbach alpha, and floor and ceilings of WHODAS II, CHART, and MOS SF-36 domains and total/summary scores |
| | Mean (SD) | Median (IQ) | K-S | Cronbach alpha | Floor n (%) | Ceiling n (%) |
| WHODAS II | | | | | | |
| Understanding and communicating | 10.0 (18.2) | 0.0 (20.8) | 2.18* | 0.93 | 0 (0) | 34 (54) |
| Getting around | 48.8 (19.8) | 45.0 (20.0) | 1.43* | 0.61 | 2 (3) | 1 (2) |
| Self-care | 37.1 (37.5) | 18.8 (75.0) | 1.75* | 0.94 | 5 (8) | 18 (29) |
| Getting along with others | 19.6 (18.3) | 20.0 (20.0) | 1.66* | 0.73 | 0 (0) | 12 (19) |
| Life activities | 41.9 (33.4) | 40.6 (62.5) | 1.09 | 0.96 | 7 (11) | 10 (16) |
| Participation | 35.8 (21.6) | 31.3 (40.6) | 1.21 | 0.97 | 0 (0) | 0 (0) |
| WHODAS II Total score | 34.6 (19.1) | 32.6 (28.3) | 0.81 | 0.95 | 0 (0) | 0 (0) |
| CHART | | | | | | |
| Physical | 89.5 (11.1) | 94.3 (18.9) | 1.46* | – | 0 | 12 (20) |
| Mobility | 82.3 (20.2) | 89.0 (31.0) | 1.65* | – | 0 | 24 (39) |
| Occupational | 56.2 (36.1) | 53.0 (78.5) | 1.56* | – | 1 (2) | 19 (31) |
| Social | 85.0 (21.0) | 95.0 (27.0) | 2.00* | – | 0 | 28 (46) |
| cognitive | 98.9 (0.0) | 100.0 (0.0) | 3.87* | – | 0 | 57 (93) |
| CHART Total | 411.9 (73.9) | 429.8 (130.8) | 0.91 | – | 0 | 6 (10) |
| MOS SF-36 | | | | | | |
| Physical functioning | 28.3 (8.2) | 27.0 (10.8) | 0.82 | 0.80 | 1(2) | 0 |
| Role physical | 40.2 (13.2) | 34.1 (28.7) | 2.15* | 0.94 | 8 (13) | 1 (2) |
| Bodily pain | 42.6 (12.1) | 44.0 (17.3) | 1.11 | 0.88 | 2 (3) | 4 (6) |
| General health | 44.7 (11.9) | 47.6 (17.2) | 1.13 | 0.84 | 1 (2) | 1 (2) |
| Vitality | 45.7 (10.2) | 45.2 (17.7) | 0.92 | 0.72 | 0 | 1 (2) |
| Social functioning | 42.2 (13.0) | 45.5 (22.4) | 1.14 | 0.78 | 1 (2) | 6 (10) |
| Role emotional | 45.1 (13.1) | 55.2 (20.7) | 2.90* | 0.96 | 3 (5) | 2 (3) |
| Mental health | 48.0 (10.7) | 50.0 (16.5) | 1.17 | 0.83 | 0 | 1 (2) |
| Physical component score | 33.7 (9.7) | 34.6 (14.3) | 0.73 | – | 0 | 0 |
| Mental component score | 51.3 (11.7) | 52.7 (19.7) | 0.88 | – | 0 | 0 |
| *K-S < 0.05. K-S: Kolmogorov-Smirnov; IQ: interquartile; SD: standard deviation; WHODAS II: World Health Organization Disability Assessment Scale II; CHART: Craig Handicap Assessment and Reporting Technique; MOS SF-36: Medical Outcomes Study 36-item Short-Form Health Survey. |
| Table III. Descriptive statistics for WHODAS II domains and disability Index by impairment level along with results of Mann-Whitney U test |
| Impairment level | High impairment (n = 25) Median (IQR) | Low impairment (n = 38) Median (IQR) | Mann-Whitney U (z) | p | Median difference (CI)a |
| WHODAS II | | | | | |
| Communicating & understanding | 0.0 (0–8) | 2.0 (0–21) | –0.429 | 0.668 | 0.0 (0 to 4) |
| Getting around | 50.0 (40–75) | 40.0 (39–51) | 2.794 | 0.005 | –15.0 (–5 to –20) |
| Self-care | 81.3 (56–94) | 6.3 (0–22) | 4.898 | 0.000 | –62.5 (–75 to –44) |
| Getting along | 20.0 (5–20) | 20.0 (4–25) | –0.399 | 0.690 | 0.0 (–5 to 10) |
| Life activities | 56.3 (17–78) | 25.0 (12–56) | 1.890 | 0.059b | –21.9 (–41 to 0) |
| Participation | 31.3 (16–58) | 31.3 (16–56) | 0.225 | 0.822 | 0.0 (–13 to 9) |
| WHODAS II disability index | 40.2 (23–48) | 26.6 (15–45) | 2.017 | 0.044 | –9.8 (–21 to 0) |
| aMedian between group difference and Hodges-Lehman confidence interval; bindependent t-test calculated between group difference of mean = –17.8 (95% CI: –34.6 to –1.1), p = 0.037). IQR: interquartile range; CI: confidence interval. |
Internal consistency
Internal consistency of WHODAS II was examined using the 32-item version (omitting questions involving work/school). WHODAS II total score, and the domains ‘understanding and communicating’, ‘self care’, ‘life activities’, and ‘participation’ demonstrated excellent internal consistency; internal consistency was adequate for the domain getting along, and questionable for the domain getting around.
Discriminant validity
Mann-Whitney U analyses were used to examine if the domains and total score differentiated individuals with high level impairment from low level impairment (Table III). WHODAS II discriminated as expected between high and low impairment for the domains ‘getting around’, ‘self-care’, ‘life activities’, and the WHODAS II total score. Mann-Whitney U analyses calculated a trend for the domain ‘life activities (p = 0.059) which was confirmed statistically significant using parametric equivalent t-test (mean difference = –17.8; 95% confidence interval (CI) –34.6 to –1.1; p = 0.037). Contrary to hypothesized, there was no between group difference for the domain ‘participation’.
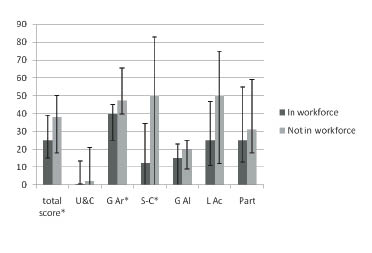
Fig. 1 compares median scores for WHODAS II total and domain scores between persons who were in the workforce and those who were not in the workforce. WHODAS II was able to significantly discriminate (p < 0.05) between persons in the workforce and those not in the workforce in terms of the total score (median difference = 9, 95% CI: 0 to 19), and the domains ‘getting around’ (median difference = 15, 95% CI: 5 to 25) and ‘selfcare’ (Median difference = 19, CI: 0 to 50). A trend was found for domain ‘life activities’ (median difference = 15, CI: 0 to 38), p = 0.095) which was confirmed statistically significant using parametric equivalent independent t-test (mean difference = 17.5 (95% CI 2.4 to 32.6; p = 0.024). Contrary to hypothesized, there was no difference between persons working and those not working for the domain ‘participation’. As such, 4 out of 5 domains where we expected to find a difference were confirmed.
Fig. 1. Median (Interquartile ranges) WHODAS II total and domain scores for persons in the workforce and persons not in the workforce. *Median between group difference; p < 0.05. U&C: understanding and communicating; G Ar: getting around; S-C: self-care; G Al: getting along; L Ac: life activities; Part: participation.
Convergent/divergent validity
Table IV presents calculated Spearman correlation coefficients between WHODAS II and CHART and MOS SF-36. Only 1 out of 7 hypothesized convergent associations between WHODAS II and CHART was confirmed (WHODAS II ‘self-care” with CHART ‘physical’) and none of the 6 hypothesized divergent associations were weak enough to present ‘no relationship’ (rs<0.20); confirming only 8 percent of a priori hypothesized associations. On the other hand, 10 out of 11 hypothesized convergent relationships between WHODAS II and MOS SF-36 were moderate and 3 out of 4 divergent associations were as expected without relationship (rs<0.20); confirming 87% of a priori hypothesized associations.
| Table IV. Spearman rank-order correlation coefficients between WHODAS II and CHART and MOS SF-36 |
| | WHODAS II |
| Understanding & communicating | Getting around | Self care | Getting along | Life activities | Participation | Disability index |
| CHART | | | | | | | |
| Physical | –0.26* | –0.61** | –0.81** | –0.37** | –0.65** | –0.50** | –0.70** |
| Mobility | 0.08 | –0.30* | –0.39** | –0.16 | –0.28* | –0.26* | –0.31* |
| Occupation | –0.01 | –0.29* | –0.41** | –0.17 | –0.37** | –0.31* | –0.34** |
| Social | –0.05 | –0.24 | –0.16 | –0.22 | –0.13 | –0.18 | –0.20 |
| Cognitive | –0.14 | –0.29* | –0.39 | –0.23 | –0.30* | –0.20 | –0.30* |
| Total score | –0.08 | –0.41** | –0.48** | –0.26* | –0.40** | –0.39** | –0.44** |
| SF-36 | | | | | | | |
| Physical functioning | –0.09 | –0.65** | –0.55** | –0.16 | –0.56** | –0.56** | –0.59** |
| Role physical | –0.33** | –0.40** | –0.31* | –0.34** | –0.45** | –0.56** | –0.51** |
| Pain | –0.26* | –0.30* | –0.24 | –0.16 | –0.44** | –0.48** | –0.41** |
| General health | –0.36** | –0.13 | –0.18 | –0.29* | –0.34** | –0.42** | –0.38** |
| Vitality | –0.39** | –0.35** | –0.31* | –0.44** | –0.50** | –0.59** | –0.58** |
| Social functioning | –0.46** | –0.21 | –0.17 | –0.22 | –0.42** | –0.59** | –0.46** |
| Role emotional | –0.52** | –0.27* | –0.19 | –0.36** | –0.43** | –0.60** | –0.50** |
| Mental health | –0.46** | –0.29* | –0.19 | –0.46** | –0.41** | –0.62** | –0.54** |
| PCS | –0.21 | –0.48** | –0.41** | –0.19 | –0.49** | –0.49** | –0.48** |
| MCS | –0.54** | –0.16 | –0.11 | –0.42 | –0.39** | –0.62** | –0.49** |
| Bold represents hypothesized convergent relationships (rs= 0.41 to 0.60 or stronger), italic entries represent hypothesized divergent relationships (rs<0.20). *p < 0.05; **p < 0.001. CHART: Craig Handicap Assessment and Reporting Technique; WHODAS II: World Health Organization Disability Assessment Scale II; CHART: Craig Handicap Assessment and Reporting Technique; MOS SF-36: Medical Outcomes Study 36-item Short-Form Health Survey; PCS: physical component score; MCS: mental component score. |
Construct validity using Rasch
Unidimensionality. Analysis of the 36 items shows that overall items were found to fit the model producing item mean infit statistics of 0.99 (SD 0.39) and mean outfit statistics of 1.00 (SD 0.51) and thus performed satisfactorily (Table V). Five of the items, appear to misfit the Rasch model (i.e. MnSq > 1.40 with concomitant Z-scores equal or greater than 2), these are items 2.1 standing long periods, 2.2 standing up from sitting down, 2.5 walking or wheeling a long distance, 3.4 staying by yourself for a few days, and 4.5 sexual activities. Table VI identifies persons with unexpected answers on misfit items. Overall, 86% of the items fit the Rasch measurement model.
| Table V. WHODAS II item statistics in order of difficulty |
| Item | Measure | SE | Infit MnSq | ZSTD |
| 2.1 Standing | 2.25 | 0.16 | 1.95 | 3.3 |
| 2.2 Standing up | 1.88 | 0.14 | 2.01 | 4.1 |
| 4.5 Sexual activities | 1.02 | 0.12 | 2.24 | 5.4 |
| 6.6 Drain on financial resources | 0.80 | 0.12 | 0.99 | 0.0 |
| 3.4 Staying by oneself | 0.77 | 0.12 | 1.41 | 2.2 |
| 5.4 Household work done quickly | 0.77 | 0.12 | 0.64 | –2.4 |
| 5.2 Doing household tasks well | 0.73 | 0.12 | 0.64 | –2.4 |
| 5.3 Doing housework needed | 0.65 | 0.12 | 0.77 | –1.4 |
| 5.1 Household responsibilities | 0.48 | 0.12 | 0.84 | –0.9 |
| 6.4 Time spent on health condition | 0.48 | 0.12 | 1.00 | 0.1 |
| 3.2 Dressing | 0.46 | 0.12 | 1.06 | 0.4 |
| 6.7 Problems for the family | 0.43 | 0.12 | 0.76 | –1.5 |
| 3.1 Washing | 0.42 | 0.12 | 1.20 | 1.2 |
| 6.5 Being emotionally affected | 0.41 | 0.12 | 1.00 | 0.1 |
| 6.8 Problems doing things for relaxation | 0.36 | 0.12 | 0.56 | –3.0 |
| 5.8 Getting work done quickly | 0.29 | 0.17 | 0.80 | –0.8 |
| 2.5 Walking/wheeling long distance | 0.16 | 0.13 | 1.61 | 3.0 |
| 6.2 Problems because of barriers | 0.16 | 0.13 | 0.77 | –1.4 |
| 5.5 Day to day work/school | 0.04 | 0.19 | 0.62 | –1.5 |
| 5.7 Getting work done as needed | 0.04 | 0.19 | 0.79 | –0.7 |
| 6.1 Problems joining community activities | 0.02 | 0.13 | 0.95 | –0.2 |
| 5.6 Doing work/school tasks well | –0.70 | 0.20 | 0.74 | –0.9 |
| 2.4 Getting out of home | –0.20 | 0.14 | 0.80 | –1.0 |
| 2.3 Moving around | –0.22 | 0.14 | 0.66 | –1.8 |
| 3.3 Eating | –0.45 | 0.15 | 1.16 | 0.8 |
| 6.3 Living with dignity | –0.54 | 0.16 | 0.97 | –0.1 |
| 1.2 Remembering | –0.70 | 0.17 | 0.82 | –0.7 |
| 4.4 Making new friends | –0.88 | 0.18 | 0.94 | –0.1 |
| 1.1 Concentrating | –0.94 | 0.19 | 0.80 | –0.7 |
| 4.1 Dealing with people unknown | –0.94 | 0.19 | 1.12 | 0.5 |
| 1.3 Finding solutions | –1.05 | 0.19 | 0.72 | –1.0 |
| 1.4 Learning new task | –1.13 | 0.20 | 0.77 | –0.7 |
| 1.6 Conversation | –1.26 | 0.21 | 1.17 | 0.6 |
| 4.3 Getting along with people close | –1.30 | 0.22 | 0.84 | –0.4 |
| 4.2 Maintaining friendship | –1.45 | 0.23 | 0.77 | –0.6 |
| 1.5 Understanding | –1.51 | 0.24 | 0.79 | –0.5 |
| Boldface: outside the acceptable criterion for a unidimensional construct (MnSq > 1.40, ZSTD = > 2.00). Infit MnSq = mean square standardized residuals; SE : standard error; ZSTD: standardized Z scores. |
| Table VI. Underfit items and person who responded unexpectedly on these items |
| Person N° | Item score (difficulty) | WHODAS II disability score | Level & ASIA grade | Mobility mode |
| Item 2.1 – Standing for long periods of time |
| 2 | None | 48 | C5 ASIA D | W/WC |
| 18 | Milda | 24 | T4 ASIA A | WC |
| 19 | Mild | 15 | L3 ASIA D | W |
| 30 | Mild | 33 | C6 ASIA D | W |
| 44 | Moderate | 56 | C6 ASIA D | W/WC |
| 47 | Moderate | 36 | C5 ASIA D | W |
| 48 | Mild | 47 | C5 ASIA D | W/WC |
| Item 2.2 – Standing up from sitting down |
| 1 | Moderate | 46 | L3 ASIA D | W |
| 2 | Mild | 48 | C5 ASIA D | W/WC |
| 8 | Severe | 72 | C3 ASIA D | W/WC |
| 9 | None | 18 | L2 ASIA D | W/WC |
| 19 | None | 15 | L3 ASIA D | W |
| 20 | Moderate | 45 | T12 ASIA D | W/WC |
| 47 | Moderate | 36 | C5 ASIA D | W |
| 48 | Mild | 47 | C5 ASIA D | W/WC |
| 49 | Mild | 30 | L1 ASIA D | W/WC |
| Item 4.5 – Sexual activities |
| 1 | None | 62 | C5 ASIA A | W |
| 6 | Extreme/cannot do | 21 | C6 ASIA D | WC |
| 10 | Extreme/cannot do | 15 | C6 ASIA C | WC |
| 24 | None | 38 | C5 ASIA A | WC |
| 25 | None | 62 | C5 ASIA A | WC |
| 28 | None | 38 | C5 ASIA B | WC |
| 29 | None | 46 | C5 ASIA A | WC |
| 46 | None | 45 | C7 ASIA A | WC |
| Item 3.4 – Staying by yourself for a few days |
| 23 | Extreme/cannot do | 17 | C7 ASIA A | WC |
| 35 | Extreme/cannot do | 15 | C7 ASIA A | WC |
| 51 | Extreme/cannot do | 19 | C6 ASIA A | WC |
| 59 | Mild | 64 | T12 ASIA A | WC |
| Item 2.5 – Walking or wheeling a long distance such as a kilometer (or equivalent) |
| 9 | Severe | 18 | L2ASIA D | W/WC |
| 39 | Extreme/cannot do | 33 | C5 ASIA A | WC |
| 50 | Severe | 14 | C3 ASIA D | W/WC |
| 55 | None | 67 | C5 ASIA A | WC |
| awith standing frame. W: walking; WC: wheelchair; WHODAS II: World Health Organization Disability Assessment Scale II; ASIA: American Spinal Injury Association. |
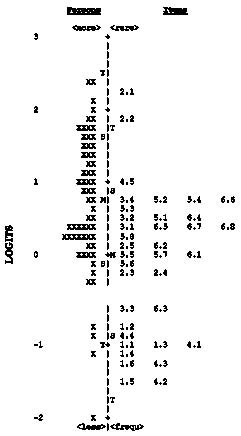
Hierarchy of items. Fig. 2 shows the distribution of all items and all persons on a linear continuum, ranging from persons with less disability and items that are more challenging at the top, to persons with more disability and less challenging items at the bottom. The distribution of person abilities ranged from –2.03 to 2.40 logits, with a mean of 0.75 logits. The mean of the item calibration values was 0 logits, ranging in difficulty from as high as 2.25 logits to as low as –1.51 logits. The hierarchy of the items shows that the easiest items relate to understanding/communicating or interpersonal relationships, while the most difficult items relate to standing followed by finances and household activities. Visualization of the range of item difficulties in relation to person’s ability reveals a shortage of (fitting) items capable of differentiating the more able persons (with less disability). Since items 2.1 and 2.2 underfit the Rasch model, the difficulty a person experiences with standing for a long time or standing from sitting down has little predictive value towards the total disability score (WHODAS II).
Fig. 2. Person and item frequency map, in logits, for the 36 WHODAS II items. X: 1 person; M: mean; S: 1 standard deviation; T: 2 standard deviations.
Reliability and separation. The Rasch analysis produced a person reliability coefficient of 0.94, an indication that the items work well together to consistently reproduce a participant’s score. The person separation was 3.84 indicating that the distribution of the persons could be separated into 5 statistically distinct levels [(4 x 3.84 + 1)/3]. Item separation was 5.19, with a reliability coefficient of 0.96.
Discussion
This study has evaluated the psychometric properties of WHODAS II in the SCI population from a classical and item response theory perspective. The WHODAS II presents adequate internal consistency and construct validity in that it discriminates between different levels of impairment and workforce involvement for most domains, and presents the pattern of convergent/divergent correlation coefficients with MOS SF-36. Most items fit a unidimensional model with exception of 5 items (related to standing, standing up, walking/wheeling long distances, sexual activities, and staying alone for a few days).
The WHODAS II was able to discriminate between individuals with high and low impairment SCI in terms of getting around, self-care, life activities (household and work) and total score. Interestingly, there was no differentiation between impairment levels for the domain of ‘participation in society’, supporting the suggestion that regardless of level and completeness of neurological lesion, individuals with a SCI may perceive similar degrees of difficulty in participation in society. This domain includes items such as “How much of a problem did you have in joining in community activities?”, “How much of a problem did you have because of barriers or hindrances in the world around you?” or “How much has your health been a drain on the financial resources of you or your family?” More so than any of the other WHODAS II domains, “Participation in society” incorporates the influence of personal and environmental factors beyond control of the person with SCI, including physical access, social attitudes, public services, systems and policies, impact of health and emotional problems, family support and financial situation.
Convergent/divergent validity was established between WHODAS II and MOS SF-36, however not with CHART. The median values for the CHART domains and the mean values for the SF-36 domains were consistent with previous reported data (27, 36), indicating that our sample represented a typical SCI population. One possible explanation for the poor results with CHART may be that the quantitative approach of CHART - where scores indicative of better participation are obtained with for example a higher number of contacts and/or household members, or more days spend out of the house – is not compatible with the more qualitative approach of WHODAS II where being able to maintain a single friendship and getting along with people close to you or experiencing no difficulties with leaving the home results in low disability scores. Conversely, a number of additional strong correlation coefficients were observed between domains that were not hypothesized a priori. This is possibly the result of large number of paired correlations, increasing the chance of type 1 errors. Such findings may also be a function of the overlapping features among those domains pertaining to social outcomes, as observed by Dijkers and colleagues (37).
Rasch analysis showed that 5 of the items misfit the Rasch model. Poor fit of these items means that the performance on these items cannot be predicted comfortably by what is known about these persons’ ability based on the overall WHODAS II total score. One possible explanation could be that these questions, unlike the other 32 questions, do not represent the same construct or are confounded by other factors. Two items relate to one’s ability to use legs (standing for long periods and standing up) and a third item may be interpreted as walking or wheeling. Indeed, 81% of the participants in this sample mobilized 100% of the time in a wheelchair while the remaining 19% were able to walk with or without an assistive device to varying degrees of independence. It is therefore not surprising that in a heterogenous group of persons with a SCI, including both walking and non-walking individuals, responses to these items would diverge from the expected ability/difficulty pattern based on the overall performance on the remaining items of the WHODAS II. The majority of those with unexpected responses to these two items were people with an incomplete SCI who were able to walk, but nevertheless experienced a considerable degree of disability in everyday life. Gerhart et al. (38) report that despite being ambulant and physically independent, many “minimally impaired” individuals experience significant problems with increased spasticity, pain, bladder and bowel difficulties, sexual dysfunction and psychosocial concerns. People with SCI who walk often experience more difficulties covering long distances due to the higher energy cost compared to wheeling. Furthermore, persons with greater preserved function and less obvious SCI impairments may receive less support and have higher expectations placed on them, which increases the burden of coping and may lead to disproportionately high levels of frustration, depression and even suicide (39).
The poor fit of item 4.5 ‘sexual activities’ could potentially be related to person’s interpretation of the meaning of this question, being in the context of purely physical functioning and sexual performance versus, as the domain would suggest, the interpersonal component of sexual relations. Advances in the medical management of sexual health after SCI (40) mean that most males with a SCI are now able to sustain an erection that permits sexual intercourse. Even persons who report great difficulty in the domains of getting around, self-care, life activities, and participation may score well on this item as ultimately what one considers to be ‘sexual activities’ and finds satisfying is personally defined.
The unexpected responses to item 3.4 (staying by yourself for a few days) also have a reasonable explanation. These responses were mostly from persons with complete tetraplegia who had adjusted very well to their SCI and had returned to work, were involved in recreational activities, and managed their own transportation. Yet, each person required up to 2 h a day of paid personal care to assist with bathing, dressing, and bowel and bladder care, and may have other medical concerns such as spasticity or risk of autonomic dysreflexia, that could explain why they were unable to stay alone for more than one day, despite experiencing low levels of disability in everyday life.
Although one could argue that misfit items weaken scale unidimensionality, deletion of these items is not necessarily appropriate as all 5 items provide important information that may distinguish a person with SCI in one or more of the components of activity and participation.
Results of the Rasch analysis suggest, however, that no items of the WHODAS II instrument are able to distinguish persons with a SCI with lesser degrees of disability (low scores on WHODAS II total score). This is a potential weakness of the WHODAS II in this population, however further study is warranted with a larger sample size. Further application of Rasch analyses on other chronic disease groups is also recommended for comparison with our results. Limited ability of the WHODAS II to differentiate among people with low disability was suggested in Garin et al’s (13) larger study that included people with multiple sclerosis, stroke, traumatic brain injury, and other conditions. This suggestion however was inferred from the presence of high ceiling effects on most domains. In comparisson with Garin’s study, our SCI population presented with 10 to 25 percent less ceiling effects on all domains except for the domain understanding and communication. We found similar patterns of ceiling effects as reported by Noonan et al. (20)
The study had several limitations. The sample size was relatively small and the findings need to be confirmed with larger studies. Our data set did not allow for the evaluation of other important properties such as sensitivity to change, and responsiveness.
In conclusion, this study has provided further support for reliability and validity of the WHODAS II in a SCI population, and has for the most part been able to confirm findings from the study by Noonan et al. (20) A number of limitations of the WHODAS II are noted from our study. First, ceiling effects are present in 4 out of 7 domains and present a concern if measurement of change over time or improvement following intervention is of interest. Secondly, there is a lack of spread of items along a continuum that would allow differentiation of persons with lower levels of disability. Finally, with 5 misfitting items there is questionable unidimensionality. Future research will need to determine whether the benefit of a generic measure of disability, applicable across different cultures and disability groups that allow for comparison among studies, outweighs the marginal benefits one may hope to find by using a condition specific instrument designed for use in a spinal cord injured population. Rasch rating scale analyses on a larger sample of persons with SCI are needed to confirm our results.
Acknowledgements
The study from which data was drawn for the present paper was funded by the Motor Accidents Authority of New South Wales.
References