OBJECTIVE: To determine outcomes for 2 rehabilitation strategies for patients with chronic pain: a 2-day interdisciplinary team assessment followed by either: (i) a 4-week outpatient multimodal rehabilitation programme, or (ii) a subsequent rehabilitation plan.
METHODS: After a 2-day interdisciplinary team assessment at our pain rehabilitation clinic 296 consecutive patients were selected to either multimodal rehabilitation (n = 76) or rehabilitation plan (n = 220). They completed questionnaires regarding pain intensity (Visual Analogue Scale), disability (Disability Rating Index), life satisfaction (LiSat-11), anxiety and depression (Hospital Anxiety and Depression Scale) at assessment and again at 1-year follow-up.
RESULTS: Both groups showed significant improvements at 1-year follow-up regarding pain intensity. In addition, the multimodal rehabilitation group improved in the disability items (“light work” and “heavy work”), depression and life satisfaction (“leisure”, “somatic health”, and “psychological health”). In the rehabilitation plan group “somatic health” improved, although not statistically significant.
CONCLUSION: This study indicates that multimodal rehabilitation may have long-term positive effects on pain, disability, depression and domains of life satisfaction. However, a minor intervention, rehabilitation plan with follow-up in primary care, can improve pain and “somatic health”. Based on the biopsychosocial approach, an interdisciplinary assessment of patients with chronic pain seems to be of value for selecting patients to different rehabilitation interventions.
Key words: pain; pain measurement; disability; patient satisfaction; cognitive therapy; behaviour therapy; interdisciplinary health teams; motivation.
J Rehabil Med 2012; 44: 764–773
Correspondence address: Daniel Merrick, Department of Community Medicine and Rehabilitation, Rehabilitation Medicine, Umeå University, 901 87 Umeå, Sweden. E-mail: daniel.merrick@rehabmed.umu.se
Submitted August 10, 2011; accepted April 18, 2012
INTRODUCTION
Pain of duration more than 3 months is considered to be chronic according to the International Association of Study of Pain (1, 2). Chronic pain accounts for significant economic and societal costs. For example, in 2003, productivity losses and direct healthcare expenditures attributed to chronic pain patients in Sweden were reported to be 9.5 billion Euros (2).
Chronic pain is common in Sweden and in other European countries, with a prevalence in the adult population reaching 15–19% (3, 4). Chronic pain conditions often have negative consequences on several aspects of daily life, such as participation in society during both leisure and working time, as well as on the total experience of life satisfaction (5).
Pain is a common cause for seeking primary healthcare. Previous studies have shown that pain is the most common reason for a visit to a primary care physician in Scandinavia, and that musculoskeletal pain constitutes the majority of the painful conditions in which 20–50% of patients experience chronic pain (6, 7).
The heterogeneity of patients affected by pain, together with physical, psychosocial and work-related factors may contribute to the persistence of pain (8). Moreover, psychological factors, such as depression, anxiety, stress and fear avoidance, as well as pain behaviour and coping strategies, all seem to play a significant role in the development of chronic pain (9). Therefore, pain researchers have emphasized that these factors should be addressed in assessment and interventions for patients with chronic pain (9, 10), and an interdisciplinary approach based on the biopsychosocial model (8) has been proposed to manage the entire complex spectrum of chronic pain.
During the last two decades, several studies have focused on multimodal rehabilitation of chronic pain (5, 11). Systematic reviews have shown that, compared with less extensive or no treatment, cognitive-behavioural multimodal rehabilitation (MMR) programmes produce significantly greater improvement in pain experience and cognitive coping, and reduce the behavioural expression of pain. The effects appear to be stable over time (11). However, this does not necessarily mean that all patients with chronic pain require multimodal treatment. It may be postulated that patients with less complex chronic pain states would, in some cases, benefit from unimodal treatments, e.g. physiotherapy or cognitive-oriented psychologist sessions (12–14), or a combination of treatments provided by a few non-team-related professions, i.e. intermediary rehabilitation (2). A team approach for the initial assessment may be important for the appropriate selection of patients for the adequate intervention. Although patients who participate in multimodal rehabilitation programmes probably undergo some kind of team assessment prior to the programmes, this procedure is poorly described in the literature.
Thus, to further investigate the team assessment in the rehabilitation process we conducted a longitudinal study of patients with chronic pain with a one-year follow-up of two different rehabilitation strategies, i.e. a two-day interdisciplinary team assessment followed by either: (i) a 4-week outpatient MMR programme, or (ii) a subsequent rehabilitation plan (RP), but no MMR. The aims were:
• to describe the selection procedure for the two rehabilitation strategies;
• to determine the outcomes of the two rehabilitation strategies at 1-year follow-up regarding pain intensity, activity, depression, anxiety and life satisfaction.
METHODS
Design
The present study is a prospective longitudinal study with a one-year follow-up of two different rehabilitation strategies for patients with chronic pain. The study was conducted in a clinical setting at the Pain Rehabilitation Clinic at the Umeå University Hospital, Sweden.
Patients
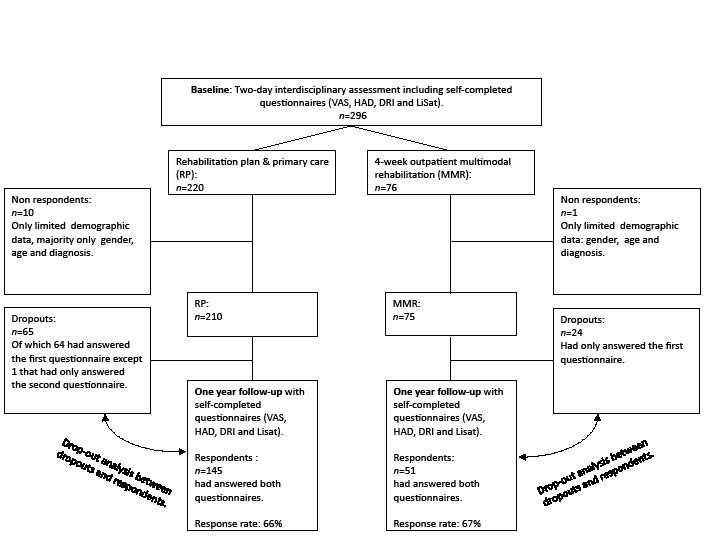
A total of 296 patients with disabling chronic musculoskeletal pain (on sick leave or experiencing major interference in daily life due to chronic pain causing treatment-seeking behaviour) were referred mainly from primary care units to our pain rehabilitation clinic and assessed consecutively by interdisciplinary teams between 1 October 2007 and 30 September 2008. Written and signed informed consent was obtained from all participants. Seventy-six patients were eligible for an outpatient, MMR programme during 4 weeks. A total of 220 patients were selected to the rehabilitation plan and primary care group (RP). Both groups were followed up after 1 year (Fig. 1). This study was performed according to the Declaration of Helsinki and approved by the Regional Ethical Review Board of Umeå University (Dnr: 08-160M).
Fig. 1. Chart showing the flow of patients at assessment and at one-year follow-up.
Two-day interdisciplinary assessment
The referred patients were assessed during two days at the pain rehabilitation clinic by interdisciplinary teams consisting of a specialist physician in rehabilitation medicine, a physiotherapist, a social worker, an occupational therapist, and a cognitively trained psychologist if needed. Each professional interviewed and examined the patients individually according to a standardized protocol. This 2-day team assessment was based on a biopsychosocial approach that considers the physical, psychosocial and social aspects of the chronic pain condition.
The physician’s assessment included the following: a pain history and clinical examination to exclude serious underlying conditions that would cause pain; need for further investigations, e.g. imaging, blood tests, other specialist referrals; and/or optimization of the pharmacological treatment. The psychologist assessed psychological factors, such as anxiety and depression. Coping strategies were assessed by the psychologist and the social worker. The physiotherapist performed a structured physical examination, and the occupational therapist examined activity levels in daily life. The team also assessed the patients’ expectations and readiness for change. The team discussed their separate findings and then provided suggestions for further investigation and/or rehabilitation at a team conference in the absence of the patient. On the second day findings, appraisals and recommendation of rehabilitation were discussed at a team conference together with the patient, and the referring general practitioner was also invited to attend. During the conference the patient received information and explanations about their pain and had an opportunity to ask clarifying questions.
Multimodal rehabilitation programme
If the interdisciplinary teams assessed that the patient needed a MMR, was motivated to participate, agreed to the content of the rehabilitation programme, and fulfilled the inclusion criteria, they were accepted to this programme at the Pain Rehabilitation Clinic, at the Umeå University Hospital. Inclusion criteria for the MMR programme were: (i) disabling chronic pain (on sick leave or experiencing major interference in daily life due to chronic pain); (ii) age between 18 and 65 years; (iii) no further medical investigations needed; (iv) written consent to participate and attend to the MMR programme; (v) agreement not to participate in other parallel treatments.
Exclusion criteria were: (i) ongoing major somatic or psychiatric disease; (ii) a history of significant substance abuse; and (iii) state of acute crisis.
The MMR was based on cognitive-behavioural principles (15). The MMR programme included physical therapy (exercises, relaxation and body-awareness training) and occupational therapy (ergonomics), information about bodily and psychological reactions to chronic pain, training in coping strategies as well as education in pain management. The patients were encouraged to take an active part with goal-setting in the individual team conferences, which were held 2–4 times during the course of the programme. Most treatments were conducted in groups of 6–8 participants, but each participant also had individually tailored sessions with the different members of the team.
The group schedule over the 4 weeks contained 34 h of physiotherapy sessions, 11.5 h of occupational therapy sessions, 15 hours of psychology sessions, 2 h of lectures from a physician in rehabilitation medicine, and 2 h of general information. At the end of the programme contacts were established with external collaborating partners, such as the workplace, the social insurance agency and the patient’s general practitioner.
Rehabilitation plan and primary care group
If the interdisciplinary teams considered that the patient needed further investigation, or were not motivated to participate in the programme, or would benefit from unimodal or intermediary treatments only, and/or did not fulfil the inclusion criteria for the rehabilitation programme, a rehabilitation plan was presented to the patient and his/her general practitioner. The rehabilitation plan included team assessment of the patient’s pain condition and suggestions and recommendations for further treatment for the RP group. If the patient’s general practitioner could not attend the conference, the individual rehabilitation plan was sent to him/her to monitor.
The general goals for both interventions were reduced pain intensity, and improved activity and life satisfaction, especially regarding somatic and psychological health. In addition, the specific goals in the MMR group were to improve their coping strategies during the 4-week outpatient programme and improve their working ability. In the present study we did not include variables such as sick leave and return to work since these will be included in an upcoming study.
Procedure
Information concerning the team conferences and rehabilitation plans was collected from the medical records. Postal questionnaires containing standardized instruments included in the Swedish Quality Registry for Pain Rehabilitation (SQRP) (16) were used at the initial interdisciplinary team assessment and at one-year follow-up for both groups. The questionnaires covered demographics, pain intensity, anxiety/depression, disability and life satisfaction, as well as patients’ beliefs about recovery. The patients completed the first set of questionnaires at home and handed them in at the initial assessment. For the one-year follow-up patients completed the second questionnaire at home to be returned by post in prepaid addressed envelopes. If the patients had not answered within 3 weeks reminders were sent out by post, and in some cases the patients were reminded by phone.
Questionnaires
The focus in our study was on pain intensity, activity, depression, anxiety and life satisfaction including psychological health. This is reflected in the self-completed questionnaires described below.
Visual Analogue Scale
The visual analogue scale (VAS) was used to rate pain intensity for the previous 7 days (mean pain last week) and current pain (17). The patient was asked to mark his or her experienced pain on a continuous 100-mm horizontal VAS. The anchor points were “no pain” = 0 and “worst pain imaginable” = 100.
Hospital Anxiety and Depression Scale
The Hospital Anxiety and Depression Scale (HADS) (18, 19) was used to identify symptoms of anxiety and depression. It consists of 14 items (7 items in each subscale) to be assessed on a 4-point Likert scale (range 0–3), where the total score is the sum of each subscale (range 0–21). HADS is categorized as “normal”, “mild” and moderate/severe.
Disability Rating Index
The level of disability was measured by the Disability Rating Index (DRI) (20). The DRI instrument is a questionnaire covering 12 items concerning physical function and is constructed as a self-administered form where the patient indicates their presumed ability (capacity) to perform various daily physical activities on a 100-mm visual analogue scale. The anchor points were “manage without difficulty” = 0 and “cannot manage at all” = 100. The DRI items can be analysed separately and/or as a total mean index score, the DRI Index.
LiSat-11
Life satisfaction was assessed using the LiSat-11 questionnaire (21), which comprises estimations of life satisfaction in 11 domains. Levels of satisfaction were assessed on a 6-grade scale (from 1 = very dissatisfying to 6 = very satisfying), i.e. higher scores indicate higher levels of life satisfaction. The LiSat-11 scale was dichotomized into either satisfied (5–6) or not satisfied (1–4). Only persons with a family, partner, etc., were asked to complete the relationship domains.
Statistical analyses
Data were analysed using SPSS version 18.0 software and are reported as means (standard deviation (SD)) unless indicated otherwise. For the DRI items in Tables II, III and IV, data are reported as median and interquartiles. Differences between groups at the baseline were tested with Mann-Whitney U tests and χ2 tests. Wilcoxon test and the McNemar test were used for analyses of the two rehabilitation strategies groups over time. In order to avoid mass significance we interpreted p-values < 0.01 as statistically significant.
Univariate logistic regression analyses were employed to analyse association between the life satisfaction domains “life as a whole”, “somatic health” and “psychological health” at 1-year follow-up, and the following dichotomized variables: anxiety (normal and mild vs moderate/severe), depression (normal and mild vs moderate/severe), gender (female/male), patients’ beliefs about recovery (positive vs negative), education (university vs primary school and secondary school), activity impairment (DRI index; 0–50 mm vs 51–100 mm), pain intensity VAS (current pain; 0–50 mm vs 51–100), age (≤ 39 vs > 39 years), and intervention (MMR vs RP). Variables that had a p-value < 0.3 in the univariate regression analyses were then included in the stepwise multiple regression analyses. The results of the logistic regression analyses are presented as odds ratios (OR). The reliability of the OR is expressed as 95% confidence interval (CI). Statistical significance was set at p < 0.05 for the multiple regression analyses.
RESULTS
A total of 296 consecutive patients at our Pain Rehabilitation Clinic were assessed for selection to either a multimodal rehabilitation programme (n = 76) or a rehabilitation plan (n = 220). Fig. 1 shows a flow-chart of the population distributions. Data were missing for 10 patients in the RP group and 1 patient in the MMR group, and these patients were thus excluded (“non-respondents”). Both the first questionnaire at the 2-day assessment and the second questionnaire after 1 year regarding pain intensity (VAS current pain and VAS pain average last week), the 12 DRI items, LiSat-11 and HADS were completed by 145 patients in the RP group and by 51 patients in the MMR group.
Rehabilitation plans
The general practitioners were present at 37 cases (17%) of team conferences on the second day of the assessment for the RP group. The most common sets of recommendations in the rehabilitation plans are shown in Table I.
| Table I. Distribution (percentage) of recommendations in the rehabilitation plans |
| Recommendations | % |
| Radiological investigation (X-ray, magnetic resonance imaging), physiotherapy, psychological therapy and pharmacological treatment) Physiotherapy and psychological therapy Physiotherapy and pharmacological treatment Physiotherapy, radiological investigation and pharmacological treatment Physiotherapy, psychological therapy and pharmacological treatment Physiotherapy Physiotherapy and radiological investigation Occupational therapy and physiotherapy Radiological investigation and pharmacological treatment Physiotherapy and occupational therapy | 16 16 15 10 10 8 7 6 6 6 |
Drop-out analyses
Patients who had answered both the first and the second questionnaires (“respondents”; MMR: n = 51; RP group: n = 145) were compared with those who had completed only one questionnaire (drop-outs; MMR group: n = 24; RP group: n = 65). The comparisons were made in each intervention group separately (Table II).
| Table II. Comparison between those who answered both questionnaires (respondents) and those who answered only one questionnaire (drop-outs) in the 2 rehabilitation strategies at baseline |
| Variable | n | RP Respondents Baseline | n | Drop-outs Baseline | Differences between respondents and drop-outs p-value | n | MMR Respondents Baseline | n | Drop-outs Baseline | Differences between respondents and drop-outs p-value |
| Age, mean (SD) Current pain, mean (SD) Pain last week, mean (SD) DRI, median (percentiles 25; 75) Dressing without help Outdoor walks Climbing stairs Sitting for a longer period Standing bent over a sink Carrying a bag Making a bed Running Light work Heavy work Lifting heavy objects Participating in sports/exercise DRI index HADS: Anxiety, % Normal Mild Moderate/Severe HADS: Depression, % Normal Mild Moderate/Severe LiSat-11, % satisfied Life as a whole Vocation Economy Leisure Contacts with friends and acquaintances Sexual life Daily activities Family life Partner relationship Somatic health Psychological health | 145 145 145 143 143 144 145 140 144 144 144 144 144 145 144 145 144 144 144 141 144 144 144 140 144 130 119 143 143 | 40 (10) 62 (21) 67 (19) 5 (1; 20) 24 (5; 55) 27 (4; 51) 50 (30; 75) 48 (17; 73) 51 (29; 75) 33 (12; 59) 86 (52; 97) 43 (18; 63) 89 (67; 98) 95 (73; 99) 63 (36; 86) 51 (38; 63) 63.9 14.6 21.5 54.9 22.9 22.2 31.3 23.4 31.3 23.6 45.8 33.6 51.4 64.6 68.9 6.3 38.5 | 65 64 64 64 64 64 64 64 64 64 64 64 64 64 63 64 63 63 62 60 61 63 62 60 61 49 44 63 63 | 36 (11) 61 (22) 69 (20) 7 (1; 21) 46 (14; 69) 35 (11; 52) 53 (30; 82) 55 (18; 82) 53 (32; 80) 32 (9; 63) 87 (51; 98) 47 (23; 55) 93 (85; 99) 94 (81; 100) 77 (52; 95) 56 (44; 67) 52.4 14.3 33.3 47.6 12.7 39.7 24.2 18.3 21.3 12.7 40.5 33.3 41.0 59.2 68.2 4.8 23.8 | 0.005 ns ns ns 0.019 ns ns ns ns ns ns ns ns ns 0.013 ns ns 0.022 ns ns ns ns ns ns ns ns ns ns 0.041 | 51 51 51 51 51 51 51 51 51 51 50 51 51 50 51 51 51 51 51 50 51 51 51 48 51 48 46 51 51 | 39 (10) 59 (22) 64 (22) 3 (0; 10) 22 (4; 47) 22 (6; 38) 56 (22; 79) 49 (12; 67) 54 (25; 79) 21 (5; 49) 76 (26; 95) 30 (15; 56) 85 (58; 97) 94 (71; 98) 47 (20; 78) 43 (33; 60) 56.9 23.5 19.6 52.9 17.6 29.4 35.3 26.0 35.3 11.8 21.6 48.2 64.7 70.8 78.3 0.0 21.6 | 24 23 23 24 24 24 23 24 24 24 24 24 24 24 24 24 23 23 23 22 23 22 22 23 23 20 17 23 23 | 39 (9) 57 (17) 60 (14) 2 (1; 27) 6 (1; 25) 20 (1; 32) 42 (17; 65) 43 (2; 77) 56 (22; 89) 30 (7; 62) 48 (19; 87) 46 (22; 68) 87 (57; 95) 90 (76; 99) 52 (23; 83) 43 (31; 60) 60.9 13.0 26.1 56.5 17.4 26.1 21.7 13.6 17.4 13.6 31.8 21.7 43.5 60.0 70.6 8.7 39.1% | ns ns ns ns ns ns ns ns ns ns ns ns ns ns ns ns ns ns ns ns ns ns ns ns ns ns ns 0.033 ns |
| p-value < 0.01 considered significant, but p-values between 0.01 and 0.05 are also shown. RP: rehabilitation plan; MMR: multimodal rehabilitation; ns: not significant; SD: standard deviation; HADS: Hospital Anxiety and Depression Scale; DRI: Disability Rating Index; LiSat-11: Life Satisfaction 11 questionnaire. |
At baseline there were no significant differences between the drop-outs and the respondents in terms of disability, anxiety, depression and life satisfaction in general for both the RP group and the MMR group. In the RP group the only significant difference was found for age (p = 0.005), where the drop-outs were younger.
One-year follow-up in the MMR group
For the MMR group the pain intensity decreased significantly from 59 (SD 22) to 46 (SD 27) mm for “VAS current pain” (p = 0.002) and from 64 (SD 22) to 47 (SD 27) mm regarding VAS “mean pain last week” (p < 0.001) at 1-year follow-up. Compared with baseline the DRI items “light work” (p < 0.001), “heavy work” (p < 0.002) and DRI index (p = 0.007) together with depression (p =0.007) improved significantly at 1-year follow-up. The MMR group also improved significantly regarding the life satisfaction domains “leisure” (p =0.001), “somatic health” (p < 0.001), and “psychological health” (p < 0.001). Table III describes these comparisons.
| Table III. Differences at 1-year follow-up compared with baseline in each group |
| Variable | n | RP Baseline | Follow-up | RP over time p-value | n | MMR Baseline | Follow-up | MMR over time p-value |
| Current pain, mean (SD) Pain last week, mean (SD) DRI, median (percentiles 25; 75) Dressing without help Outdoor walks Climbing stairs Sitting for a longer period Standing bent over a sink Carrying a bag Making a bed Running Light work Heavy work Lifting heavy objects Participating in sports/exercise DRI index HADS: Anxiety, % Normal Mild Moderate/severe HADS: Depression , % Normal Mild Moderate/severe LiSat-11, % satisfied Life as a whole Vocation Economy Leisure Contacts with friends and acquaintances Sexual life Daily activities Family life Partner relationship Somatic health Psychological health | 143 143 142 142 143 142 137 143 143 142 143 143 144 143 144 143 143 142 139 143 142 143 137 143 128 112 141 141 | 62 (21) 67 (19) 5 (1; 20) 25 (5; 55) 27 (5; 51) 50 (32; 76) 48 (18; 74) 50 (29; 75) 31 (12; 59) 86 (52; 97) 41 (18; 63) 88 (67; 98) 95 (73; 99) 62 (35; 86) 51 (38; 63) 6.6 (4.6) 64.3 14.0 21.7 7.2 (4.6) 54.5 23.1 22.4 31.0 23.0 30.8 23.2 46.2 33.6 51.0 64.8 71.4 5.7 39.0 | 57 (25) 60 (24) 5 (0; 25) 31 (5; 56) 30 (3; 64) 48 (21; 74) 51 (17; 80) 53 (28; 75) 34 (6; 62) 86 (44; 100) 33 (13; 60) 82 (61; 97) 91 (66; 100) 57 (29; 89) 49 (34; 65) 6.9 (5.0) 55.9 23.1 21.0 7.2 (4.7) 55.9 18.9 25.2 28.9 24.5 23.1 23.2 35.7 28.5 54.5 60.9 60.7 12.8 43.3 | 0.025 < 0.001 ns ns ns ns ns ns ns ns ns ns 0.034 ns ns ns ns ns ns ns ns 0.02 ns ns ns 0.043 0.013 ns | 51 51 50 50 50 50 50 50 50 49 50 50 49 50 50 50 50 49 50 50 50 50 47 50 46 45 50 50 | 59 (22.4) 64 (21.9) 3 (0; 11) 22 (4; 48) 22 (6; 38) 57 (22; 79) 48 (12; 68) 53 (25; 79) 21 (5; 50) 76 (26; 96) 31 (15; 57) 88 (58; 97) 94 (70; 98) 47 (20; 80) 44 (33; 60) 7.2 (4.1) 56.0 24.0 20.0 8.0 (4.2) 52.0 18.0 30.0 34.7 26.0 34.0 10.0 20.0 40.4 64.0 71.7 77.8 0.0 20.0 | 46 (27) 47 (27) 3 (0; 14) 11 (0; 33) 15 (0; 35) 50 (23; 63) 26 (7; 52) 48 (23; 71) 14 (0; 47) 66 (27; 84) 17 (0; 31) 65 (46; 87) 87 (56; 97) 31 (12; 56) 39 (22; 56) 6.4 (3.6) 68.0 14.0 18.0 5.4 (3.4) 74.0 18.0 8.0 51.0 26.0 36.0 36.0 38.0 51.1 66.0 82.6 84.4 20.0 50.0 | 0.002 < 0.001 ns 0.043 ns 0.028 ns ns ns ns <0.001 0.002 ns 0.014 0.007 ns 0.007 ns ns ns 0.001 0.035 ns ns ns ns 0.0012 0.001 |
| p-value < 0.01 considered as significant, but p-values between 0.01 and 0.05 are also shown. RP: rehabilitation plan; MMR: multimodal rehabilitation programme; ns: not significant; SD: standard deviation; HADS: Hospital Anxiety and Depression Scale; DRI: Disability Rating Index; LiSat-11: Life Satisfaction 11 questionnaire. |
One-year follow-up in the rehabilitation plan group
For the RP group, pain intensity decreased significantly, from 67 (SD 19) to 60 (SD 24) mm for VAS “mean pain last week” at 1-year follow-up (p < 0.001). Only the LiSat domain “somatic health” improved at 1-year follow-up (p = 0.013), increasing from 5.7% satisfied patients at baseline to 12.8% at 1-year follow-up. No statistically significant improvements were found for the other variables. Table III describes these comparisons.
Comparisons at baseline between rehabilitation plan and multimodal rehabilitation groups
At baseline the MMR group had a more a positive outlook (p = 0.008), were more satisfied with “contact with friends and acquaintances” (0.003), and had significantly better capacity scores regarding the DRI items; “outdoor walks” (p = 0.006), “running” (p = 0.003) and “participating in sports/exercise” (p = 0.001). Table IV describes these comparisons. Since there were significant differences between the groups at baseline we decided not to compare the groups over time.
| Table IV. Comparison between rehabilitation plan (RP) and multimodal rehabilitation (MMR) programme at baseline |
| | n | RP | Mean (SD) | n | MMR | Mean (SD) | p-value |
| Demographic characteristics Age, mean (SD) Gender (females %) Education, % Primary Secondary school University Job status, % Employed Unemployed Students Others Pain condition characteristics, mean (SD) Current pain, mm Mean pain last week, mm Years with chronic pain How convinced are you about recovery? % 5-category scale: 1–3: positive outlook 4–5: negative outlook HADS: Anxiety, % Normal Mild Moderate/severe HADS: Depression, % Normal Mild Moderate/severe Diagnostic groups, % Columnar pain Extremity pain Widespread pain (RA, fibromyalgia) Headaches Somatoform pain Stress related disorders Repetitive strains WAD Others Missing data | 210 210 205 207 209 209 172 198 207 207 | 38.9 (10.5) 62 19.5 63.4 17.1 59.4 26.1 4.3 10.2 62 (22) 68 (19) 6.2 (6.4) 34.3 65.7 60.4 14.5 25.1 52.7 19.8 27.5 49.5 19.5 0.5 2.4 6.7 2.9 5.2 6.2 3.8 3.3 | 7.1 (4.8) 7.6 (4.7) | 75 75 73 74 74 74 61 73 74 74 | 39.2 (9.7) 76 17.8 58.9 23.3 75.7 14.9 4.1 5.5 58 (21) 62 (20) 5.2 (5.0) 52.1 47.9 58.1 20.3 21.6 54.1 17.6 28.4 49.3 14.7 1.3 – 14.7 – 2.7 5.3 6.7 5.3 | 7.0 (4.3) 7.8 (4.5) | ns 0.027 ns ns ns 0.043 ns 0.008 ns ns ns |
| Table IV. Contd. |
| LiSat-11, satisfied, % Life as a whole Vocation Economy Leisure Contacts with friends and acquaintances Sexual life Daily activities Family life Partner relationship Somatic health Psychological health DRI, median (percentiles 25; 75) Dressing without help Outdoor walks Climbing stairs Sitting for a longer period Standing bent over a sink Carrying a bag Making a bed Running Light work Heavy work Lifting heavy objects Participating in sports/exercise DRI index, median (percentiles 25; 75) | 206 201 205 207 206 200 205 179 163 206 206 207 207 208 209 204 208 208 208 208 208 209 207 209 | 29.1 21.9 28.3 20.3 44.2 33.5 48.3 63.1 68.7 5.8 34.0 5 (1; 20) 27 (9; 60) 28 (8; 53) 50 (30; 77) 51 (18; 78) 52 (30; 75) 32 (11; 60) 87 (52; 97) 45 (20; 62) 92 (73; 99) 95 (78; 99) 70 (44; 89) 52 (39; 65) | | 74 72 74 73 73 71 74 68 63 74 74 75 75 75 74 75 75 75 74 75 75 74 75 75 | 31.1 22.2 29.7 12.3 24.7 35.2 58.1 67.6 76.2 2.7 27.0 3 (0; 17) 18 (2; 39) 22 (5; 36) 52 (22; 76) 47 (10; 74) 55 (25; 80) 25 (5; 56) 65 (26; 95) 33 (16; 60) 85 (58; 96) 93 (74; 98) 49 (23; 81) 42 (32; 60) | | ns ns ns ns 0.003 ns ns ns ns ns ns ns 0.006 0.029 ns ns ns ns 0.003 ns 0.055 ns 0.001 0.019 |
| p-value <0.01 considered as significant, but p-values between 0.01 and 0.05 are also shown. ns: not significant; HADS: Hospital Anxiety and Depression Scale; DRI: Disability Rating Index; LiSat-11: Life Satisfaction 11 questionnaire; WAD: whiplash associated disorders; RA: rheumatoid arthritis; SD: standard deviation. |
Patients’ pre-treatments beliefs about recovery
When analysing the MMR and the RP groups together, all patients with a positive outlook regarding recovery before the interventions had a significant mean “VAS current pain” intensity score reduction of 11 mm (SD 27) at 1-year follow-up, compared with a reduction of 3.0 mm (SD 22) for those with a negative outlook (p = 0.021). For VAS “mean pain last week” the mean reduction for those with a positive outlook was 16 mm (SD 26), compared with 6.0 mm (SD 20) for those with a negative outlook at 1-year follow-up (p = 0.001). For DRI index the positive outlook group had a mean reduction of 9.0 ± 20 mm, compared with an increase of 1.0 ± 16 mm for the negative outlook group at 1-year follow-up (p = 0.001).
Univariate logistic regression and stepwise multivariate analyses
Univariate logistic regression analyses were performed, and the variables obtained with p-values < 0.3 underwent stepwise multiple regression analyses (Table V). In the stepwise multivariate analysis low depression scores and positive belief about recovery at baseline were associated with satisfied patients in both the domains “Life as a whole” and “Psychological health” at 1-year follow-up. In addition, selection to MMR and low current pain intensity, were also associated with satisfied patients in the domain “Life as a whole” in the stepwise multivariate analysis. Only low activity impairment was associated with satisfied patients in the domain “Somatic health”, in the stepwise multivariate analysis (Table V).
| Table V. Univariate logistic regression and stepwise multivariate analyses |
| Covariates | n | OR (95% CI) | p-value | Dependent |
| Univariate logistic regression Normal and mild anxiety Normal and mild depression Woman Positive belief about recovery University education Low activity impairment Age Low current pain intensity Multimodal rehabilitation Multiple logistic regression Multimodal rehabilitation Normal/mild depression Low current pain intensity Positive belief about recovery Univariate logistic regression Normal and mild anxiety Normal and mild depression Woman Positive belief about recovery University education Low activity impairment Age Low current pain intensity Multimodal rehabilitation Multiple logistic regression Low activity impairment Univariate logistic regression Normal and mild anxiety Normal and mild depression Woman Positive belief about recovery University education Low activity impairment Age Low current pain intensity Multimodal rehabilitation Multiple logistic regression Positive belief about recovery Normal/mild depression | 191 191 192 182 189 186 192 192 192 176 176 176 176 192 192 193 183 190 186 193 193 193 186 192 192 193 183 190 186 193 193 193 173 173 | 3.1 (1.3–7.6) 2.3 (1.0–4.9) 1.9 (1.0–3.9) 3.1 (1.7–5.9) 1.2 (0.6–2.5) 1.9 (1.0–3.4) 1.1 (0.6–1.9) 2.9 (1.5–5.5) 2.6 (1.3–5.0) 2.8 (1.3–6.1) 2.6 (1.1–6.5) 3.5 (1.7–7.2) 2.4 (1.1–4.8) 0.8 (0.5–3.2) 1.3 (0.5–3.1) 2.1 (0.8–5.9) 1.5 (0.6–3.6) 0.7 (0.6–3.8) 2.5 (1.0–6.0) 2.1 (0.9–4.7) 2.1 (0.9–4.7) 1.7 (0.7–4.1) 2.5 (1.0–6.0) 2.7 (1.3–5.8) 2.3 (1.2–4.7) 1.0 (0.5–1.8) 2.1 (1.2–4.0) 1.5 (0.7–3.1) 1.5 (0.8–2.7) 1.1 (0.5–1.7) 1.7 (0.9–3.2) 1.3 (0.7–2.5) 2.0 (1.1–3.9) 2.4 (1.1–5.3) | 0.010 0.039 0.065 0.0005 0.62 0.048 0.84 0.001 0.005 0.010 0.036 0.001 0.019 0.61 0.59 0.15 0.34 0.43 0.045 0.089 0.085 0.20 0.045 0.011 0.019 0.92 0.015 0.28 0.17 0.83 0.097 0.42 0.029 0.026 | Satisfied in ”Life as a whole” Satisfied in ”Life as a whole” Satisfied in ”Somatic health” Satisfied in ”Somatic health” Satisfied in ”Psychological health” Satisfied in ”Psychological health” |
| OR: odds ratio; 95% CI: 95% confidence interval. |
DISCUSSION
In the present study, two strategies for chronic pain patients were followed-up after one year: a two-day interdisciplinary team assessment followed by either (i) a 4-week outpatient MMR, or (ii) a subsequent RP and primary care. Both groups improved at one-year follow-up. The MMR group showed long-term effects on pain, disability, depression and several domains of life satisfaction, while the patients in the RP group showed positive results regarding pain and somatic health.
We also described the assessment and selection procedure of patients for MMR or RP. In our study patients beliefs about recovery and the judgement by the interdisciplinary teams on no further investigation, were important factors to be selected for the MMR programme. In the RP group 40% of patients needed further investigation and generally had more negative beliefs about recovery and were therefore referred back to primary care for follow-up of the rehabilitation plan.
It seems reasonable to assume that patients with chronic pain undergo some kind of assessment before participating in multimodal rehabilitation programmes. There is a lack of studies of the assessment and selection procedure prior to rehabilitation programmes and these procedures are poorly described in the literature (22, 23). However, the effects of MMR programmes are fairly well documented in several studies (5, 22).
For patients attending pain clinics, the explanation of their problem is considered important for the relief of their pain (24). Improved understanding of patients’ expectations by pain clinic clinicians may lead to better patient understanding of their pain and greater life satisfaction (24). Niemistö et al. (12, 25) have reported positive long-term results for chronic pain after a physician consultation that included proper information about the pain condition and advice for the future. The two-day interdisciplinary assessment in the present study also included information about and explanation of pain, which may have contributed to the results in both groups at one-year follow-up.
The rehabilitation programme interventions for chronic pain are unique, in the sense that the patient him/herself plays a crucial role in the rehabilitation process and participation in the MMR interventions as an active team member. In the present study there were some significant differences between the MMR group and the RP group at baseline. The patients in the MMR group with positive beliefs about recovery were more satisfied regarding the LiSat-11 domain “contacts with friends and acquaintances”, and reported somewhat better activity results. The patients’ beliefs about their future can affect the long-term results (26, 27) and may have been a factor that was observed by the assessment teams, since a large proportion of those who were less convinced about the recovery was selected to the RP group. These results are also in accordance with a study by Foster et al. (28), who reported that patients expecting their back problem to last a long time were more likely to have poor clinical outcomes.
In a separate analysis on patients’ beliefs about recovery’, we analysed the MMR and the RP groups together and divided them into two groups: positive vs negative beliefs about recovery based on their answers during the two-day interdisciplinary assessment. The “positive group” showed a significant decrease in pain intensity and increase in level of activity at one-year follow-up compared with those with negative beliefs. In the stepwise multivariate analyses, the variable “positive belief about recovery” was significantly associated with satisfied patients in the domains “Life as a whole”, and “Psychological health”. These results are in agreement with some other studies that have shown that patients’ beliefs seem to predict positive outcome concerning increased quality of life (27, 29).
MMR has been shown to have positive long-term effects on chronic pain in several areas (2, 5, 22). In line with a previous Swedish study by Westman et al. (30), who also used the same self-completed questionnaires (VAS, DRI and HADS) as in the present study and who reported positive results at a 5-year follow-up, the scores on these instruments improved significantly in our MMR group. The long-term effects with decreased pain and a higher level of activity after MMR may also reflect perceived life satisfaction, which is in agreement with previous studies (30, 31).
According to the SQRP 2008 annual report for patients referred to rehabilitation clinics in Sweden, the majority of patients were only assessed and were not selected to MMR (16). Since the SQRP only includes and evaluates patients who participate in MMR, we decided to also conduct a follow-up of the patients not selected for MMR. In our study we found positive results on pain and somatic health after a two-day interdisciplinary team assessment and a rehabilitation plan. This may be of importance since there are patients with chronic pain who may benefit from less intense rehabilitation interventions. Patients with chronic pain are a heterogeneous group (32). Some previous studies have shown that unimodal treatments alone with a cognitive-behavioural approach resulted in positive findings regarding pain intensity, disability and healthcare consumption, and were cost-effective compared with semi-light outpatient multidisciplinary rehabilitation programmes (14, 33). Although the RP group probably included both those patients who were assessed as being likely to benefit from simpler interventions and those assessed as being in need of further investigations, the positive findings in the RP group seem to be in line with the studies above, which indicate that it is not cost-effective to treat all patients with chronic pain in time-consuming and costly multimodal settings (14, 33). Instead, the focus should be on finding the correct subgroups and providing suitable interventions. The first step in identifying the patients’ impairments in different areas is likely to undergo an interdisciplinary team assessment.
It is interesting to note that depression was a significant factor in the present study for both interventions at one-year follow-up. Both groups had a higher extent of moderate/severe depression (MMR group: 30%; RP group: 22%) at baseline in comparison with a non-clinical sample of representative members of the general population in a western European country (3.6%) (34). Moreover, in comparison with patients with chronic pain in a Danish multimodal programme who reported a HADS depression total score of 6.8 (35), the MMR patients were also more depressed (total score of 7.8). Among the drop-outs in the RP group almost 40% had moderate/severe depression, compared with 22% of the respondents. A possible explanation for the drop-outs from the study was their severe depression state.
Indeed, depression is common among patients with chronic pain and has been found to increase the risk for higher pain intensity, reduced activity levels and deteriorated social and occupational functioning and life satisfaction (9). In accordance with Börsbo et al. (36), our study emphasizes that psychological factors, such as depression, seem to be essential for its impact on quality of life and disability. It is well known that chronic pain can trigger depressive symptoms, and that depression, in turn, increases the adverse effects of pain. These two conditions work in a negatively synergic way, in that the depression reinforces the chronic pain and the chronic pain promotes depressive symptoms, which together can result in reduced physical activity and life satisfaction (36). It seems that the MMR cognitive-behavioural programme improved subject’s self-perceived depression level measured by HADS at one-year follow-up despite their high level of moderate/severe depression at baseline. This was also noted in that the LiSat domain “psychological health” improved. Moreover, in the stepwise multivariate analyses, we found that low depression scores at assessment was associated with satisfaction regarding “life as a whole” and “psychological health” after one year. Hence, an improvement in chronic pain patients’ depression score over time would possibly result in a self-perceived increased activity and life satisfaction, which occurred in the MMR group.
Certain methodological considerations need to be highlighted in the present study. Since we used an already existing registry, the Swedish Quality Registry for Pain Rehabilitation (SQRP) (16), other outcome measures of interest were not included. It would of course had been of value to have had validated questionnaires covering coping, fear avoidance, etc. Although we lacked questionnaires covering these topics the included questionnaires are validated and have been widely used in clinical practice for assessment of pain intensity, anxiety and depression, disability, and life satisfaction in patients with chronic pain (17–21). In addition, the questionnaires are used nationwide since they are included in the SQRP (16). Accordingly, our instruments can be considered as appropriate for the assessment of patients with chronic pain.
The difference between statistical significance and minimal clinically important differences (MCID) (37) is of vital clinical interest. MCID for pain intensity has been described by Hagg (38) to correspond to 18–19 units on VAS and by Salaffi (39) to a mean reduction of 15% . With these results in mind, the MMR group decreased in pain intensity by 13 mm (22%) for “current pain”, and by 17 mm (27%) for “mean pain last week”, which in our study could be considered as clinically important.
Our aim was to audit the quality of care in both groups over time, not to perform a randomized controlled study. Hence, the patients served as their own historical controls. Moreover, no comparisons between the groups were made over time since they were different at baseline. Another limitation of our study was the lack of control group because our data were generated in a clinical setting in ordinary healthcare. One may, of course, argue that the changes observed represent a spontaneous improvement over time. However, it is known that once chronic pain is established it is unlikely to resolve itself without interventions (40). Compared with the SQRP 2008 annual report with about 600 chronic pain patients our patients in the MMR program were in the same age group, slightly more were university educated (23% vs 21%), and a lower proportion were unemployed (15% vs 26%) (16). Concerning the same comparison with approximately 1,400 chronic pain patients who were only assessed, our RP patients were 3 years younger (mean), we had less females (62% vs 74%), and a lower proportion of our patients were unemployed (26% vs 38%) (16).
In conclusion, the present study indicates that MMR has long-term effects on pain, disability, depression and several domains of life satisfaction, including somatic health and psychological health. Our findings also demonstrate that a less intense intervention, such as a two-day interdisciplinary assessment with a subsequent rehabilitation plan (RP group) with follow-up in primary care, can have long-term results on pain and somatic health in patients assessed as not eligible for MMR. In addition, an interdisciplinary team assessment for patients with chronic pain prior to their participation in rehabilitation based on the biopsychosocial approach may be of value for selection and recommendation of different rehabilitation strategies.
REFERENCES