OBJECTIVE: Atrial fibrillation diminishes cardiac function, exercise tolerance and quality of life. The objective of this study was to determine whether exercise training in atrial fibrillation affects muscle strength, body composition, maximal exercise capacity and walking capacity positively, thus improving quality of life.
DESIGN: Randomized clinical trial. Twelve weeks of physical exercise training or control.
Patients: Forty-nine patients in permanent atrial fibrillation were randomized to training or control.
METHODS: Intervention consisted of aerobic training for 1 h 3 times per week at 70% of maximal exercise capacity vs control. Muscle strength, exercise capacity, 6-minute walk test, lean body mass, fat percentage, and quality of life were assessed.
RESULTS: Muscle strength increased in the training group (p = 0.01), but no change was observed in controls. Lean body mass was unchanged in both groups. Fat percentage decreased in both groups, but there was no significant difference between the groups. Exercise capacity improved in the training group (p < 0.001), with no change in the control group. There was a significant difference after the training period between the training and control groups in terms of exercise capacity. (p = 0.001). Six-min walk test improved in the training group compared with controls (p < 0.01). Overall quality of life score, as measured by the Minnesota Living with Heart Failure Questionnaire, improved in the training group (p = 0.03). Quality of life, measured by Short Form-36, improved in the training group in 3 out of 8 subscales: physical functioning (p = 0.02), general health perceptions (p = 0.001) and vitality (p = 0.02).
CONCLUSION: Muscle strength, exercise capacity and quality of life increased with exercise training in subjects with atrial fibrillation. Lean body mass was unchanged.
Key words: atrial fibrillation; exercise training; muscle strength; heart rate; quality of life.
J Rehabil Med 2012; 00: 00–00
Correspondence address: Philip S. Osbak, Department of Cardiology 253, Copenhagen University Hospital Hvidovre, Kettegaard Allé 30, DK-2650 Hvidovre, Denmark. E-mail: philiposbak@yahoo.dk
Submitted June 27, 2011; accepted June 7, 2012
INTRODUCTION
Patients with atrial fibrillation (AF) often report symptoms, such as fatigue, decreased exercise tolerance, dyspnoea and palpitations. These symptoms lead to decreased quality of life (QoL) in 58% of cases (1). In the last decade, the focus of AF therapy has shifted from electrocardiographic outcomes to symptom control and patient well-being (2).
Physical activity is effective as adjuvant treatment in various types of cardiovascular disease, such as angina pectoris and congestive heart failure. The effect is mediated through a complex interplay between metabolic pathways and haemodynamic effects on heart, vasculature and muscles.
We hypothesized that patients with AF could benefit from exercise training; that such a programme could increase muscle strength, functional capacity and well-being; and that there is an association between increased muscle strength and functional capacity, and QoL. We conducted a randomized controlled trial of the effects of training on functional capacity, as evaluated by muscle strength, ergometer exercise capacity, 6-min walk test (6MWT), and body composition, in order to assess whether these factors could be affected positively while the patients remain in AF, despite the fact that AF itself adversely influences cardiac function. We studied the association between these factors and QoL.
MATERIALS AND METHODS
Patient population
Adults with permanent atrial fibrillation who agreed to participate in an exercise training programme were eligible for the study. The medical records for consecutive patients referred to our outpatient clinic were identified based on diagnostic codes for AF (I48.9). Exclusion criteria were: severe refractory hypertension; previous heart valve surgery; moderate to severe lung disease; low life expectancy; and lack of ability to exercise or to comply with the study protocol.
Written informed consent was obtained. The study was approved by the local ethics committee (committee approval # KF-13377 & 13675).
Study protocol
Patients were evaluated at baseline and after the training period. Exercise training was carried out in groups of 5 patients, supervised by a physiotherapist, for 1 h 3 times a week for 12 weeks. The programme included ergometer cycling, walking on stairs, running, fitness training on physio-balls and interval training. All sessions included warm-up and cool-down periods to avoid rapid changes in pulse and blood pressure. Total exercise duration was 60 min, of which a minimum of 30 min was at 70% of maximal work capacity as estimated by Borg Dyspnea Scale (Borg-scale score 14–16) (3). Training intensity was increased during the 12-week training period to increase work capacity. The Clinicaltrials.gov study identifier is: NCT01367197.
Functional physical testing
Functional physical testing consisted of measurement of femoral muscle strength, cycle ergometer test and standardized walking test. Heart rate was monitored by continuous electrocardiogram (ECG) monitoring during ergometer testing.
Muscle strength test. The dynamic peak power of the quadriceps femoral muscle was measured using a Power Track-II Commander dynamometer (JTech Medical, Salt Lake City, UT, USA) during maximum voluntary force. Two tests were performed for each leg. The means of the highest maximal forces for the left and right legs were calculated. Muscle strength was determined by a physiotherapist blinded to the allocation of the patients.
Ergometer test and 6MWT. Exercise tolerance tests were performed in accordance with American College of Cardiology/American Heart Association joint guidelines (4), starting at 25 W and increasing by 25 W every 2 minutes using an Ergoline cycle ergometer. The starting level was 25 W, and this was increased stepwise in 25-W increments every 2 min until the patient could no longer pedal at 60 revolutions per minute. A doctor and a research assistant blinded to the group allocation status of the patients were present. A self-paced standardized 6MWT (5) was performed before and after the training period, under the supervision of a physiotherapist blinded to the patients’ trial status.
Body composition. Dual energy X-ray absorptiometry (DEXA) scans performed with a Nordland Whole Body Bone Densitometer (Nordland Instruments, Fort Atkinson, WI, USA ) before and after the training period were used to evaluate lean body mass and fat percentage (6).
Quality of life assessment
Health-related QoL was assessed with the Short-Form 36 (SF-36) and the Minnesota Living with Heart Failure (MLHF-Q) questionnaires before and after the training period (7, 8).
Statistics
Paired and unpaired Student’s t-tests were performed after testing for normality using the Shapiro-Wilk test. If tests for normality failed, a Mann-Whitney rank sum test was used. The results are reported as means (standard deviations; SD). p < 0.05 was considered statistically significant. Multiple linear regression analyses were performed to model prediction of quality of life. All analyses were carried out using standard software SAS Statistical Software version 9.2 (Cary, NC, USA).
RESULTS
Patients
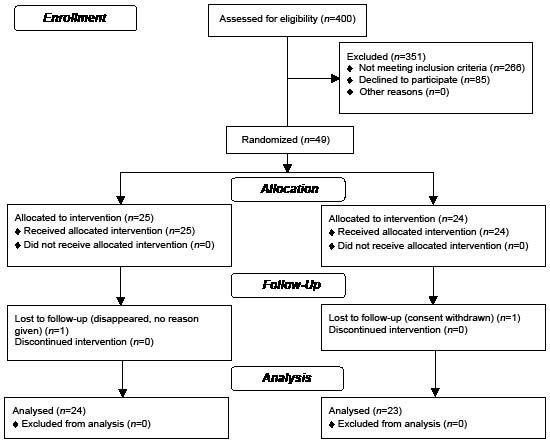
A total of 400 patient records were scrutinized for inclusion. Of these, 157 patients fulfilled the inclusion criteria, and had none of the exclusion criteria, and were invited to participate in the trial. A total of 85 declined to participate, and 72 were examined clinically. A further 23 patients were excluded, due to sinus rhythm (12 patients), atrial flutter (4 patients), heart failure with left ventricular ejection fraction less than 40% (4 patients) and aortic stenosis (3 patients). Twenty-five patients were randomized to the training group and 24 to the control group.
One patient from each group dropped out (see Consolidated Standards of Reporting Trials (CONSORT) statement) (Fig. 1). Patient characteristics are shown in Table I.
Randomization was performed in a 1:1 ratio using envelopes containing either the text ”control” or ”active”, generated by a random list in the SAS programme.
Compliance with the training programme was high. If the subjects were unable to attend a training session they were offered an extra training session at the end of their training period. All subjects in the training group completed 36 training sessions.
Fig. 1. Consolidated Standards of Reporting Trials (CONSORT) flow diagram.
| Table I. Baseline characteristics, medical history, exercise activity and medication of 47 patients with atrial fibrillation (AF) |
| | Training n = 24 | Controls n = 23 |
| Age, years, mean (SD) | 69.5 (7.3) | 70.9 (8.3) |
| Male sex, n (%) | 18 (0.75) | 17 (0.74) |
| Body height, cm, mean (SD) | 177 (10) | 175 (8) |
| Body weight, kg, mean (SD) | 92.9 (17.4) | 90.5 (12.9) |
| Body mass index, kg × m–2, mean (SD) | 29.6 (3.8) | 29.7 (4.8) |
| AF duration, years, mean (SD) | 5.3 (6.4) | 7.4 (9.6) |
| Admitted for AF, proportion, n (%) | 21 (0.87) | 20 (0.86) |
| Number of admissions for AF, mean (SD) | 2.0 (1.0) | 2.5 (1.8) |
| Hypertension, proportion, n (%) | 20 (0.82) | 15 (0.65) |
| Physically active weekly, proportion, n (%) | 16 (0.65) | 12 (0.52) |
| Physical activity, h/week, mean (SD) | 4.2 (2.1) | 5.5 (4.9) |
| β-blocker treatment, proportion, n (%) | 18 (0.67) | 13 (0.57) |
| Digoxin treatment, proportion, n (%) | 9 (0.38) | 9 (0.39) |
| ACE-I and ATIIA treatment, proportion, n (%) | 13 (0.54) | 10 (0.44) |
| Diuretic treatment, proportion, n (%) | 7 (0.29) | 4 (0.17) |
| Statin treatment, proportion, n (%) | 5 (0.21) | 4 (0.17) |
| Warfarin treatment, proportion, n (%) | 21 (0.87) | 18 (0.78) |
| There were no significant differences between the groups. Medication was unchanged from baseline to after the training period. SD: standard deviation; ACE-I: Angiotensin-Converting-Enzyme Inhibitor; ATIIA: Angiotensin II receptor Antagonist. |
Effects of training
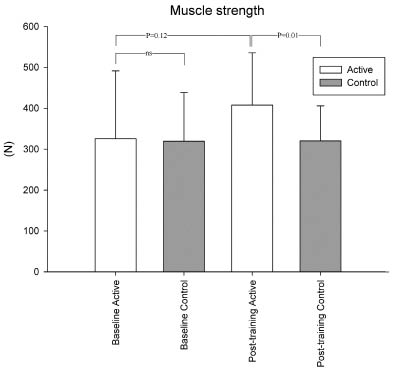
Muscle strength. Baseline muscle strength was similar in trained patients and controls (p = 0.7). In the training group there was a non-significant increase in muscle strength after the training period (p = 0.12). In the control group muscle strength was similar before and after the study period (p = 0.96). After the study period muscle strength was significantly higher in the training group than in the control group (p = 0.01) (Table II and Fig. 2).
Fig. 2. Muscle strength before and after the training period (mean (standard deviation)). At baseline there was no significant difference between the groups (p = 0.71, ns), after the training period a statistical difference was found between the training group and controls (p = 0.01).
Exercise capacity and 6-min walk test. Maximal EC was similar in the two groups at baseline. After the training period there was a significant difference between the groups. Both groups showed significant changes from baseline; the training group increased their maximal EC (p < 0.001), while the controls decreased maximal EC (p = 0.004) (Table II).
A 6MWT at baseline showed a trend towards the training group patients being able to walk for a longer distance(p = 0.064). In the training group walking distance increased significantly after the training period (p < 0.001). In the controls no change was observed (p = 0.88). After the study period there was a significant difference between the two groups (p = 0.001) (Table II).
| Table II. Functional exercise tests, body composition and heart rate |
| | Training Baseline Mean (SD) | Training Post- training Mean (SD) | Training Baseline vs post-training p-value | Controls Baseline Mean (SD) | Controls Post- training Mean (SD) | Controls Baseline vs post-training p-value | Training vs controls Baseline p-value | Training vs controls post-training p-value |
| Muscle strength, N | 340 (154) | 408 (128) | 0.12 | 320 (119) | 320 (86) | 0.96 | 0.71 | 0.01 |
| Six-minute walk test, m | 504 (85) | 570 (93) | 0.06 | 453 (100) | 454 (96) | 0.88 | 0.001 | < 0.01 |
| Ergometry maximal power, W | 160 (59) | 174 (56) | < 0.001 | 135 (38) | 127 (37) | 0.004 | 0.06 | 0.001 |
| Total lean body mass, kg | 59.9 (13.8) | 59.3 (13.6) | 0.67 | 55.6 (7.3) | 56.5 (7.3) | 0.68 | 0.20 | 0.39 |
| Fat percentage, % | 33 (7) | 32 (7) | 0.02 | 34 (10) | 33 (10) | 0.03 | 0.57 | 0.60 |
| Resting heart rate, min–1 | 95 (22) | 86 (23) | 0.049 | 92 (17) | 94 (12) | 0.41 | 0.57 | 0.21 |
| Maximal heart rate, min–1 | 152 (34) | 151 (29) | 0.83 | 144 (26) | 138 (31) | 0.13 | 0.33 | 0.15 |
| SD: standard deviation. |
Body composition. At baseline total lean body mass was similar in the two groups (p = 0.20). Lean mass was unchanged in both the training group and controls from baseline to after the training period (training group p = 0.67, controls p = 0.68). Lean body mass was similar in the training group and controls after the training period (p = 0.39). Fat percentage decreased slightly, but significantly, for unknown reasons in both groups. No difference was found between groups (Table II).
Heart rate and blood pressure. Resting heart rate decreased significantly in the training group (p = 0.049), but not in controls. There were no changes in maximal heart rate (Table II).
There were no significant differences in blood pressure before and after the exercise-training period (systolic blood pressure: training group 131 (SD 15) vs 132 (SD 13) mmHg; controls 129 (SD 10) vs 128 (SD 11) mmHg. Diastolic blood pressure training group 83 (SD 10) vs 81 (SD 9) mmHg, ns; controls 78 (SD 10) vs 78 (SD 9) mmHg).
Quality of life
QoL was measured by the MLHF-Q and SF-36 questionnaires: total MLHF-Q score and the two subscales regarding physical and emotional wellbeing were significantly different from baseline to after the training period (21 (SD 18) vs 15 ( SD 17), p = 0.022; 8 (SD 7) vs 6 (SD 7), p = 0.039 and 5 (SD 4) vs 4 (SD 4), p = 0.045, respectively) in training group patients, but not in controls.
QoL measured by SF-36 was not significantly different between the groups at baseline. The training group patients showed significant progress in QoL from baseline to after the training period in 3 of the 8 scales: physical functioning (72 (18) vs 77 (16), p = 0.021), general health perceptions (57 (19) vs 69 (19), p = 0.001) and vitality (60 (23) vs 69 (21), p = 0.023). There were no significant differences in QoL between the groups after the training period.
Regarding the association between functional test and QoL, multiple linear regression was performed to investigate the joint effect of the explanatory variables: group (training or control), muscle strength (N), ambulated distance in 6MWT (m), EC (W) on QoL, as measured by either SF-36 or MLHF-Q (Table III).
For SF-36, patient group (p = 0.04) appears to account for the ability to predict SF-36. In this model there was a trend towards 6MWT being a significant explanatory variable (p = 0.08). Exercise capacity and muscle strength were not significant explanatory variables.
| Table III. Multiple linear regression of quality of life (QoL) |
| Multiple linear regression | Partial regression coefficients (standard error) | p-value |
| SF-36 QoL | | |
| Constant | 68.7 (13.7) | < 0.001 |
| Group, training–control | 7.9 (3.6) | 0.04 |
| Exercise capacity, W | 0.03 (0.02) | 0.08 |
| 6MWT, m | 0.01 (0.03) | 0.75 |
| Muscle strength, N | 0.02 (0.01) | 0.30 |
| MLHF-Q QoL | | |
| Constant | 31.6 (27.2) | 0.25 |
| Group, training–control | 3.3 (7.2) | 0.65 |
| Exercise capacity, W | –0.05 (0.03) | 0.10 |
| 6MWT, m | 0.1 (0.06) | 0.07 |
| Muscle strength, N | –0.02 (0.03) | 0.55 |
| Multiple linear regression formulas: SF-36 = 68.678 + (7.920 × Group) + (0.0296 × 6MWT) + (0.00968 × Exercise capacity) +(0.0153 × Muscle strength). MLHF-Q = 31.605 + (3.285 × Group) – (0.0543 × 6MWT) + (0.112 × Exercise capacity) –(0.0174 × Muscle strength). 6MWT: 6-min walk test; MLHF-Q: Minnesota Living with Heart Failure Questionnaire; SF-36: Short-Form 36 Questionnaire. |
For MLHF-Q, there was a trend towards EC being able to account for the ability to predict MLHF-Q (p = 0.07). There was a trend towards 6MWT being able to predict MLHF-Q (p = 0.10). In this model, patient group and muscle strength were not significant explanatory variables. In both multiple linear regression models not all of the independent variables appeared to be necessary (or it may be that the multiple linear models were underspecified).
Adverse effects and safety of exercise training
No safety issues or adverse effects of exercise training were encountered.
DISCUSSION
Patients with AF are challenged with decreased exercise tolerance, dyspnoea and palpitations, leading to decreased QoL. Despite this, the present study demonstrates that significant improvements in EC and QoL can be achieved through a short-term exercise training programme. Other studies support these findings: in a randomized study of training in patients with AF by Hegbom et al. (9), cumulated EC improved by 41%. QoL improved significantly in the training group after training (p < 0.05) in 4 of the 8 SF-36 subscales. There were no changes in the control group (9).
In patients with heart disease the skeletal muscles tend to lose mass and strength through inactivity and local haemodynamic alterations. Thus, in heart transplant recipients, muscle mass and strength are often severely depressed (10). However, muscle mass and strength can be markedly improved by physical training (11). In our patient population, muscle strength was not as depressed as in transplant patients. However, we could demonstrate a clinically relevant and significant increase in strength. In contrast, we could not show increased muscle mass after training by DEXA scan. It is probable that metabolic or even neurogenic improvement may explain this finding. Increased muscle strength can be important for these patients, increasing mobility and balance.
As regards functional capacity, training group patients in the present study increased by a mean of 13% in 6MWT and a mean of 9% in EC, demonstrating that functional capacity can also be improved significantly in patients with AF, within a reasonably short time-span.
Physical exercise training results in increased parasympathetic tone and consequent decreased ventricular rate. A study of patients with permanent AF by Plisiene et al. (12) showed that moderate physical exercise for 45 min twice a week decreased heart rate significantly after 4 months (67 bpm (SD 12) after training vs 76 bpm (SD 20) before training, p = 0.05), which is very similar to our results.
Physical exercise training positively affects numerous biological systems in skeletal muscles, the heart and circulation. The effects vary, from regulation of gene expression at the molecular level in the endothelium, to altered activity in the autonomous nervous system by cerebral cortical control.
The muscles’ efficacy to utilize oxygen improves through an increase in the number of mitochondria. Myoglobin and lipid metabolizing enzymes also increase. The maximal oxygen uptake increases with the level of physical exercise training until a plateau is reached. With long-term training, capillary density in the skeletal muscles increases. The number of arterioles increases causing lower vascular resistance in the muscles. This may also contribute to the observed increased EC and muscle strength without change in muscle mass.
In our study there was an insignificant trend towards the functional walking capacity as estimated by 6MWT being an explanatory variable for predicting QoL estimated by SF-36. In the multiple linear regression model for prediction of QoL as estimated by MLHF-Q there was a non-significant trend towards EC and 6MWT being explanatory variables. The regression models contained EC, 6MWT and muscle strength. These factors may be mutually correlated, since they all reflect aspects of the patients’ physical capacity.
Although this is the largest trial of exercise training in AF reported thus far, we did not find the expected association between muscle strength and QoL. This may be a type 2 error.
In principle, this is an open trial. However, muscle strength assessments and walk tests were carried out in a blinded manner.
In conclusion, 12 weeks of exercise training in patients with permanent AF, resulted in increased muscle strength but not mass, increased EC, and significantly decreased resting heart rate. Lean body mass was unchanged. Overall QoL increased significantly.
A non-significant trend towards 6MWT and EC being able to predict QoL was found. There was no significant association between muscle strength and QoL. However, increased muscle strength is considered relevant for increased mobility and posture.
Exercise programmes can be offered to patients with AF in order to increase their muscle strength, EC and QoL. Exercise training programmes should be integrated into cardiac rehabilitation in patients with AF.
ACKNOWLEDGEMENTS
The authors would like to thank Bo Rasmussen, MD, Ulrik Dixen, MD, PhD, and Klaus F. Kofoed, who performed echocardiographic imaging. The authors also thank physiotherapists Bente Holm and Carina Jensen for performing blinded 6MWTs, and biostatistician Steen Ladelund for evaluating the statistics.
REFERENCES