Kate Sansam, MRCP1, Rory J. O’Connor, MD FRCP1,2, Vera Neumann, MD FRCP1,2 and Bipin Bhakta, MD FRCP1,2
From the 1Academic Department of Rehabilitation Medicine, University of Leeds and 2Leeds Teaching Hospitals NHS Trust, Leeds, UK
OBJECTIVE: To investigate whether simple clinical measures can predict walking ability after lower limb prosthetic rehabilitation.
DESIGN: Prospective observational study.
SUBJECTS: Ninety five adults who were assessed as suitable for lower limb prosthetic rehabilitation by the multidisciplinary team.
METHODS: Information regarding baseline clinical factors (amputation details, comorbidities, physical ability, mood and cognitive ability) was collected prior to provision of the prosthesis. Backward step linear regression was used to identify factors predictive of performance on the Timed Up and Go test following rehabilitation.
RESULTS: Seventy one participants were able to complete this walking test and were included in the final analysis. The backward step regression model had an adjusted R2 of 0.588 and comprised 6 factors: age (p = 0.002), gender (p = 0.027), level of amputation (p = 0.000), presence of contracture (p = 0.088), ability to stand on one leg (p = 0.062) and Trail Making Tests A + B (p = 0.047), a test of cognitive flexibility. Cause of amputation (dysvascular or non-dysvascular) was not an independent predictor of walking outcome. CONCLUSION: These results indicate that simple clinical assessments completed prior to prosthetic provision can be used to predict mobility outcome. These findings need to be validated in a larger population across other amputee rehabilitation services and if confirmed could easily be incorporated into routine clinical practice.
Key words: amputation; walking; prognosis.
J Rehabil Med
Guarantor’s address: Dr Kate Sansam, Academic Department of Rehabilitation Medicine, Faculty of Medicine and Health, University of Leeds, Level D, Martin Wing, Leeds General Infirmary, Great George Street, Leeds LS1 3EX, UK. E-mail: katesansam@hotmail.com
Submitted September 26, 2011; accepted June 19, 2012
Introduction
Lower limb amputation is a relatively common cause of physical disability with an incidence between 1.2 to 4.4 per 10,000 population worldwide (1). Of the 7,000 leg amputations occurring in the UK each year 65% will be referred to an amputee rehabilitation centre for consideration for a prosthesis (2). These patients will be seen by a multidisciplinary team to assess their suitability for provision of a prosthesis and to estimate mobility outcome to guide choice of components. It is however difficult to predict walking ability following prosthetic rehabilitation accurately as there are multiple factors that potentially affect outcome (3). Incorrect estimation of walking potential may lead to provision of prostheses to patients who will not be able to utilise them at significant cost to the patient and health service. Factors found in previous studies to be positive predictors of mobility with a prosthesis include pre-operative mobility (4), physical fitness (5), ability to stand on one leg (6), the absence of stump problems (7) and pain (8). The effects of the aetiology of amputation (eg vascular disease or trauma) and co-morbidities are not clear with differing conclusions reached in the literature. There is general, although not unanimous, agreement that more distal and unilateral amputation levels and younger age result in superior mobility with a prosthesis (3).
Although several guidelines recommend that cognitive function is taken into account in the rehabilitation of lower limb amputees (9, 10), there is limited information regarding the predictive nature of cognitive measures in amputee rehabilitation. Five observational studies have used validated measures of cognition to investigate its relationship with mobility after lower limb amputation. The degree of mobility achieved after rehabilitation was found to be associated with pre-rehabilitation test scores from the Clifton Assessment Procedures for the Elderly (11), the Kendrick Object Learning Test (12) and the cognition subscore from the Functional Independence Measure (FIM) (13).
A combination of tests (the Cognitive Screening Test, 15 word test and the Stroop Color-Word Test) were found to be predictive of ability to perform activities of daily living, but not the Timed Up and Go test (TUG) or walking ability with a prosthesis (6). Another study also used a variety of cognitive measures including the Repeatable Battery for the Assessment of Neuropsychological Status, Behavioural Assessment of the Dysexecutive Syndrome, Addenbrookes Cognitive Examination and test of verbal fluency (14). They concluded that figure recall explained almost a quarter (24.8%) of variance in the Locomotor Capabilities Index and that 58% of variance in the Special Interest Group in Amputee Medicine (SIGAM) mobility grade was explained by immediate story recall, age, amputation level and pain. The last two studies were both underpowered. The first was only able to recruit 46 of the 100 intended participants and a post-hoc power calculation for the second indicated a power of only 0.58 with 34 participants. In fact, all 4 prospective studies were small, with between 32 and 46 participants. A larger retrospective study looked at data from 1,400 subjects after amputation and found that cognitive subscores of the FIM on admission were predictive of motor subscores on discharge (13). However, the FIM has been shown to be unsuitable in the amputee population because of ceiling effects and lack of responsiveness (15).
Not all amputee rehabilitation centres have easy access to psychological services, meaning that simple tests of cognition that can be performed by other clinicians are more likely to be routinely implemented. We therefore sought to establish whether routine clinical measures including simple tests of cognition are independent predictors of the ability to walk short distances after lower limb prosthetic rehabilitation.
Methods
Study design
This is a prospective observational study approved by the Leeds (Central) NHS Research Ethics Committee. Patients provided with a functional prosthesis from the Leeds Amputee Rehabilitation Service following a lower limb amputation were invited to participate.
Inclusion criteria were as follows: (i) age 18 years or over, (ii) new transtibial or transfemoral lower limb amputation(s) and (iii) living within the catchment area of Leeds Amputee Rehabilitation Service.
Those who previously had learnt to walk using a unilateral prosthesis and then underwent a second amputation of the contralateral leg were also included.
Exclusion criteria were as follows: (i) insufficient communication or cognitive skills to give informed written consent, (ii) severe visual, communication or upper limb impairment precluding the use of the written cognitive tests or (iii) patients assessed as unsuitable for a functional prosthesis by the treating rehabilitation team.
After written consent was obtained, data regarding potential predictors of walking ability were collected from clinical notes and directly from participants at the time of manufacture of the prosthesis. Participation in the study did not affect prosthetic component choice or provision of rehabilitation interventions including physiotherapy; these decisions were made by clinicians independent of the study following usual clinical practice.
Predictor variables
Data were collected on the following factors that have been hypothesised to predict walking ability following lower limb amputation:
• Age.
• Gender.
• Level of amputation.
• Primary cause of amputation.
• Amputation wound status (healed vs unhealed).
• Co-morbidities (diabetes, heart disease, chronic respiratory disease, arthritis and acquired brain injury).
• Presence of stump and phantom pain. Participants were asked to record whether or not they experienced phantom limb or stump pain and if so whether it has interfered with sleep or daytime activities within the preceding week.
• Depression. The self report 15 item Geriatric Depression Scale was chosen as a succinct mood scale. Although this was initially developed for use with older people, it has since been validated in younger adults (16–18). The result was dichotomised for analysis to those unlikely to have depression (score 0–4) and those likely to have depression (score 5–15), as previous research has shown 4/5 to be the optimal cutting score (19).
• Presence of fixed flexion hip and/or knee joint deformities (restricted vs unrestricted). Hip and knee flexion and extension was measured using a goniometer. Normal hip extension was defined as 0° to –30° and normal knee extension as 0° to –10°. Participants with joint ranges less than these were considered to have joint contractures.
• Single-leg balance (ability to stand on one leg without support vs unable). This was measured in participants with a unilateral amputation wearing their own shoe on their intact limb. A walking frame was placed in front of the participant with a chair behind to minimise the risk of falling. Participants were only considered able to stand on one leg if they could maintain their balance without using the walking frame or chair for support and without hopping for at least 10 s.
• Cognition. The following two tests were chosen as they are relatively quick to complete, require minimal training and equipment and so could be easily included in routine clinical assessment if they prove useful in predicting outcome.
• The Addenbrookes Cognitive Examination revised version (ACER) (20). This builds on the established Mini Mental State Examination and consists of tasks assessing ability in 5 domains: attention and orientation, memory, verbal fluency, language and visuospatial skills. It takes approximately 15 min to administer and yields a total score out of 100 with separate scores for each of 5 cognitive domains. For analysis, the cutting score of 82 for the total ACER score was used based on previous research indicating that scores below this level were indicative of significant cognitive impairment (21).
• The Trail Making Test (22). This is divided into two parts, A and B. Part A consists of 25 encircled numbers which the subject connects in order 1–25 using a pencil. Part B consists of encircled numbers and letters which the subject connects in numerical and alphabetical order, alternating numbers and letters: 1-A-2-B etc. Part A is generally thought to test visual search and motor speed skills. Part B is more challenging and is thought to test higher cognitive skills such as mental flexibility. Each part was administered after completing the practice test version, with instruction if required. Errors were highlighted during the test allowing self-correction and the time taken to complete each part was recorded. A cut off time of 300 seconds was used to discontinue the test and was therefore the maximum time taken. This test takes approximately 15 min to complete.
Functional outcome parameters
Participants were monitored for approximately 6 months after provision of their prosthesis at which point they had completed their initial prosthetic rehabilitation and the following outcome measures were recorded:
• SIGAM mobility grade. This is measured using a validated self-report questionnaire (23) consisting of 21 questions with yes/no answers about an individual’s ability to walk with a prosthesis. A scoring algorithm is used by the clinician to assign the appropriate grade ranging from A (limb wearing abandoned or use of cosmetic limb only) to F (normal or near normal gait).
• TUG. This is an observer-scored measure of functional mobility in which the subject starts seated in a chair with their back against the chair, arms resting on the chair arms and their customary walking aid at hand. On the word “go” they stand, walk 3 m (marked on the floor using a red cone) using their customary walking aid if required, turn, walk back to the chair and sit down again. This test has been shown to be reliable and valid in lower limb amputees (24). The time taken to complete this activity was recorded using a stopwatch. Participants who were unable to walk or only safe when walking with physical assistance were not asked to complete the TUG.
Information on further amputation or stump revision surgery during the follow-up period was obtained from participants’ medical records. Incomplete follow-up and date of death, if this occurred during the follow-up period, were also recorded.
Outcome
The primary outcome was mobility with a prosthesis at 6 months, as measured by the TUG.
Statistical analysis
Descriptive statistics were used to evaluate participants’ baseline characteristics (Table I). Standard and backward step multiple linear regression analyses, with elimination of variables if p < 0.10 were used to evaluate the predictive value of baseline independent variables on TUG result at follow up (dependent variable). Given the relatively small sample size it was felt that elimination at this level of significance was appropriate. All statistics were performed using SPSS version 17.0 and a p-value of < 0.05 was considered significant. Initial analyses indicated bivariate correlation of trail making tests A and B. These were therefore combined into a total trail making score.
Spearman’s Rank Order Correlation was used to investigate whether there was a significant relationship between the time to follow up and the TUG result and the Kruskal-Wallis test was used to compare the SIGAM mobility grades and TUG at follow-up.
Sample size estimation
Using SPSS Sample power 2 software with the premise of an explained variance of 30%, 22 predictor variables (including dummy variables), power of 0.80 and α of 0.05 the minimum number of participants required to complete follow-up measures was calculated as 70.
Results
Ninety-five lower limb amputees were recruited to this study between August 2008 and November 2009, with 71 able to complete the TUG at follow-up and entered into the regression analysis (Fig. 1). Table I shows the results of the predictor variables at the time of prosthetic fitting, with several individuals having more than one comorbid condition.
|
Table I. Baseline predictor variable distribution |
||
|
Predictor variable |
Not able to TUG (n = 18) |
Able to do TUG (n = 71) |
|
Age, years, Mean (SD) Median (range) |
69 (11) 70 (51–85) |
64 (15) 68 (20–93) |
|
Sex, male, n (%) |
10 (56) |
56 (79) |
|
Disturbing phantom or stump pain, present, n (%) |
8 (44) |
15 (21) |
|
Amputation Level, n (%) Unilateral transtibial Unilateral transfemoral Bilateral transtibial |
6 (33) 11 (61) 1 (6) |
49 (69) 18 (25) 4 (6) |
|
Cause of amputation, n (%) Dysvascularity Infection Trauma Neoplasm Other |
12 (67) 3 (17) 1 (6) 1 (6) 1 (6) |
44 (62) 13 (18) 7 (10) 2 (3) 5 (7) |
|
Wound status, healed, n (%) |
15 (83) |
52 (73) |
|
Presence of comorbidities, n (%) Diabetes Heart disease Chronic respiratory disease Arthritis Acquired brain injury |
5 (28) 10 (56) 4 (22) 8 (44) 4 (22) |
26 (37) 27 (38) 10 (14) 32 (45) 5 (7) |
|
Able to stand on one leg, n (%) |
7 (39) |
29 (41) |
|
Depression indicated on screening, yes, n (%) |
7 (39) |
17 (24) |
|
Knee or hip contracture, present, n (%) |
5 (28) |
13 (18) |
|
ACER, impaired, n (%) |
7 (39) |
14 (20) |
|
Trail making test, mean (SD) Test A Test B |
54.39 (25.61) 165.67 (78.10) |
45.96 (22.92) 107.41 (60.55) |
|
ACER: Addenbrookes Cognitive Examination (revised version); TUG: Timed Up and Go test; SD: standard deviation. |
||
It was intended for all participants to be followed up 6 months after prosthetic provision as it was anticipated that this would allow the majority of patients to complete their initial prosthetic rehabilitation within physiotherapy sessions. However, due to variability in progress within rehabilitation and a combination of factors including participant choice in appointment timing and illness this was not always possible. Fig. 2 shows the different time points of final follow up and the TUG results at each. There was no significant association between the time to follow up and the TUG result (p = 0.490).
There was a highly significant association (p < 0.001) between the SIGAM mobility grades and the TUG at follow-up, which is not surprising as they are both measures of mobility. The range of SIGAM mobility grades achieved at follow up for all participants is shown in Fig. 3.
Fig. 2. Time from prosthetic fitting and Timed Up and Go test (TUG) results.
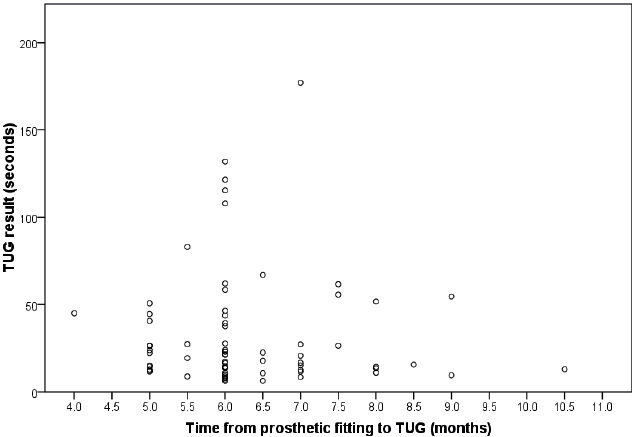
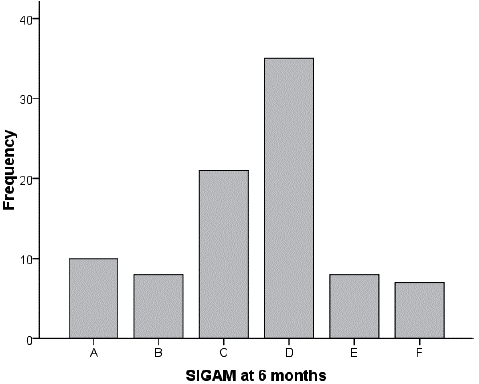
Fig. 3. Special Interest Group in Amputee Medicine (SIGAM) outcome at follow-up.
Evaluation of assumptions of multivariate analysis led to the logarithmic transformation of the TUG variable to improve linearity and homoscedasticity of residuals. One independent variable, the degree of contracture, was grossly skewed with and without transformation and it was therefore decided to dichotomise this variable into those with and without contracture. Due to the small numbers of participants in some of the categories two variables needed to be dichotomised. The cause of amputation was divided into dysvascularity and other causes and the level of amputation was dichotomised into transfemoral and transtibial levels (both unilateral and bilateral). All bilateral amputees had been established prosthetic users when they were unilateral amputees and had undergone a second amputation of the contralateral leg at a later date following completion of their initial prosthetic rehabilitation. Therefore both bilateral and unilateral transtibial groups were learning to use a new below knee prosthesis and in contrast with the transfemoral group did not have to learn to control a prosthetic knee, which is particularly important for a sit to stand action which is included in the TUG. Using p < 0.001 criterion for Mahalanobis distance, no outliers among the cases were identified. Collinearity diagnostics showed no problems with multicollinearity and no cases had missing data.
In the bivariate analysis 10 out of the remaining 16 predictor variables were significantly associated with the TUG (Table II). Following the backward step regression analysis 6 factors remained in the final model which explained 59% of the variance in mobility outcome (Table III). As the independent variable, TUG, was logarithmically transformed for the analysis the unstandardised coefficients have been exponentiated (Table III). This gives a ratio of the expected geometric means in the original units to allow easier interpretation of the results. For example for one unit increase in age (i.e. one year) there is a 0.8% increase in time to complete the TUG and for each additional second taken to complete the total trail making test there is a 0.1% increase in time to complete the TUG. For the dichotomous variables the results show that to complete the TUG women took 15.9% longer than men, transfemoral amputees took 35.1% longer than transtibial amputees, those with contracture took 13.1% longer than those without and those unable to stand on one leg took 12% longer than those who could. The final model includes two variables, presence of contracture and ability to stand on one leg, that are non-significant. This is due to the decision to eliminate variables if p < 0.10 in the backward step regression analysis based on the small sample size.
|
Table II. Person correlation coefficients between baseline variables and Timed Up and Go test (TUG) (logarithmically transformed) |
|
|
|
LogTUG |
|
Phantom or stump pain |
–0.038 |
|
Depression cut off 4/5 |
–0.257* |
|
Age, years |
0.623** |
|
Gender |
0.204* |
|
Level |
0.543** |
|
Cause |
0.164 |
|
Wound status |
–0.217* |
|
Diabetes |
0.052 |
|
Heart disease |
0.172 |
|
Chronic respiratory disease |
–0.113 |
|
Arthritis |
0.224* |
|
Acquired brain injury |
0.174 |
|
Contracture present |
0.209* |
|
1 leg stand |
0.357* |
|
ACER cut off at 82/83 |
0.480** |
|
Total trail making test |
0.488** |
|
*p < 0.05, **p < 0.01. ACER: Addenbrookes Cognitive Examination (revised version). |
|
|
Table III. Results of backward stepwise multiple linear regression analysis with Timed Up and Go test as dependent variable |
|||
|
Predictors |
Exponentiated unstandardised coefficient (95% confidence interval) |
p |
Explained variance (adjusted R2) |
|
(Constant) |
1.693 (1.320–2.172) |
< 0.001 |
59% |
|
Age in years |
1.008 (1.003–1.013) |
0.002 |
|
|
Gender |
1.159 (1.017–1.320) |
0.027 |
|
|
Level |
1.351 (1.186–1.538) |
< 0.001 |
|
|
Contracture |
1.131 (0.981–1.304) |
0.088 |
|
|
1 leg stand |
1.120 (0.994–1.261) |
0.062 |
|
|
Total trail making test |
1.001 (1.000–1.002) |
0.047 |
|
}
Discussion
Our results indicate that age, sex, level of amputation, presence of contracture, ability to stand on one leg and cognitive ability explain 59% of the variance in mobility outcome. Although there have been varied views expressed in the literature with regards to the effect of age on mobility outcome, potential confounders were not considered in all papers. Our findings are consistent with others using multiple regression analyses to control for the effects of other factors in that there appears to be a stronger dependence of walking ability on age than on co-morbidity (4, 6, 8, 25–27).
Previous research has found contrasting results as to the effect of sex on mobility outcome (3), which may be related to the variety of measures used in the literature. Our findings that men completed the TUG more quickly than women may be related to men being taller and having a longer leg length on average which increases stride length and hence walking speed, a significant contributor to the TUG result. Data regarding the height or leg length of participants were not collected in this study, but should be considered in future research.
In common with other studies we found amputation level a significant predictor of mobility with transfemoral amputees taking longest to complete the TUG. Whilst the increased energy requirements to walk with an above knee prosthesis compared to below knee limbs (28) may have influenced this result, the bilateral transtibial amputees completed the TUG a median of only 3 s slower than the unilateral transtibial group and more than twice as fast as the transfemoral group. Although walking with bilateral prostheses may require greater energy expenditure the mobility measure we used does not require prolonged walking which may lessen this influence of energy cost on the result. It does however include a sit to stand manoeuvre and vice versa which transfemoral amputees may find particularly difficult. The requirement for a transfemoral amputation may also indicate a more advanced disease process and as the majority of participants had dysvascularity it is possible that the transfemoral group had symptomatic claudication in the contralateral leg which may have contributed to the results. It should be noted that the bilateral amputees in this study were all established unilateral limb users prior to their second amputation which may have enhanced their adaption to walking with the new prosthesis.
There are little data on the impact of contractures on walking speed and energy expenditure in patients with a lower limb amputation, but their presence is known to be associated with slower and less efficient gait patterns in people with neurological conditions (29) and when simulated in normal adults (30). It is therefore not surprising that contracture was an independent predictor in the final model.
The ability to stand on one leg may be seen as a proxy measure for lower limb strength and balance and successful ability to perform this has consistently been shown to predict better walking potential after lower limb amputation (3).
Both measures of cognition, the ACER and trail making tests, were significantly associated with outcome in the bivariate analysis, but only the trail making tests remained in the final model. The ACER is designed as a screening test for dementia and as it is an ordinal scale, was dichotomised. This may have weakened its effect in the predictive model. Compared to the ACER the trail making tests may be a better measure of the types of mental functions required to learn to walk with a prosthesis such as mental flexibility and concentration and hence have a stronger independent influence on outcome.
Interestingly, although other studies have reported a poorer mobility outcome in dysvascular amputees (3) we found no significant association between amputation cause and the TUG in either the bivariate or multivariate analyses. This may be due to the exclusion of patients thought to have poor rehabilitation potential by the treating multidisciplinary team which may have screened out a greater proportion of dysvascular amputees.
In the UK there are a similar proportion of patients attending amputee rehabilitation centres who have undergone lower limb amputation due to trauma and infection (2). In the study population there were a greater number in whom the primary cause of amputation was infection that those due to trauma. This may be related to natural variation given the small numbers involved, or may be related to the high prevalence of diabetes in the population, predisposing individuals to the development of osteomyelitis.
The TUG was chosen as the primary outcome measure as it is a commonly used observer-rated measure of walking of established validity in this population and is relatively quick to complete. It was chosen in preference to a timed walk test as it is regarded as a closer representation of daily function as it includes a sit to stand manoeuvre. The latter is required for individuals to be able to mobilise independently and is an action many amputees, particularly transfemoral amputees, find challenging which limits their potential to use their prosthesis to walk. Although it only measures short distance indoor walking this is sufficient for many amputees to achieve independence in activities such as being able to walk to their toilet. Other observer-rated measures which demand walking over longer distances were considered, but as a large proportion of amputees are elderly with vascular disease, it was likely that a larger proportion would have been unable to complete these tests. This would have restricted the study population and hence the applicability of our findings only to amputees with higher levels of mobility.
Self-report scales, such as the SIGAM, were considered as a primary outcome measure; we recognise such measures are regarded as having greater ecological validity than a standardised tests carried out in a clinical setting such as the TUG. However, the SIGAM (and other tests based on ordinal scales), would have required a significantly larger sample size in order to produce statistically meaningful results. This was not feasible during the time available for this study. Further investigation of prognostic indicators using the SIGAM would be a useful next step in this field of research. However, we believe that it is reasonable to commence investigation of prognostic indicators using an observer rated measure, which allows a smaller sample size. We would argue that this is a necessary step before setting up larger studies using ordinal self-report scales.
When measuring the TUG, participants were able to push up on the arms of the chair and walk using their usual walking aid as is the standard practice when using this measure. The type of walking aid used may have an influence on an individual’s independence as walking aids such as frames restrict one’s ability to carry objects between rooms. Due to the small sample size it was not possible to include the type of walking aid used in the analysis, but it would be useful to examine this in future research.
As not all participants were able to safely walk at follow up it was not possible to obtain TUG results in all and 18 participants were excluded from the analysis as they were unable to complete this measure. This may bias the results. Alternative statistical analysis was considered, but due to the small number of participants and unequal numbers of participants able or unable to complete the TUG it was not possible to use methods such as logistic regression analysis. This could however be included in the future in a larger population.
Another limitation of the study is the use of different times for follow up assessment. Although post-hoc analysis did not show any correlation between time to assessment and performance on the TUG it is not possible to be certain that this did not influence the results and should be considered further in future research in a larger population to allow adjustment within the analysis to control for this or with greater resources to enable participants to be seen at the same time points.
Due to the relatively small sample size it was necessary to merge some categories for the analysis. As all bilateral amputees in our population had consecutive transtibial amputations they were grouped with the unilateral transtibial amputees. We reasoned that the challenges this group faced relearning to walk more closely matched those experienced by other transtibial amputees than those encountered by the transfemoral group. Due to the nature of the cognitive and mood assessments used individuals with impaired vision and hand function were excluded. We cannot, therefore, draw any conclusions about these subgroups. This was a pragmatic study with patients selected by the multidisciplinary team as being suitable for provision of a functional prosthesis. This was done based on the assessment of experienced clinicians independent from the research team. No formal criteria was used, as is usual practice in UK prosthetic rehabilitation centres. This is a possible source of bias within the study. It was not possible to ascertain baseline factors in those patients not provided with a prosthesis as this screening process often starts soon after surgery in the various hospitals that this regional rehabilitation centre serves. It may not therefore be possible to apply the results to patients attending rehabilitation services in other countries, or, indeed, to other rehabilitation services in the UK due to differences in screening practice.
Prosthetic components and socket type was decided by the treating clinicians according to individual patient requirements. It is possible that the prosthetic prescription may have influenced performance on the TUG. However, given the large number of potential combinations of components it was not feasible to include this in the regression analysis.
We suggest these findings be explored further in a larger population across several rehabilitation services. If confirmed, these clinical assessments could easily be incorporated into routine clinical practice to guide clinicians and inform patients of their potential mobility outcome with prosthetic rehabilitation and hence guide choices and decisions regarding treatment.
Acknowledgements
We would like to express our gratitude to all the patients and staff at the Leeds Prosthetics Service who have contributed to the study. Particular thanks go to Christine Middleton and Deborah Westwood. In addition, we would like to thank Liz Hensor for her advice regarding the statistical analysis.
references

