Torunn Askim, PhD1,2, Julie Bernhardt, PhD3,4, Leonid Churilov, PhD3,5, Kristine Rabben Fredriksen, PT6 and Bent Indredavik, MD, PhD1,6
From the 1Department of Neuroscience, Faculty of Medicine, 2Department of Public Health and General Practice, Faculty of Medicine, Norwegian University of Science and Technology, Trondheim, Norway, 3Stroke Division, Florey Neuroscience Institutes, Heidelberg, Victoria, 4Faculty of Health Sciences, La Trobe University, 5Department of Mathematics & Statistics and Department of Medicine, The University of Melbourne, Melbourne, Australia and 6Stroke Unit, Department of Medicine, St Olavs Hospital, Trondheim, Norway
OBJECTIVE: To investigate how physical activity changes over the first 6 months after stroke, and how activity is related to function.
DESIGN: A longitudinal study with an initial assessment within 14 days after stroke (in hospital) and follow-up assessments 1, 3 and 6 months later (in-patient rehabilitation or at home).
SUBJECTS: Patients with acute stroke.
METHODS: An accelerometer with a switch tilt was used to measure activity over a period of 24 h on each occasion. The Barthel Index (BI) and Berg Balance Scale (BBS) were applied as functional measures.
RESULTS: A total of 28 out of 44 recruited patients were included in the analysis (15 men (53.6%), mean age 79 years). The median time in the upright position increased from 92 min at baseline to 144 min 6 months later. A generalized least-square regression models showed that time in the upright position increased by 2.0 min for every day from baseline to 1 month later (p = 0.003). A single point increase on the BBS was associated with an extra 4.3 min in the upright position (p < 0.001), while a single point increase on the BI was associated with an extra 2.1 min in the upright position (p < 0.001).
CONCLUSION: Activity levels are very low during the first 6 months after stroke. However, time in the upright position was found to increase as function improved.
Key words: motor activity; stroke; technology assessment.
J Rehabil Med 2013; 45: 423–428
Correspondence address: Torunn Askim, Department of Neuroscience, NTNU, Faculty of Medicine, 7491 Trondheim, Norway. E-mail: torunn.askim@ntnu.no
Accepted Dec 14, 2012, Epub ahead of print Apr 10, 2013
Introduction
Physical activity is beneficial for most aspects of health (1). It has been shown to reduce the risk of first-ever stroke (2–4), can positively modify almost all known risk factors for stroke, such as high blood pressure, diabetes and high cholesterol level (5), and may help reduce the risk of recurrent stroke (6). However, the evidence in support of promoting physical activity for people with stroke is indirect, and activity recommendations are largely based on expert opinion (6).
Physical activity is defined as any bodily movement produced by skeletal muscles that requires energy expenditure (7). According to US guidelines, it is recommended that patients with stroke who are capable of engaging in physical activity should do at least 30 min of moderate-intensity physical exercise, typically defined as vigorous activity sufficient to break a sweat or noticeable heart rate, 1–3 times a week (6). However, in Norway it is recommended that stroke patients in the chronic phase exercise at 60–80% of maximum heart rate for 10–60 min, 2–5 times a week (8). It appears that physical activity in community-dwelling stroke survivors is below these recommended levels (9).
There is increasing interest in understanding the facilitators and barriers to physical activity both early and late after stroke (10). A major challenge in this field is finding a suitable way to measure physical activity. Physical activity has traditionally been assessed through questionnaires, but such instruments have high recall bias when used in frail and elderly persons (11). Accelerometers offer an objective alternative for measuring physical activity and have the advantage of being able to record activity continuously over days and even weeks in the patients’ own environment (12). Currently, no studies have examined longitudinal changes in activities using accelerometers, in patients with stroke. Most research to date has focussed on measuring activity at a single point in time, typically while patients are hospitalized or in community settings (13, 14); however, it is recommended that future studies focus on longitudinal monitoring of free daily activities in patients who are at risk of functional decline (15). A number of different devices are available (16), and evidence suggests that accelerometers yield valid and reliable data about the physical activity of patients with stroke (12, 15).
We aimed to perform a longitudinal study using instrumented measurement to establish physical activity levels early after stroke, and examine how activity levels changed over time.
Our two main hypotheses were:
• Patient activity levels would change during the first 6 months after stroke, in particular:
- The amount of time in an upright position would increase;
- The amount of time spent lying down would decrease;
- The number of transitions (changes in body position from, for example, lying to standing) would increase.
• Activity level is independently associated with patients’ function (particularly activities of daily living and balance), such that the amount of time in an upright position will increase as their functional level improves.
Methods
Population
Patients admitted to the stroke unit at St Olavs Hospital, Trondheim University Hospital, Norway, between October 2008 and December 2009 with a diagnosis of acute stroke according to World Health Organization’s (WHO’s) definition of stroke (17) were eligible for inclusion, if time from onset of stroke was less than 14 days. Both patients with first-ever and recurrent stroke were eligible. Only patients with a devastating stroke receiving end-of-life palliative care were excluded. Eligible patients were included if they were able and willing to sign informed consent. Patients who were not able to give informed consent were also included if their next of kin gave oral consent to participation. This is in keeping with Norwegian consent procedures for patients unable to consent for themselves. All patients and their next of kin were informed that they could withdraw their participation at any time. The study was approved by the Regional Committee of Medical and Health Research Ethics and Norwegian Social Science Data Services.
Study design and settings
This was a prospective longitudinal study with an initial assessment (Test 1) within 14 days after onset of stroke while the patients still were in the stroke unit and a further follow-up at 1 month (Test 2), 3 months (Test 3) and 6 months (Test 4) after Test 1. Two trained assessors performed all follow-up assessments. These assessments were performed at the rehabilitation clinic for patients receiving in-patient rehabilitation or at home for patients discharged to home or nursing home.
All patients received acute treatment at the stroke unit at St Olavs Hospital. This particular stroke unit is a well-established, evidence-based, comprehensive unit emphasizing early out-of-bed activity (mobilization) to a standing or sitting position within the first 24 h after onset of symptoms and physical therapy according to a task-oriented approach, focusing on independence in activities of daily living (ADL) (18, 19). Motor training was given as two daily sessions of 30 min 5 days a week during hospitalization (20). All patients were eligible for an Early Supported Discharge service, coordinated by a multidisciplinary team in close cooperation with the primary healthcare providers (21). The further rehabilitation was given according to the patients’ individual needs and functional level to enhance independence in daily living and facilitate physical activity. The setting for the follow-up could be at home, in a rehabilitation clinic or in a nursing home.
Activity monitoring
Physical activity was measured at the level of Activity and Participation, within the domain Mobility, according to the International Classification of Functioning Disability and Health (ICF) (22), using a single-axis accelerometers, PAL2, with a tilt switch (Gorman ProMed Pty Ltd, Victoria, Australia). We monitored across a 24-h period at Test 1 and across 3 days and nights at Test 2, Test 3 and Test 4.
The PAL2 consists of two monitors interconnected with a cable, one square box attached to the thigh (accelerometer) and a cylinder attached to the calf (tilt switch), which makes it possible to distinguish between standing, sitting and lying positions. The accelerometer and tilt switch were placed in a polyurethane sleeve with Velcro fastenings (Fig. 1). The PAL2 samples the vertical accelerations of the thigh at 10 Hz with a maximum recording time of 5 days. Two new AAA batteries were inserted before each recording. The software package PAL2calcs.exe (Gorman ProMed Pty Ltd, Victoria, Australia) was used for initializing, receiving, reviewing and processing data from each unit. Data were transferred from the unit to a Windows compatible personal computer by use of a Universal Serial Bus (USB) cable. Uploaded data were calibrated before the software summarized the activity. During the calibration procedure, the level of standing position and lying with bent knees was identified on the graph and set. For patients not able to stand, sitting and lying positions were identified. The data summary from each sampling period included: the number of transitions (change in position) and time in lying, sitting and upright position (standing/walking). The data summary file was converted to an Excel file for further analysis in SPSS (SPSSInc, Chicago, USA) and Stata IC v11 (StataCorp LP, Texas, USA).
Fig. 1. Single-axis accelerometer, PAL2, attached to the right leg.
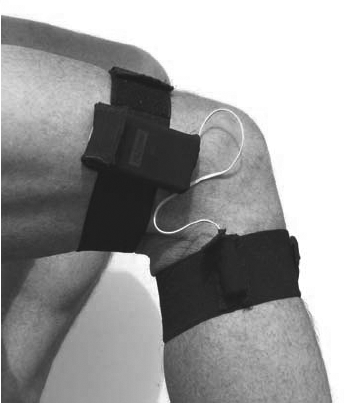
The PAL2 system is a relatively new device that has been shown to be accurate in measuring physical activity compared with video recording (23).
Other measures
The following variables were assessed at baseline: age, gender, medical history, time since stroke, marital status, pre-stroke accommodation, pre-stroke disability using the modified Rankin Scale (mRS), ranging from 0 (no symptoms) to 6 (death) (24).
At the level of Body Function (22), Scandinavian Stroke Scale (SSS), ranging from 0 to 58 points was applied to assess stroke severity (25) at admission. Mild stroke was defines as SSS score from 45 to 58 points, moderate stroke was defined as SSS score from 30 to 44 points, while severe stroke was defined as SSS score from 0 to 29 points.
At the level of Activities and Participation (22), Barthel Index, ranging from 0 to 100 points was applied to assess activities of daily living (24), Berg Balance Scale (26), ranging from 0 to 56 points, was applied to assess balance, and mRS to assess disability at inclusion and during follow-up.
Test procedure
At Test 1, PAL2 was initialized and attached to the patient in the afternoon on the day of inclusion and removed 24 h later. At Test 2, Test 3 and Test 4, PAL2 was initialized and attached to the patient on a Monday or Tuesday afternoon and removed on a Thursday or Friday afternoon to ensure a full 3 days of recording. The patients were instructed to go about their usual activity. All time-periods and reasons for removing PAL2 were registered.
Data processing and statistical analysis
Patients with the data missing not-at-random (e.g. due to patient’s withdrawal from the study or due to death) were excluded from the analysis. Some missing-at-random data were expected due to potential technical failures (e.g. device malfunction), or patient-related failures (e.g. device removed for showering and not re-applied correctly) over the course of this study. For every patient, if more than 30 consecutive minutes of data were missing on a given day for a given Test, the data for that day were excluded from further analysis, and data across remaining days within that Test were then averaged to derive the final activity measure. Activity data are presented as median activity over a 24-h period.
For every subject, physical activity was measured repeatedly over the course of time across the 4 occasions (Test 1, Test 2, Test 3 and Test 4). Repeated measures data are usually correlated, since sequential observations of the same subject tend to be closer in value to one another than the same number of observations collected from different subjects would be. Missing data also present special challenges for repeated measures analysis. Multi-level random effect generalized least square (GLS) regression modelling was chosen as the most appropriate statistical tool to address the hypotheses due to its advantages both in modelling longitudinal data and in handling data missing-at-random (27). Missing data do not present a problem for multi-level random effect generalized least-square models as long as data are missing at random. Missing data due to instrument failure, wrongly attached device and too short recording time (less than 24 h) was considered to be at-random. It is important to notice that data were missing from different patients at different time-points and there was no statistically significant association between specific patients’ characteristics and the data missing at a particular time-point.
Patients with data missing-at-random for one or more time-points were included in the final analysis set. Both Hypotheses 1 and 2 are independently tested at significance threshold alpha 0.05. To preserve the Type I error rate, the sub-hypotheses (H1) were tested at Bonferroni-corrected thresholds of 0.017 and alternative outcome measures in (H2) were tested at Bonferroni-corrected thresholds of 0.025, respectively.
Statistical analysis was conducted using commercial statistical software SPSS and Stata IC v11. To address Hypothesis 1, 3 multi-level random effect GLS regression models with individual patient as a level, Test 1–4 as an independent nominal variable coded as 4 binary variables each corresponding to an individual testing occasion, and a relevant measure of activity as a dependent variable, were used for the analysis of overall change in activity level across the 4 occasions (Test 1, Test 2, Test 3 and Test 4). To estimate the changes in number of transitions, a multi-level random effect Poisson regression model with individual patient as a level, Tests 1–4 as an independent nominal variable coded as 4 binary variables each corresponding to an individual testing occasion, and the number of transitions as a dependent variable, were used for the analysis of overall change across the 4 occasions (Test 1, Test 2, Test 3 and Test 4). Test 2 was chosen as the reference point. The analysis was then repeated, adjusting for patient’s age and baseline stroke severity as measured by SSS, as both of these factors are strong predictors for functional outcome after stroke (28, 29). To address the second hypothesis, a multi-level random effect GLS regression model with individual patients as a level, a relevant measure of functional level and time as independent variables, and a relevant measure of activity as a dependent variable, were used for the analysis of association between function and activity levels adjusted for time.
Results
Over a period of 12 months, 44 patients agreed to participate in the present study. Sixteen patients were excluded from the analysis because they died (n = 5) or withdrew from the study (n = 11), leaving a total of 28 patients for the analysis. At each time-point a variable number of patients were missing-at-random because: (a) the device was wrongly attached (n = 6), (b) instrument failure occurred (n = 13), (c) too short recording time (n = 7), or (d) no recording time because of holiday (n = 1); however, these patients were kept in the GLS model. Fig. 2 shows the flow of patients through the study.
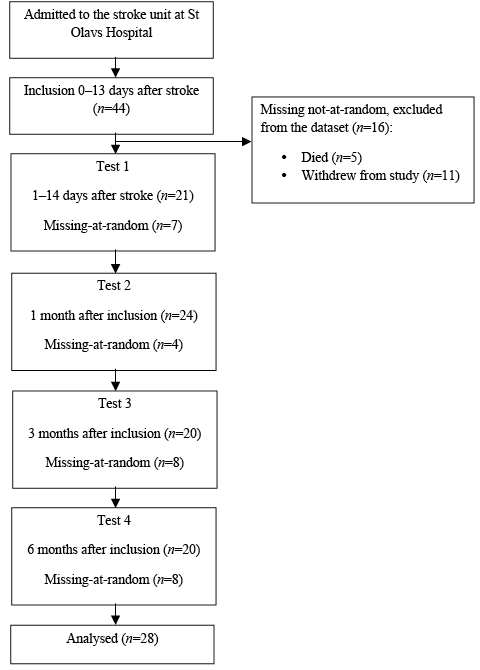
Fig. 2. Flow of patients through the study.
Table I shows the baseline characteristics for the 28 analysed patients. The mean age of participants was 78.7 years, ranging from 62 to 93 years (53.6% male). Sixty-eight percentage of the included patients had experienced their first-ever stroke. The mean days from onset of stroke to Test 1 were 7.5 days, ranging from 1 to 13 days.
|
Table I. Baseline characteristics fir the 28 patients with stroke |
|
|
Age, years, mean (SD) |
78.7 (8.7) |
|
Median (range) |
80.8 (62–93) |
|
Male, n (%) |
15 (53.6) |
|
First ever stroke, n (%) |
19 (67.9) |
|
Time since stroke from onset to inclusion, days, mean (SD) |
7.5 (3.2) |
|
Median (range) |
8.0 (1–13) |
|
SSS score at admission to hospital mean (SD) |
41.2 (14.8) |
|
Median (range) |
47 (9–57) |
|
Severity groups at admission to hospital, n (%) |
|
|
Mild stroke (SSS 45–58) |
17 (60.7) |
|
Moderate stroke (SSS 30–44) |
6 (21.4) |
|
Severe stroke (SSS 0–29) |
5 (17.9) |
|
Oxfordshire Stroke Classification, n (%) |
|
|
TACI |
4 (14.3) |
|
PACI |
5 (17.9) |
|
POCI |
6 (21.4) |
|
LACI |
8 (28.6) |
|
Haemorrhage |
4 (14.3) |
|
Not classified |
1 (3.6) |
|
Side of hemiparesis, n (%) |
|
|
Left |
11 (39.3) |
|
Right |
17 (60.7) |
|
Pre-stroke accommodation, n (%) |
|
|
Home alone |
15 (53.6) |
|
Home with family |
13 (46.4) |
|
Pre-stroke mobility, n (%) |
|
|
Independent no aids |
18 (64.3) |
|
Independent with aids |
9 (32.1) |
|
Dependent |
1 (3.6) |
|
SD: standard deviation; TACI: total anterior circulation infarct; PACI: partial anterior circulation infarct; POCI: posterior circulation infarct; LACI: lacunar infarct; SSS: Scandinavian Stroke Scale. |
|
Descriptive statistics were applied to derive the median and interquartile range of time spent in upright, sitting and lying position, and the number of transitions for all available cases at each occasion. These figures are reported in Table II. The median time in an upright position increased by a mean of 52 min a day over 6 months, while the median time in the lying position decreased by 138 min (2.3 h) in the same period. The change in number of transitions was less clear.
|
Table II. Time in different activities and functional level at each occasion |
||||
|
Test 1 (n = 21) |
Test 2 (n = 24) |
Test 3 (n = 20) |
Test 4 (n = 20) |
|
|
Lying, min, median (IQR) |
924 (714–1130) |
755 (656–910) |
760 (663–877) |
786 (655–919) |
|
Standing, min, median (IQR) |
92 (11–141) |
146 (29–321) |
144 (31–248) |
144 (66–232) |
|
Transitions, n, median (IQR) |
50 (16–103) |
63 (32–103) |
62 (35–123) |
59 (48–89) |
|
Modified Rankin Scale, n (%) |
||||
|
mRS = 0 |
0 (0.0) |
1 (4.2) |
1 (5.0) |
0 (0.0) |
|
mRS = 1 |
0 (0.0) |
6 (25.0) |
6 (30.0) |
5 (25.0) |
|
mRS = 2 |
3 (14.3) |
5 (20.8) |
3 (15.0) |
4 (20.0) |
|
mRS = 3 |
2 (9.5) |
4 (16.7) |
4 (20.0) |
3 (15.0) |
|
mRS = 4 |
12 (57.1) |
5 (20.8) |
5 (25.0) |
6 (30.0) |
|
mRS = 5 |
4 (19.0) |
3 (12.5) |
1 (5.0) |
2 (10.0) |
|
Test 1: less than 14 days after stroke; Test 2: 1 month after Test1; Test 3: 3 months after Test 1; Test 4: 6 months after Test 1; IQR: interquartile range. |
||||
Time spent in a lying position, adjusted for age and stroke severity, decreased by –134.8 min (95% CI: –48.4 to –221.3, p = 0.002), while time spent in an upright position increased by 65.7 min (95% CI: 104.9 to 26.5, p = 0.001) from Test 1 to Test 2 (Table IV).
The number of transitions did not change between Test 1 and Test 2, but were significantly reduced from Test 2 to Test 3 and Test 4 (Table III and Table IV).
|
Table III. Change in activity between tests with Test 2 as a reference point. Unadjusted values |
|||
|
Mean change Min |
95% CI |
p-valuea |
|
|
Change in lying positionb |
|||
|
Test 2 to Test 1 |
147.2 |
63.6 to 230.8 |
0.001 |
|
Test 2 to Test 3 |
11.3 |
–73.2 to 95.9 |
0.790 |
|
Test 2 to Test 4 |
–5.7 |
–91.5 to 80.2 |
0.900 |
|
Change in upright positionb |
|||
|
Test 2 to Test 1 |
–66.6 |
–105.6 to –27.7 |
0.001 |
|
Test 2 to Test 3 |
7.4 |
–32.0 to 46.7 |
0.710 |
|
Test 2 to Test 4 |
2.2 |
–38.1 to 42.4 |
0.910 |
|
Change in transitionsc |
|||
|
Test 2 to Test 1 |
0.93 |
0.87 to 1.0 |
0.060 |
|
Test 2 to Test 3 |
0.87 |
0.81 to 0.93 |
< 0.001 |
|
Test 2 to Test 4 |
0.89 |
0.83 to 0.95 |
0.001 |
|
aBonferroni-corrected significance threshold p = 0.005; bDifference in min compared with Test 2 estimated with multi-level random effect generalized least squares regression (positive difference means more time spent in a given activity compared with Test 2); cFactor change in expected number of transitions compared with Test 2 estimated with multi-level random effect Poisson regression (value above 1 means more transitions compared with Test 2). Test 1: less than 14 days after stroke; Test 2: 1 month after Test1; Test 3: 3 months after Test 1; Test 4: 6 months after Test 1; CI: confidence interval. |
|||
|
Table IV. Change in activity between tests with Test 2 as a reference point, adjusted for age and stroke severity |
|||
|
Mean change Min |
95% CI |
p-valuea |
|
|
Change in lying positionb |
|||
|
Test 2 to Test 1 |
134.8 |
48.4 to 221.3 |
0.002 |
|
Test 2 to Test 3 |
13.0 |
–74.5 to 100.5 |
0.077 |
|
Test 2 to Test 4 |
10.1 |
–78.2 to 98.4 |
0.082 |
|
Change in upright positionb |
|||
|
Test 2 to Test 1 |
–65.7 |
–104.9 to –26.5 |
0.001 |
|
Test 2 to Test 3 |
5.4 |
–34.3 to 45.0 |
0.079 |
|
Test 2 to Test 4 |
0.7 |
–39.8 to 41.2 |
0.097 |
|
Change in transitionsc |
|||
|
Test 2 to Test 1 |
0.94 |
0.87 to 1.01 |
0.072 |
|
Test 2 to Test 3 |
0.86 |
0.81 to 0.93 |
< 0.001 |
|
Test 2 to Test 4 |
0.89 |
0.83 to 0.95 |
0.001 |
|
aBonferroni-corrected significance threshold p = 0.005; bDifference in minutes compared with Test 2 estimated with multi-level random effect generalized least squares (GLS) regression (positive difference means more time spent in a given activity compared with Test 2); cFactor change in expected number of transitions compared with Test 2 estimated with multi-level random effect Poisson regression (value above 1 means more transitions compared with Test 2). Test 1: less than 14 days after stroke; Test 2: 1 month after Test 1; Test 3: 3 months after Test 1; Test 4: 6 months after Test 1; CI: confidence interval. |
|||
The associations between upright position and functional level adjusted for time, were significant for both Barthel Index and for the Berg Balance Scale, with patients spending more time in an upright position as their functional level increased. Adjusted for time, a single point increase on Berg Balance Scale was associated with an extra 4.3 min (95% CI: 3.05 to 5.59, p < 0.001) spent in an upright position, while a single point increase on Barthel Index was associated with an extra 2.1 min (95% CI: 1.15 to 3.05, p <0.001) spent in the upright position.
Discussion
As hypothesized, we found that patients increased the amount of time spent in an upright position and decreased the amount of time in a lying position from their initial hospital stay until 1 month later. However, there were no further changes in activity levels during the next 5 months. The number of times patients changed positions throughout the day did not change in the early phase, but showed a small decrease during follow-up. These findings remained significant after adjusting for age and stroke severity. Our second hypothesis was also confirmed, as time in an upright position was positively associated with function adjusted for time. In addition to these findings, we have shown that it is feasible to record stroke patients’ activity using accelerometers at multiple time-points within the first 6 months of stroke.
The most significant finding from the present study was that the change in activity levels after stroke occurred mainly during the early phase, i.e. from the initial hospital stay to 1 month later. However, as seen from the wide confidence intervals, there was also great variability in the individual activity patterns after adjusting for stroke severity.
Using a device to measure physical activity is a relatively recent phenomenon in stroke research. Although an increasing number of devices are available, they often measure different outcomes (30, 31). Biologically, it appears to be important that devices are able to measure the time spent upright (on one’s feet) and in sedentary positions, as both appear to have strong associations with both health and disease (32). The time spent in an upright position recorded at Test 1 in the present study corresponds closely with the median of 94 min upright time over a 24-h period reported in a mixed group of elderly hospitalized patients (31). If we consider that approximately 40% (n = 11) of patients had moderate to severe stroke (SSS < 45), this represents a relatively high activity level across the included patients as this recording was within the first 14 days after stroke when the patients were still in the stroke unit. The median time in an upright position at 3 and 6 months follow-up was 144 min over 24 h, less than half the time that a group of community dwelling people spent upright (31). The low levels of activity found in this study during follow-up are consistent with other samples of people with chronic stroke (9).
The time spent in a lying position decreased more than time in upright position increased, indicating that some of the lying time was converted to sitting time. The median lying time at Test 4 was 786 min (i.e. 13.1 h). This time was distributed equally between dependent and independent patients. Time spent in a lying position should preferably be sleeping time. In healthy people there is an age-related reduction in total sleep time, and it has been shown that older people need on average 6.5 h sleep at night (33). We know little about how much rest people with stroke need; however, the estimate from this study of over 13 h of lying down per day indicates that stroke survivors spend a large proportion of the day lying in bed, although only 2 out of 20 patients were classified as bedridden (mRS score = 5) at the end of follow-up. One may ask whether fatigue, which has been shown to occur in 40–70% of stroke survivors (34, 35), influenced the time patients in this study spent in upright and lying positions.
The strengths of the present study are that it included patients from all severity groups, and with a mean age of 79 years, which is very close to that of the Norwegian stroke population (36). It is also a strength that we succeeded in measuring activity across the first 6 months after stroke using a device that distinguished between sitting, lying and standing positions.
The advantage of recording physical activity by body-worn sensors is that they can record activity over several days in the patients’ own environment; however, the disadvantages include that device failures are possible, and this is often not obvious until the end of the data collection period. This was the case for 13 recordings in the present study. However, these data were regarded as missing-at-random, and the remaining data-points for these patients were kept in the GLS model. Another disadvantage is that the PAL2 is not waterproof and has to be removed during bathing, increasing the risk of forgetting to reattach the device and to reattach it wrongly. In the present study 7 recordings were missing because of too few recording hours and 6 recordings were missing because of incorrect reattachment of the device (upside down or inside out). We regard it as unlikely that data missing for these reasons were related to activity level; hence, they were also classified as missing-at-random. Altogether, this resulted in 27 out of 112 data-points (24%) being missing-at-random, which does not represent a major problem in the applied GLS model (37). Furthermore, it can be inconvenient to wear the monitors over several days (31), and consequently patients may elect to remove the device. The PAL2 monitor is attached by Velcro straps to the thigh and calf, and a lot of patients found it uncomfortable to wear the monitor for 3 consecutive days, which, among other reasons, resulted in 25% of the patients (n = 11) choosing to withdraw from the study.
A major limitation of the present study is the small sample size. A second limitation is that the activities undertaken while the patient is upright are rarely known (i.e. we cannot distinguish between indoor and outdoor walking). In some cases the intensity of the activity can be monitored, which allows researchers to distinguish between, for example, fast and slow walking. We did not elect to measure the intensity of activity in this group, but given the relatively low levels of activity found, it is reasonable to assume that most of the time spent in upright positions is spent on activities of daily living. As such, we expect that this level of activity would have little or no impact on their cardiovascular fitness.
In conclusion, this study shows that, even though the activity level increased significantly from baseline to 1 month later, the stroke survivors spent very little time in an upright position during the first 6 months after stroke. We are a long way from understanding how much upright activity is needed to maintain or improve health and wellbeing after stroke, or the barriers and facilitators to achieving adequate levels of activity in those affected by stroke. As activity monitoring devices become more reliable, cheaper and comfortable enough for regular use, they may become a powerful tool for therapists wishing to help promote activity. For now, they remain a useful research tool and further studies exploring longitudinal change in patients are warranted.
Acknowledgements
The authors would like to thank all the stroke patients and their families who agreed to take part in the study. We also thank the Norwegian Fund for Postgraduate Training in Physiotherapy for funding this study.
Financial support. Torunn Askim was supported through The Norwegian Fund for Postgraduate Training in Physiotherapy. We certify that no commercial party having a direct interest in the results of the research supporting this article has or will confer a benefit on us or on any organization with which we are associated.
References

