Johan Gäverth, PT, MSc1,2, Maria Sandgren, PT3, Påvel G. Lindberg, PT, PhD1,3,4, Hans Forssberg, MD, PhD1 and Ann-Christin Eliasson, OT, PhD1
From the 1Department of Women’s and Children’s Health, Karolinska Institutet, 2Department of Physiotherapy, Karolinska University Hospital, 3Department of Clinical Sciences, Rehabilitation Medicine, Karolinska Institutet, Danderyd Hospital, Stockholm, Sweden and 4Centre d’Etudes de la Sensorimotricité, CNRS UMR 8194, Paris, France
OBJECTIVE: To describe the reliability of an instrument (Neuro Flexor) designed to be used in the clinic for quantification of the relative contribution of spasticity, elasticity and viscosity to resistance during passive wrist movements.
DESIGN: A test-retest and inter-rater reliability study.
SUBJECTS: A convenience sample of 34 adults with chronic stroke with spasticity in the hand, and a reference group of 10 healthy persons.
METHODS: Two raters assessed the participants with the NeuroFlexor. Elastic, viscous and neural components of passive movement resistance were quantified at the wrist. Test-retest and inter-rater intraclass correlation coefficient (ICC2.1) were calculated for each component for both raters and two sessions. Degree of measurement error was evaluated using the coefficient of variation and the repeatability coefficient.
RESULTS: Reliability was high for the neural component (test-retest: 0.90–0.96; inter-rater: 0.90–0.94), fair to good for the elastic component (test-retest: 0.79–0.88; inter-rater: 0.76–0.76), and fair to high for the viscous component (test-retest: 0.88–0.90; inter-rater: 0.75–0.80). Based on test-retest data, the coefficients of variation for the neural, elastic and viscous components were 25%, 26% and 16%, respectively, and the repeatability coefficients were 1.798, 1.897 and 1.404, respectively.
CONCLUSION: The NeuroFlexor instrument is a reliable measure of spasticity and of muscle elasticity and viscosity in individuals with wrist and finger muscle resistance to passive stretch after stroke.
Key words: hand; medical instrument; outcome assessment; muscle spasticity; stroke; upper extremity; wrist.
J Rehabil Med 2013; 45: 00–00
Correspondence address: Johan Gäverth, Karolinska Institutet Department of Women’s and Children’s Health, Neuropediatric Research Unit and Stockholm Brain Institute, Astrid Lindgrens Barnsjukhus Q2:07, SE-171 76 Stockholm, Sweden. E-mail: johan.gaverth@ki.se
Accepted Feb 18, 2013; Epub ahead of print Maj 17, 2013
Introduction
Spasticity is a clinical symptom that is routinely assessed to describe the neurological condition of the patient (1, 2) and is defined as “a motor disorder characterized by a velocity-dependent increase in tonic stretch reflexes (‘muscle tone’) with exaggerated tendon jerks, resulting from hyperexcitability of the stretch reflex” (3). By this definition of spasticity, increased resistance to passive stretch caused by alterations in muscle and tissue properties, such as elasticity and viscosity, are excluded. Spasticity is a motor impairment after stroke and several other neurological disorders, including cerebral palsy, multiple sclerosis, and aquired brain and spinal cord injuries. Alleviation of spasticity is often considered in the clinical management of these conditions. However, better methods of quantifying the level of spasticity are needed to enable the management of spasticity in daily clinical practice (4). The most commonly used clinical measure of spasticity is the Modified Ashworth Scale (MAS) in which the examiner uses a six point ordinal scale to rate the resistance when the limb is passively moved (5). However, the validity of the MAS has been questioned by several authors (6, 7), and its reliability has been reported as poor to fair (8, 9). Furthermore, the MAS does not distinguish between the neural resistance induced by the reflex activity, i.e. spasticity (3), and the increased non-neural passive resistance of the muscle caused by changes in muscle and connective tissue (10). There are several advanced methods available, including electromyography, kinematics, and kinetics, but these are difficult to use in a clinical setting and often require specific training (6, 11, 12).
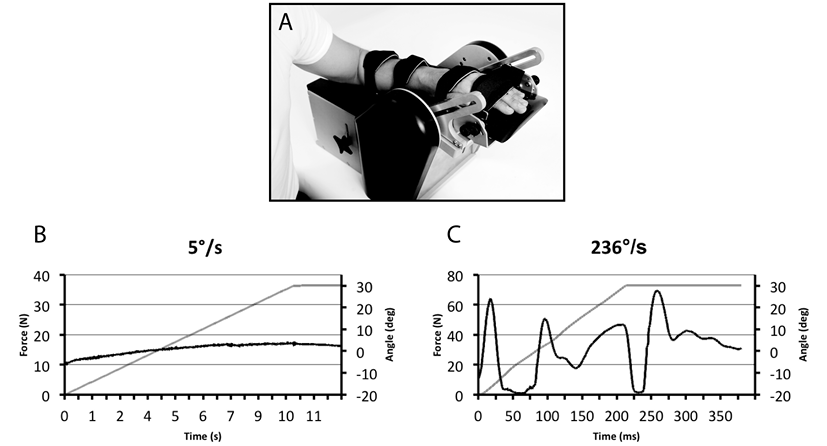
In a recent report, we presented evidence for the validity of a method to measure spasticity, with the aim of developing a tool that could be used in the daily clinical management of patients with spasticity (13). A mechanical instrument extends the wrist and stretches the muscles at two different constant velocities. The method is based on a biomechanical model of the hand and a mechanical instrument that passively extends the wrist and stretches the muscles at constant slow and fast velocities (13). A force transducer measures the resistance in newton (N) throughout the movements. The model can distinguish the neural component induced by the stretch reflex (3) from the resistance caused by altered muscle properties (10). See Fig. 1 for detailed information about the model. Evidence for validity of the method has been presented in three ways (13). Firstly, the neural component was reduced after an ischaemic nerve block. Secondly, the neural component correlated with the electromyographic responses across subjects and in the same subjects during the ischaemic nerve block. Thirdly, in accordance with Lance’s definition that spasticity is velocity-dependent (3), the neural component increased when the muscles were stretched at higher velocities. The ability to differentiate between the different components of the resisting force in the spastic limb is important, because treatments such as botulinum toxin target the neural component, while treatments such as splints and stretching, target the viscoelastic components (16).
Fig. 1. (A) The NeuroFlexor instrument. The hand rests on the platform with the metacarpophalangeal joints in slight flexion and the fingers fully extended. Both hand and arm are fastened using non-elastic Velcro straps in order to ensure that movement can occur only at the wrist joint. The movement range is from 20º flexion to 30º extension and movement is produced at two controlled velocities. A force transducer records the total resisting force (N) opposing the passive wrist movement. (B–C) Examples of force traces (black line) from one person with stroke. The grey line shows the angle of the wrist joint. In the slow movement (5º/s), force is recorded 1 s after the movement has stopped with the wrist in extension. This force represents the elastic component (EC) of the resistance. The recorded resisting forces are analysed in using dedicated computer software and different components of the resistance are estimated. In the analysis, biomechanical assumptions stated by Koo & Mak (14) are applied. The resisting force produced during passive wrist extension is regarded as a sum of forces caused by muscle and tissue elasticity, viscosity, and inertia, and by active (reflex) muscle contraction according to the following equation: Fm(θ) = Fp(θ) + Fv(θ) + Fr(θ) + Fin(θ), where Fm is the total measured passive force, Fp is the elasticity, Fv is the viscosity, Fr is the reflex resistance i.e. spasticity, Fin is the inertia of both the limb and the moving parts of the measuring instrument, and θ denotes a specific angle. Elasticity causes a length-dependent component of the resisting force that increases the more the muscles and tendons are stretched. Viscosity causes a velocity-dependent component of the resisting force, for example, from sliding muscle fibres (15). By applying different constant velocities, the viscous and elastic components of the resisting force during the stretch can be separated out, resulting in a remaining neural (spasticity) component (13).
The method described above has now been applied in a newly developed instrument, the NeuroFlexor (Aggero MedTech AB, Solna, Sweden). An important step in evaluating the clinical usefulness of the instrument is to establish its reliability; that is, it should be ensured that the measurements are stable between trials and across examiners. It is also important to determine the limits for the smallest difference that indicates a real change, both at a group and an individual level (17). The primary aim of this study was therefore to describe the reliability of the NeuroFlexor measurements in persons with chronic stroke.
Methods
Study design and participants
A test-retest and inter-rater design was used. A convenience sample of persons with stroke from Danderyd University Hospital, Department of Rehabilitation Medicine, Stockholm, Sweden was recruited following discharge. The inclusion criteria were: (i) chronic stroke, i.e. stroke at least 6 months prior to inclusion; (ii) spasticity ranging between 1 and 3 on the MAS at time of discharge; and (iii) ability to understand and comply with the instructions of the study. The exclusion criteria included presence of fixed contractures limiting wrist extension to < 40º with fingers extended. A total of 34 (7 female) persons met the selection criteria and agreed to participate. Mean age was 53.8 years (95% confidence interval (CI): 49.6–58.0) and mean time since stroke was 5.0 years, (95% CI: 3.7–6.2) (Table I). A group of 10 non-neurologically impaired persons of comparable age and gender participated as a reference group (Fig. 2).
Approval was obtained from the regional ethics review board in Stockholm, Sweden. All participants gave written informed consent in accordance with the Declaration of Helsinki.
Procedure
The test session began with an assessment of passive range of movement (18), MAS (5) and maximal grip strength (19) (Jamar hand grip dynamometer, Sammons Preston, Bolingbrook, Ill, USA). Two experienced physiotherapists (authors JG and MS) then used the NeuroFlexor to perform test-retest measurements of resistance to passive stretch of the wrist muscles. The raters, who are labelled A and B in the results, had received training on how to perform the measurements prior to the study. Evaluations were performed with a 10-min interval between the sessions. The raters evaluated each subject in two sessions each. The order of the raters was consecutively changed to avoid systematic order effects. The raters were blinded to each other’s measurements.
Quantification of neural and non-neural components of passive movement resistance
The resistance induced by a passive wrist extension was measured using a portable computer-controlled step motor system (NeuroFlexor) that produced constant velocity movements (Fig. 1). Participants were seated comfortably with the instrument next to them as close to the seat as possible. The participant’s shoulder was in approximately 45º abduction, the elbow in 90º flexion, and the forearm pronated. The hand was carefully positioned in a standardized position according to a landmark on the hand platform, and adjusted so that the movement axis of the wrist joint was aligned with the rotation axis of the instrument to minimize measurement errors (13) (Fig. 1). Proper alignment was assured through visual inspection and by making sure the forearm did not move during testing. Both raters noted their settings (height of armrest and position of hand platform) during the first session. The hand was removed from the instrument and the rater restored it to the default settings before the subsequent test by the other rater. The noted settings were re-used during the second evaluation. Two passive stretch velocities were used in each session: slow (5º/s) and fast (236º/s) (13). The range of wrist movement was 50º, with 20º flexion as the starting angle for all participants. This range was needed in order to allow time for the muscle to contract as a response to the stretch reflex. The slow velocity was used before the fast velocity. One test session consisted of 5 slow and 10 fast movements, of which the first recording from each of the slow and fast movement sets was excluded from the analysis in order to avoid bias from startle reflexes and mechanical hysteresis. A dedicated software program was used to separate the total resistance into its elastic (EC), viscous (VC), and neural (NC) components (NeuroFlexor Scientific v 0.0.6, 2011, Aggero MedTech AB, Solna, Sweden).
Statistical analysis
Descriptive statistics were expressed as means with 95% CI. A paired t-test was used to assess any systematic bias between raters and sessions. Repeated measures analysis of variance (RM-ANOVA) was used to explore the effect of repeated measures within a session and the effect of order between sessions. An alpha of p < 0.05 was used to determine statistical significance.
To assess reliability, a two-way random effects model single measure was used to generate an intraclass correlation coefficient model 2.1 (ICC2,1) with 95% CI (20). The guidelines given by Currier (21) were used to assess the ICC coefficients: 0.90–0.99: high reliability, 0.80–0.89: good reliability, 0.70–0.79: fair reliability, and ≤ 0.69: poor reliability. The data was not normally distributed (Shapiro–Wilk’s test, p < 0.05) and the measured components showed unequal variance which is why log-transformation was performed using the natural logarithm, as recommended by Bland & Altman (22, 23). As described in our earlier paper (13), values lower than zero of the measured components may occur for participants with low resisting forces. This is partly explained by slightly incorrect placement of the hand in relation to the instrument’s centre of rotation. In this study 7 participants showed small negative values in one of the components (participants #15, #17, #19 and #35–38). The lowest negative value for the NC was –2.15 Newton (N) (mean –1.06, 95% CI –1.79 to –0.33), for the EC –0.6 N (mean 0.27, 95% CI –0.43 to 0.96), and for the VC –0.68 (mean –0.44, 95% CI –0.69 to –0.19). Logarithmic transformation does not allow negative values; therefore a constant was added, with 3 N for the NC, 1 N for the EC and 1 N for the VC values (24, 25). The values of the NC with constant added are shown in Table I and Fig. 2.
|
Table I. Demographic and clinical characteristics of the participants with stroke in this study. The individuals are arranged according to total resistance recorded with the NeuroFlexor (low to high) |
|||||||||||
|
Participant |
Age (years) |
Years since stroke |
Gender |
Paretic side |
Type of stroke |
Max grip % |
Passive wrist extension (deg) |
MAS wrist (0–4) |
MAS fingers (0–4) |
Total resistance (N) |
NC (N) |
|
15 |
64 |
4.6 |
M |
R |
I |
75 |
90 |
1 |
0 |
7.6 |
0.9 |
|
5 |
66 |
8.3 |
F |
R |
I |
78 |
75 |
0 |
0 |
8.6 |
4.7 |
|
11 |
63 |
3.5 |
F |
R |
H |
84 |
85 |
1 |
1 |
8.8 |
3.5 |
|
20 |
55 |
1.5 |
M |
L |
H |
0 |
85 |
1 |
0 |
9.5 |
4.2 |
|
16 |
64 |
1.0 |
M |
L |
I |
58 |
90 |
0 |
0 |
10.7 |
3.2 |
|
9 |
80 |
6.8 |
M |
R |
I |
6 |
75 |
0 |
2 |
10.8 |
4.8 |
|
22 |
23 |
1.3 |
M |
R |
I |
87 |
95 |
0 |
0 |
11.1 |
3.6 |
|
6 |
47 |
16.9 |
M |
R |
H + I |
0 |
60 |
1 |
0 |
12.4 |
3.6 |
|
24 |
62 |
4.3 |
F |
R |
I |
8 |
90 |
1 |
1 |
12.7 |
8.1 |
|
26 |
32 |
4.0 |
M |
L |
H |
85 |
90 |
0 |
0 |
13.0 |
7.1 |
|
1 |
57 |
7.6 |
M |
R |
I |
75 |
65 |
1+ |
0 |
14.7 |
10.3 |
|
13 |
68 |
5.6 |
F |
L |
I |
0 |
75 |
0 |
2 |
15.5 |
10.7 |
|
23 |
63 |
4.4 |
M |
L |
I |
65 |
70 |
0 |
0 |
15.6 |
9.8 |
|
8 |
56 |
2.6 |
M |
R |
H + I |
60 |
70 |
1+ |
0 |
16.0 |
10.8 |
|
7 |
63 |
8.3 |
M |
R |
H |
18 |
85 |
0 |
0 |
16.2 |
9.0 |
|
4 |
69 |
13.5 |
M |
R |
H + I |
77 |
70 |
0 |
0 |
17.0 |
9.8 |
|
14 |
36 |
1.5 |
F |
L |
H |
0 |
85 |
1+ |
2 |
18.2 |
16.0 |
|
3 |
42 |
6.8 |
M |
R |
H |
6 |
80 |
1 |
0 |
19.3 |
14.2 |
|
27 |
44 |
0.7 |
M |
R |
H |
0 |
85 |
1 |
2 |
20.1 |
12.2 |
|
33 |
48 |
2.3 |
M |
L |
H |
0 |
0 |
3 |
3 |
20.7 |
16.1 |
|
2 |
59 |
2.7 |
M |
R |
I |
2 |
75 |
2 |
2 |
20.7 |
15.2 |
|
31 |
43 |
9.5 |
M |
R |
H |
54 |
90 |
1 |
1 |
21.1 |
18.1 |
|
28 |
38 |
4.6 |
M |
R |
H |
0 |
85 |
2 |
2 |
26.6 |
15.6 |
|
19 |
58 |
3.2 |
M |
L |
I |
29 |
85 |
1 |
2 |
26.9 |
16.8 |
|
34 |
61 |
10.5 |
M |
L |
H |
9 |
70 |
3 |
2 |
31.3 |
25.5 |
|
29 |
52 |
4.2 |
F |
R |
I |
0 |
80 |
3 |
3 |
31.3 |
25.4 |
|
21 |
45 |
2.4 |
M |
L |
H |
0 |
75 |
1+ |
1 |
32.3 |
22.1 |
|
32 |
54 |
1.4 |
M |
R |
H |
0 |
50 |
3 |
3 |
34.1 |
29.2 |
|
25 |
63 |
5.1 |
M |
L |
I |
0 |
65 |
3 |
3 |
40.7 |
34.0 |
|
18 |
48 |
2.5 |
M |
L |
I |
0 |
70 |
3 |
2 |
43.0 |
33.9 |
|
10 |
60 |
6.5 |
F |
R |
H |
10 |
40 |
1 |
2 |
43.3 |
36.7 |
|
17 |
58 |
4.0 |
M |
L |
I |
55 |
70 |
2 |
1 |
51.8 |
44.2 |
|
30 |
45 |
2.9 |
M |
L |
H |
0 |
55 |
3 |
3 |
64.3 |
42.0 |
|
12 |
43 |
3.7 |
M |
R |
I |
0 |
40 |
3 |
3 |
65.7 |
50.6 |
|
M: male; F: female; L: left; R: right; H: haemorrhage; I: infarction; MAS: Modified Ashworth Scale; Max Grip%: maximal grip strength measured with Jamar hand dynamometer, expressed as a percentage of grip strength in the unaffected hand; deg: degrees; NC: neural component; N: Newton. |
|||||||||||
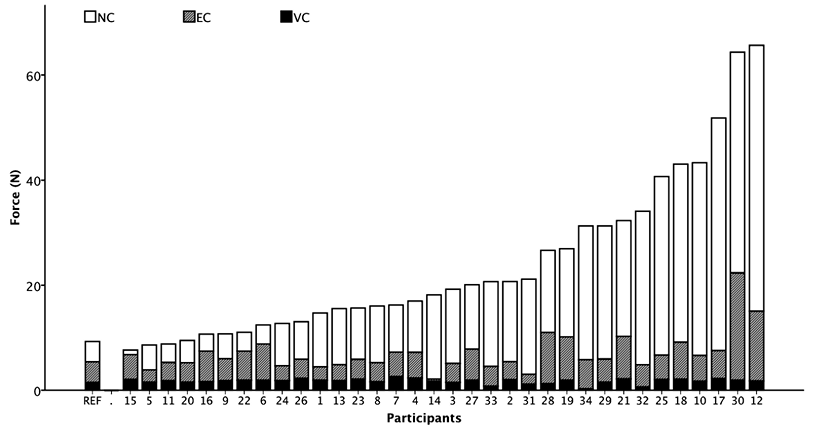
Fig. 2. Individual profiles of NeuroFlexor components arranged according to the total resistance. REF: mean of the NeuroFlexor components recorded by the non-neurologically impaired reference group; NC: neural component, EC: elastic component, VC: viscous component.
Coefficient of variation (CV%) was used to determine the limit for the smallest difference to indicate a real change at the group level. When log-transformed data were used, the CV% was calculated using the formula CV% = (eSDw –1) × 100, where e is the base of the natural logarithm and SDw is the within-subject standard deviation, which is the square-root of the mean-square residual from a one-way analysis of variance (22).
The repeatability coefficient (r) was used to determine the smallest difference to indicate a real clinical change at the individual level (22). This coefficient corresponds directly to the smallest real difference (SRD), often described in reliability studies; see, for example, Lexell & Downham (17). The definition of repeatability is that the difference between a measurement and the true value would be expected to be less than 1.96 × √2 SDw for 95% of pairs of observations. The repeatability coefficient is calculated according to the formula r = (eSDw)2.77 (22). Subtracting on the log scale is equivalent to dividing on the natural scale, and multiplying on the natural scale is equivalent to adding on the log scale (22). Therefore, to calculate the upper and lower limits (± 2.77 SDw) of an observed value, the following formulas were used: lower limit = ((X0 + k)/r) – k and upper limit = r (X0 + k) – k, where X0 is the observed value, r is the repeatability coefficient, and k is the constant added before log transformation (k is NC = 3, EC = 1, VC = 1).
Results
Maximal grip strength and Modified Ashworth Scores varied widely among participants, and a similar variation was present in the force measurements using the NeuroFlexor (Table I). There was no effect of repeated measures within the first test session, i.e. 5 slow and 10 fast movements (RM-ANOVA, p < 0.05) or between sessions (RM-ANOVA, p > 0.05). The NC contributed most to the total resisting force in the majority of participants, while the combination of the EC and VC was larger in only 4 participants (#6, #15, #16, and #22 in Fig. 2).
Inter-rater and test-retest reliability
Test-retest reliability (ICC2,1) was high for NC (0.90, 0.96 for raters A, B, respectively), fair to good for EC (0.79, 0.88), and good to high for VC (0.88, 0.90) (Table II). Inter-rater reliability (ICC2,1) was high for NC (0.90, 0.94) and fair to good (0.75, 0.80) for both EC and VC (Table II). There was no systematic bias for NC, EC and VC between raters or sessions (paired t-test, p > 0.05).
|
Table II. Test-retest and inter-rater reliability coefficients of the NeuroFlexor data |
|||||
|
Rater |
ICC2,1 |
95% CI |
CV% |
r |
|
|
Test-retest reliability |
|||||
|
NC |
Rater A |
0.90 |
0.80, 0.95 |
32 |
2.103 |
|
Rater B |
0.96 |
0.92, 0.98 |
16 |
1.498 |
|
|
EC |
Rater A |
0.88 |
0.77, 0.94 |
19 |
1.616 |
|
Rater B |
0.79 |
0.63, 0.89 |
33 |
2.178 |
|
|
VC |
Rater A |
0.90 |
0.81, 0.95 |
9 |
1.301 |
|
Rater B |
0.88 |
0.77, 0.94 |
17 |
1.508 |
|
|
Inter-rater reliability |
|||||
|
NC |
First evaluation |
0.90 |
0.81, 0.95 |
32 |
2.070 |
|
Second evaluation |
0.94 |
0.89, 0.97 |
16 |
1.603 |
|
|
EC |
First evaluation |
0.76 |
0.57, 0.87 |
33 |
2.210 |
|
Second evaluation |
0.76 |
0.58, 0.88 |
31 |
2.070 |
|
|
VC |
First evaluation |
0.75 |
0.55, 0.86 |
21 |
1.667 |
|
Second evaluation |
0.80 |
0.63, 0.89 |
18 |
1.576 |
|
|
NC: neural component (spasticity); EC: elastic component; VC: viscous component; ICC2,1: intraclass correlation coefficient; CI: confidence interval; CV%: coefficient of variance expressed as a percentage; r: repeatability coefficient. |
|||||
Coefficient of variation and repeatability coefficient
The test-retest coefficients of variation (CV%) for NC, EC and VC were 25%, 26% and 16% respectively (mean of raters A and B, Table IIA). The test-retest repeatability coefficients (r) were 1.798 for NC, 1.897 for EC and 1.404 for VC (mean of raters A and B, Table II). Similar results were found for inter-rater CV% and r (Table II). Since variation between measurements increase with increasing resistance, the test-retest repeatability coefficients were used to calculate the upper and lower bounds for a measured value, indicating a real change for NC, EC and VC in the relevant intervals; see Fig. 3 and Table III.
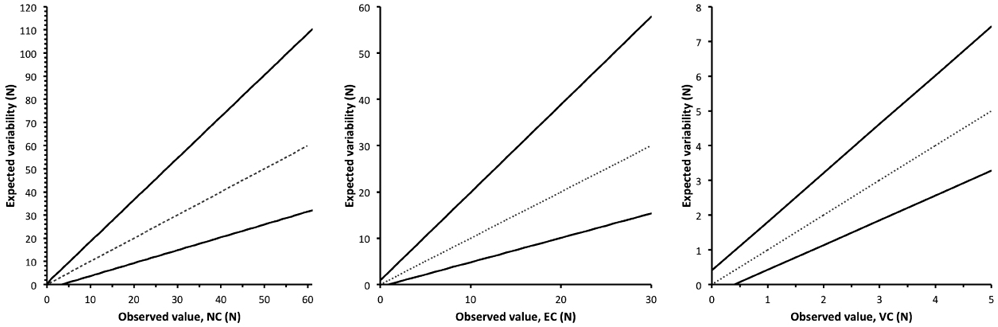
Fig. 3. Expected variability of the measurements of the neural (NC), elastic (EC), and viscous (VC) components. On the basis of the observed values, the expected variability for a single measure (grey line) will be within the range of the lower and upper bounds illustrated by the solid line. Mean r of raters A and B was used: rNC = 1.798, rEC = 1.897, and rVC = 1.404.
|
Table III. Expected variability for 95% of the observations for NC, EC and VC components of the NeuroFlexor measurement. Based on intra-rater (test-retest) repeatability coefficient (r), the individual expected variablity for 95% of pairs of observations lies within the upper and lower bounds |
|||
|
Observed value (N) |
Lower bound (N) |
Upper bound (N) |
|
|
Neural component |
5 |
1.5 |
11.4 |
|
10 |
4.2 |
20.4 |
|
|
15 |
7.0 |
29.3 |
|
|
20 |
9.8 |
38.3 |
|
|
25 |
12.6 |
47.3 |
|
|
30 |
15.4 |
56.3 |
|
|
35 |
18.1 |
65.3 |
|
|
40 |
20.9 |
74.3 |
|
|
45 |
23.7 |
83.3 |
|
|
50 |
26.5 |
92.2 |
|
|
55 |
29.3 |
101.2 |
|
|
60 |
32.1 |
110.2 |
|
|
Elastic component |
2 |
0.6 |
4.7 |
|
4 |
1.6 |
8.5 |
|
|
6 |
2.7 |
12.3 |
|
|
8 |
3.7 |
16.1 |
|
|
10 |
4.8 |
19.9 |
|
|
12 |
5.9 |
23.7 |
|
|
14 |
6.9 |
27.5 |
|
|
16 |
8.0 |
31.2 |
|
|
18 |
9.0 |
35.0 |
|
|
20 |
10.1 |
38.8 |
|
|
22 |
11.1 |
42.6 |
|
|
24 |
12.2 |
46.4 |
|
|
Viscous component |
1 |
0.4 |
1.8 |
|
1.5 |
0.8 |
2.5 |
|
|
2 |
1.1 |
3.2 |
|
|
2.5 |
1.5 |
3.9 |
|
|
3 |
1.8 |
4.6 |
|
|
3.5 |
2.2 |
5.3 |
|
|
4 |
2.6 |
6.0 |
|
|
4.5 |
2.9 |
6.7 |
|
|
5 |
3.3 |
7.4 |
|
|
N: Newton; NC: neural component; EC: elastic component; VC: viscous component. Mean r of raters A and B was used to calculate the lower and upper bounds: rNC = 1.798, rEC = 1.897, and rVC = 1.404. |
|||
Discussion
The main result of this study is that the inter-rater and test-retest reliability were high for the neural component and moderate to high for the non-neural components. This is probably the first time that an instrument developed for clinical settings has been found to have moderate to high reliability both within individuals and between examiners. In addition, we have presented the limits for the smallest difference indicating a real change in each component, which will help the clinician to evaluate the effect of a spasticity-reducing treatment.
There has been a lack of reliable methods to measure spasticity in the clinic; such methods must be simple and objective. This study has shown that the NeuroFlexor has higher reliability than the commonly used Modified Ashworth Scale (8, 9). One explanation for this higher reliability might be that instrumented quantitative measurements of force are more reliable than ordinal scales, based on a subjective estimation by an examiner. The advantage of instrumented devices to measure spasticity is supported by a previous study by Turk et al. (1), in which a wrist rig was used to produce passive movements, and surface electromyography was applied to record the amplitude and duration of the induced stretch reflex. The test-retest reliability of the neural component was high (ICC = 0.98). Similar results were found by Starsky et al. (26), who used an instrumented device to quantify elbow spasticity. The advantage of the NeuroFlexor compared with the above-mentioned studies is that it allows quantification of the neural and non-neural components without the use of surface electromyography, which makes it simpler to use in clinical practice.
Two problems in measuring spasticity are that it may vary over time (27) and it may be context-dependent. We were therefore careful to have only a short interval between measurements and to maintain a calm and relaxed environment during testing. Although the velocity of stretch was constant and the forces were recorded from a transducer, there might be errors resulting from the construction of the measurement instrument and the person performing the measurements. One important source of error is the placement of the hand on the platform. In our previous study (13), we showed that even small displacements will create measurement errors that contribute to increased variability. The variation around zero in the participants with low resistance to passive stretch resulted in some negative values. A compensation for these negative values was applied in order to allow the log-transformation necessary for the statistical analysis. This affects the reliability statistics in a slightly favourable direction, due to an increased group mean, but an unchanged variation. This is a limitation of this study and should be considered when comparing these results with those of future studies.
Both in clinical follow-ups of patients and in research, it is important to define how large a difference between measurements must be in order to be considered real; i.e., how large it must be in order to be greater than the measurement error. Of the different ways to calculate this, we chose the coefficient of variation and the repeatability coefficient. The reason for this was that the analysis revealed heteroscedasticity in the data, meaning that the variation between measurements was larger in participants with high resisting force than in participants with low passive resisting force (Fig. 3). This supports the use of CV% and r as proposed by Bland & Altman (22), giving an estimation of the measurement error relative to the observed value. This means that a person with a large initial neural component requires a greater absolute change after an intervention compared with a person with a low NC. No clear guidelines exist for the interpretation of CV% and r. However, previous studies on the stretch reflex have shown similar high variability, as in the present study. Stam et al. (28) showed that reflex responses to an instrumented Achilles tendon tap and a patellar tap had a CV% of > 19% and > 30%, respectively. Similar results were found by Dimitrijević et al. (29) Hence, the size of the CV% in the present study appears to be realistic. Since the r is derived from the same ANOVA as the CV%, the magnitude of the repeatability coefficient can also be considered realistic.
The combination of high ICC values with fairly large CV% and r-values may appear contradictory. It is known that a heterogeneous sample yields a higher ICC value compared with a homogenous sample, even if the within-subject variation is the same in both samples (30). Hence, the other aspect of measurement error, expressed as CV% and r, is necessary complementary information on reliability.
The group of participants in this study was heterogeneous with respect to age, sex, time after stroke, and brain lesions. The profile of the components varied considerably across individuals, with most participants having a dominant neural component and few a dominant passive muscle component. This distribution of components is similar to that found in a previous study (13). We therefore consider the sample to be representative of stroke patients in hospitals and outpatient clinics, thus supporting the validity of our results.
In order to allow an easy interpretation of the repeatability coefficient (r) on an individual level Fig. 3 and Table III were created; thus, for example, allowing the clinician to find the limit easily, indicating a real change after an intervention. As an example, this can be applied to an individual patient having a neural component of 20 N. One can expect the person’s expected true value to be somewhere between 9.8 N and 38.3 N for a single measurement. If the intention is to use the NeuroFlexor before and after an intervention for this person, the final assessment would have to be less than 9.8 N for a true reduction, i.e. greater than the expected individual variation. We believe that the magnitude of this variation is reasonable, given the nature of spasticity, since it is known to fluctuate over time. However, it remains to be explored in a clinical setting in relation to a given treatment. It will also be interesting to explore the relationship between the measure and the patient’s and the clinician’s opinion of a successful intervention.
So far, only evidence for validity of measurements for the wrist and hand has been presented, but by applying similar modelling principles it should be possible to adapt the measurements for other joints. The question remains as to whether the method is sensitive enough to detect differences evoked by spasticity-reducing treatments, such as botulinum toxin, and whether it can be used to tailor anti-spasticity treatment to the patient-specific profile of neural and muscular contributions to passive movement resistance. In conclusion, this study has shown that the NeuroFlexor instrument can be used to quantify wrist and finger spasticity in a simple and reliable way.
Acknowledgements
This work was supported by Swedish Foundation for Strategic Research, Berzelii Center Stockholm Brain institute (Vinnova & Swedish Research Council), Strategic Neuroscience Program at Karolinska Institutet, The Health Care Sciences Postgraduate School, Stiftelsen Promobilia and The Swedish Association of Registered Physiotherapists.
The authors would like to thank the staff of the Department of Rehabilitation Medicine, Danderyd University Hospital, for their assistance during data collection.
The method described in this paper has been patented by P. Lindberg and A. Fagergren. “Quantification of mechanical and neural contributions to spasticity” (WO/2008/121067).
Authors J. Gäverth and P. Lindberg own part of the commercial rights of the measurement instrument described in this study as shareholders of the manufacturing company Aggero MedTech AB.
References

