Diana Jackson, PhD1, Paul McCrone, PhD2 and Lynne Turner-Stokes, DM1
From the 1Department of Palliative Care, Policy and Rehabilitation and 2Centre for the Economics of Mental and Physical Health, Health Service and Population Research Department, Institute of Psychiatry, King’s College London, London, UK
OBJECTIVES: To estimate and compare the costs of informal and formal care provided to adults with long term neurological conditions and to identify characteristics associated with these costs.
Design: Cross-sectional postal questionnaire survey.
PARTICIPANTS: Family carers of 282 adults with sudden onset, progressive and stable/intermittent conditions were recruited through UK-wide voluntary organisations and neuroscience centres.
METHODS: Carers provided demographic and condition specific information about the adults cared for. Informal care was measured with the Caregiver Activity Survey and formal service use with the Client Service Receipt Inventory. Costs were calculated and regression analyses identified demographic and clinical characteristics associated with cost.
RESULTS: Annual informal care costs mean £82,620 (standard deviation 58,493) were 4 times higher than formal costs mean £18,117 (standard deviation 28,990). Caring for adults with sudden onset conditions and hidden/mixed impairments were both significantly associated with informal costs. Healthcare costs were significantly associated with having a sudden onset condition, greater dependency in activities of daily living and longer condition duration. Greater dependency was significantly associated with increased social care costs.
CONCLUSIONS: The cost of caring for adults with long term neurological conditions is largely borne by families. Both health and social costs are higher for more dependent patients, endorsing the importance of developing specialist rehabilitation services that reduce dependency.
Key words: healthcare costs; family carers; long term neurological conditions.
J Rehabil Med 2013; 45: 653–661
Correspondence address: Dr. Diana Jackson, Department of Palliative Care, Policy and Rehabilitation, Cicely Saunders Institute, Bessemer Road, Denmark Hill, London SE5 9PJ, UK. E-mail: diana.m.jackson@kcl.ac.uk
Accepted Mar 18, 2013; Epub ahead of print Jun 24, 2013
INTRODUCTION
An estimated 10 million British adults have a long-term neurological condition (LTNC) (1); defined as ‘a condition that results from disease of, injury or damage to the body’s nervous system (i.e. the brain, spinal cord and/or their peripheral nerve connections) which will affect the individual and their family in one way or another for the rest of their life.’(2) These conditions can be grouped into progressive conditions, such as multiple sclerosis or Parkinson’s disease, sudden onset conditions, such as stroke or head injury and stable/intermittent conditions, such as epilepsy.
People with LTNCs typically present with physical and/or cognitive, behavioural, emotional disabilities and have diverse health and social care needs that vary over time. Many are long term users of neurology, primary care and social services. The economic burden of formal care use by these adults is considerable. Estimated UK spending on neurological health services, comprising in-patient and out-patient care delivered by medical and other health professionals, was £2.9 billion in 2009–2010, with £2.4 billion being spent on adult social services, which cover domiciliary care and social support in the community (3).
The cost of informal (unpaid) care is also substantial. Most adults with LTNCs rely on their families for care and support (4–6) and in turn, family carers report fatigue, stress, anxiety and loss of freedom, and have support needs in their own right (7–14). To complement informal care provision and alleviate carer burden, community services such as help with personal care, and day care may be provided. However, in a climate of scarce resources, strict access criteria and means testing, many people needing support ‘fall through the net’ because of inequities in service allocation (15) or for want of staff who understand the needs of adults with complex problems (6, 16).
Given this shortfall, recent UK policy initiatives have called for future services to be designed and delivered more equitably and cost-effectively. In 2005, the National Service Framework (NSF) for LTNCs was launched with a ten year implementation plan and an aim to transform health and social care services for people with LTNCs (2). The current vision is that by 2018 they will have greater choice and control over how external care and support are provided and carers will have access to the integrated and personalised services needed to support their role (17).
While studies have examined UK service use and/or costs in individual LTNCs, including Parkinson’s disease (18), multiple sclerosis (6, 19, 20) and stroke (21–23), formal service use across a wider spectrum of LTNCs, and the extent to which it offsets informal care, has hardly been evaluated. This information is needed to clarify current care provision, inform resource allocation in response to needs (24, 25) and ascertain future service costs.
The aims of this study were to:
1. Estimate and compare the annual costs of informal and formal care provided to a cohort of adults with LTNCs.
2. Identify the demographic, diagnostic and clinical characteristics associated with these costs.
METHODS
Procedure
With approval from Harrow Research Ethics Committee, family carers were recruited through newsletters and websites of national voluntary organisations for LTNCs and in-patient units or out-patient clinics at 17 regional neuroscience centres. This wide-ranging recruitment strategy facilitated a geographically varied sample of carers with diverse experiences of service receipt, carers of adults early after condition onset, who are less likely to join voluntary organisations than those with more advanced disease (20) and carers of adults with rare LTNCs who are under-represented in research. Information sheets were supplied to eligible carers and questionnaires posted to those who gave their contact details to the researchers (thereby indicating their consent to participate).
Participants
To ensure that carers represented those with clear support needs in their own right, entry criteria required them to be spending time every day on their caring responsibilities. Child carers (aged under 18) and carers of children were excluded as these groups warrant study in their own right.
As previous NSFs have addressed the needs of children and older adults, the primary focus of the NSF for LTNCs was on adults of working age (18–65 years). This age range was specified on the carers information sheet. However, given the increasingly flexible age of retirement, and as some older adults had developed LTNCs when they were much younger and their carers wished to participate, some over 65 years (n = 21) were included.
Demographic and clinical data
Data collected included demographics, condition type and duration, and impairments requiring carer support. The Northwick Park Dependency Scale and Care Needs Assessment (NPDS-CNA) (26–28) was used to rate dependency in activities of daily living (ADL). The NPDS is a measure of nursing dependency and special nursing needs that records detailed information on the number of people required to help with a wide range of personal care tasks, as well as the time taken. To allow comparison with studies where the better known Barthel Index (BI) has been used, BI scores were derived from the NPDS using a published algorithm (29).
The NSF classification of progressive, sudden onset and stable/intermittent conditions (30) was used in the analysis and differences were also examined by diagnostic group. Because the severity and combination of physical and/or hidden (communication, behaviour and safety awareness) impairments provide better indicators of support needs than diagnostic labels, and to allow extrapolation of findings to other LTNCs producing similar impairments, adults were categorised into 4 impairment groups based on their NPDS scores.
• A cut-off of 10 on summed NPDS physical items (corresponding to 13 on the BI) classified adults into mild (independent) and moderate/severe (dependent) physical impairments groups.
• Adults needing occasional/no support for NPDS communication, behaviour and safety, items (scoring 0 or 1) were grouped as mild (independent), while those needing frequent support (scoring > 2) for one or more of these items were grouped as moderate/severe (dependent).
The 4 impairment groups comprised: (a) mild (physical and/or hidden), (b) moderate-severe physical, (c) moderate-severe hidden, (d) moderate-severe mixed (physical and hidden) impairments.
Informal care inputs
Informal care time was measured using the Caregiver Activity Survey (CAS) (31). Domains cover grooming, dressing and eating (encompassing personal care), communication, supervision and transport. The time spent on each during a ‘typical 24-h period’ was recorded in time bands and the mean of each was used in the analysis. Ratings were adjusted to give estimated times/week. To ensure coverage of other activities commonly carried out by carers, the time spent per ‘typical week’ was also measured for: administration – dealing with agencies, appointments, financial and legal affairs; therapy and leisure – encouraging exercises, reading and planning outside activities; and psychosocial support – providing reassurance, motivation and problem solving.
As communication and supervision overlap with other activities and can be exceptionally time consuming, the total time spent on caring activities can appear to exceed 24 h/day, reflecting the ’36-h day’ (32). In these cases, daily care time was capped at 24 h (168 h/week).
There are several approaches to valuing informal care time (33). We adopted the replacement cost method where the cost of a paid professional, in this case £18/h of face-to-face weekday contact from a Local Authority home care worker (34) was used as a ‘shadow price’ for informal care.
Formal care inputs
Formal health and social service use was measured with the Client Service Receipt Inventory (CSRI). Service use was estimated from:
• The total number of days receiving in-patient care (in neurology, medical, specialist rehabilitation, other wards).
• The total number of days receiving residential care (in hospices, nursing homes, other settings).
• The mean number of attendences per month receiving non-domiciliary day care.
• The number of out-patient contacts had over the past year with health professionals (general practitioners, practice nurses, therapists, other professionals).
• The mean number of visits per month, and the mean time per visit from domiciliary health and social care professionals (nurses, therapists, social workers, care assistants).
Data were collected retrospectively on service use over the previous year for hospital/residential/day care and per month for home-based care. Pro-rata adjustments were made where home care had been received for only part of the year. For example, if the condition duration was less than one year, or the adult had been an in-patient during the previous year. These data were combined with unit costs from a recognised UK source (34), and total annual service costs computed.
Analysis
Summary descriptive statistics were generated for demographic data and variables relevant to LTNCs using parametric or non-parametric statistics as appropriate. Service use and mean (standard deviation (SD)) costs were generated for: (a) numbers of individuals using each service and (b) the whole sample, irrespective of whether every individual had received each service.
Significant differences in demographics were computed using independent t-tests or analysis of variance with Bonferroni corrections. Associations with time spent on caring activities used Spearman’s correlation coefficients. Predictors of costs were identified using regression models with cost as the dependent variable. These models were constructed by identifying characteristics that were considered from a clinical perspective, to be potentially related to cost, and entering these in a single block. Recruitment source, clinical and demographic characteristics of adults were used as independent variables. Cost data are usually skewed so bootstrapping was used to generate 95% confidence intervals around the regression coefficients.
RESULTS
Of 349 carers requesting questionnaires, 282 (81%) completed and returned them during a 20-month period between November, 2007 and June, 2009. They were widely dispersed across the UK (Fig. 1). While numbers overall were similar by recruitment source, carers of adults with progressive conditions recruited from neuroscience centres outnumbered those from voluntary organisations by 3:2, whereas more carers of adults with sudden onset and stable/intermittent conditions, 4:1 and 3:1, respectively, were recruited from voluntary organisations than neuroscience centres.
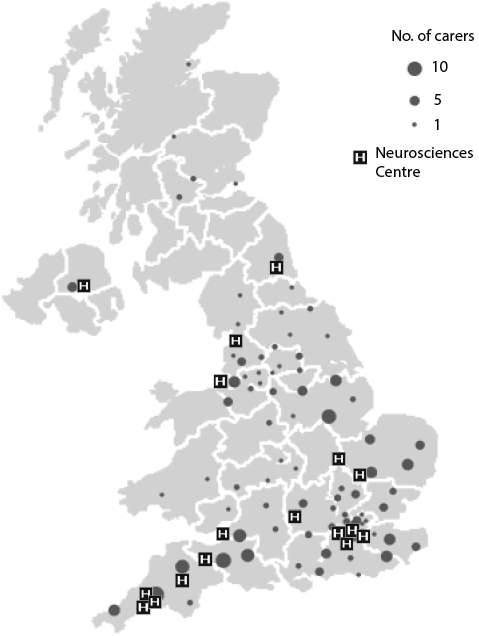
Fig. 1. Distribution of carer participants and neurosciences centres across the UK.
Carers’ ages ranged from 23–82; mean 54.6 years (SD 11.0) and females outnumbered males by 3:2. Most (222/282; 79%) were caring for a spouse/partner, 45/282; 16% cared for a son/ daughter and the rest cared for other relatives. Almost all (260/282; 92%) lived with the adult cared for.
As shown in Table I, adults cared for were fairly evenly divided by gender, with no significant age difference between males and females. However, females were significantly younger than males at condition onset with a mean of 4 years (t = 2.10, p < 0.05), and they had lived with the condition for a mean of 3 years longer than males (t = –2.19, p < 0.05). A range of LTNCs was included, with progressive conditions making up two thirds of the sample. Adults with progressive conditions were significantly older than those with sudden onset conditions by a mean of 12.6 years, and than those with stable/intermittent conditions by a mean of 17.3 years (F = 44.35, p < 0.0001). The progressive group had lived with their condition for a mean of 4 years longer than both sudden onset and stable intermittent groups (F = 3.74, p < 0.05).
|
Table I. Demographic and diagnostic profile of the adults cared for (n = 282) |
|||
|
Males |
Females |
Total group |
|
|
Gender, n (%) |
156 (55.3) |
126 (44.7) |
282 (100) |
|
Age, years, mean (SD) [range] |
51.5 (14.0) [17–85] |
50.4 (13.1) [19–81] |
51.0 (13.6) [17–85] |
|
Age at onset of condition, years, mean (SD) [range] |
41.2 (15.6) [0–81] |
37.3 (14.8) [0–71] |
39.4 (15.3) [0–81] |
|
Time from onset to study, years, mean (SD) [range] |
10.4 (10.1) [0–51] |
13.1 (10.8) [0–55] |
11.6 (10.5) [0–55] |
|
Progressive conditions, n (%) |
|||
|
Multiple sclerosis |
32 (11.3) |
49 (17.4) |
81 (28.7) |
|
Huntington’s disease |
22 (7.8) |
29 (10.3) |
51 (18.1) |
|
Motor neurone disease |
29 (10.3) |
8 (2.8) |
37 (13.1) |
|
Parkinson’s disease |
8 (2.8) |
5 (1.8) |
13 (4.6) |
|
Total |
91 (32.3) |
91 (32.3) |
182 (64.5) |
|
Sudden onset conditions, n (%) |
|||
|
Head injury |
35 (12.4) |
5 (1.8) |
40 (14.2) |
|
Stroke |
6 (2.1) |
11 (3.9) |
17 (6.0) |
|
Brain infections |
11 (3.9) |
7 (2.5) |
18 (6.4) |
|
Hypoxia |
1 (0.35) |
1 (0.35) |
2 (0.7) |
|
Total |
53 (18.8) |
24 (8.5) |
77 (27.3) |
|
Stable or intermittent conditions, n (%) |
|||
|
Epilepsy |
4 (1.4) |
7 (2.5) |
11 (3.9) |
|
Othera |
8 (2.8) |
4 (1.4) |
12 (4.2) |
|
Total |
12 (4.3) |
11 (3.9) |
23 (8.2) |
|
Progressive |
Sudden onset |
Stable/intermittent |
|
|
Age, years, mean (SD) [range] |
55.9 (10.3) [25–85] |
43.3 (14.1) [18–66] |
38.6 (15.2) [17–67] |
|
Time from onset to study, years, mean (SD) [range] |
12.6 (9.9) [0–42] |
8.8 (11.1) [0–55] |
12.5 (11.2) [0–41] |
|
aOther conditions comprised: brain tumours, ataxia, complex regional pain syndrome + dystonia, diabetic neuropathy, muscular dystrophy, myotonic dystrophy, cauda equina syndrome, and two uncertain neurological conditions comprising one ‘brought on by stress’ and one associated with a bi-polar affective disorder. |
|||
Informal care time and costs
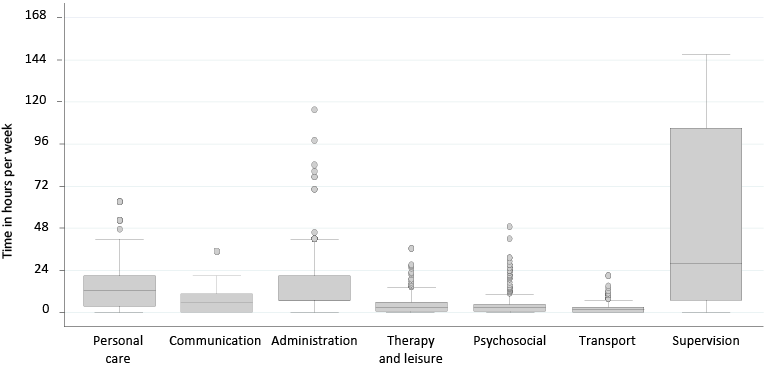
The distribution of total h/day spent caring was positively skewed (median 11; IQR 2–24 h). A quarter of the sample (70/282; 25%) reported caring for 24 h/day, with a further quarter (62/282; 22%) caring for 12–23 h/day. Fig. 2 shows the distribution of h/week that carers spent on CAS domains. Supervision (cited by the majority (237/282; 84%) was most time consuming (median 28; IQR 7–105 h/week), followed by personal care (median 12.3; IQR 3.5–21 h/week), and administration (median 7; IQR 7–21 h/week).
Fig. 2. Distribution of informal care hours per week rated on Caregiver Activity Survey domains. Box plots show median and interquartile ranges
with whiskers indicating 5th and 95th percentiles and outliers above the 95th percentile.
Based on the 2008 standard unit cost of a Local Authority home care worker (34), the mean annual informal care cost for the sample was £82,620 (SD £58,493).
Formal care use and costs
The numbers of adults using each service, the average number of contacts they had during the previous year and the average annual cost per adult using the service were divided into health and social services and sub-divided by professional groups within service types (Table II).
|
Table II. Formal service use and costsa (2007/2008) during the year prior to participation in the study (n = 282) |
|||||
|
Service type |
Service users n (%) |
Contacts Mean (SD) |
Cost per adult using each service, £ Mean (SD) |
||
|
Health servicesb |
|||||
|
Stays in ITU, neurology, medical, rehab and other wards (n = 96) |
|||||
|
In-patient days |
96 (34) |
40 (68) |
21,241 (37,119) |
||
|
Out-patient consultations with one or more health professionals (n = 270) |
|||||
|
General practitioner |
204 (73) |
6.6 (7.6) |
323 (559) |
||
|
Secondary care doctor |
242 (87) |
4.9 (6.3) |
646 (1,576) |
||
|
Dentist |
160 (57) |
2.3 (1.6) |
59 (41) |
||
|
General practice nurse |
119 (42) |
6.8 (13.5) |
142 (245) |
||
|
Nurse specialist |
52 (18) |
2.8 (2.5) |
146 (226) |
||
|
Physiotherapist |
76 (27) |
12.0 (21.0) |
389 (787) |
||
|
Occupational therapist |
44 (16) |
9.7 (21.0) |
356 (881) |
||
|
Speech and language therapist |
43 (15) |
7.4 (20.6) |
276 (844) |
||
|
Psychologist |
28 (10) |
8.8 (23.7) |
641 (1,754) |
||
|
Counsellor |
16 (6) |
7.5 (7.5) |
220 (214) |
||
|
Mental health worker |
5 (2) |
8 (12.4) |
73 (82) |
||
|
Home visits from one or more community health professionals (n = 96) |
|||||
|
General nurse |
55 (20) |
7.9 (18.7) |
2,854 (9,117) |
||
|
Community mental nurse |
7 (3) |
3.3 (5.6) |
2,444 (5,415) |
||
|
Physiotherapist |
47 (17) |
2.8 (3.0) |
1,070 (1,287) |
||
|
Occupational therapist |
63 (22) |
30.5 (42.6) |
1,023 (1,714) |
||
|
Speech and language therapist |
35 (12) |
26.5 (32.7) |
760 (810) |
||
|
Social servicesc |
|||||
|
Residential care and/or day care in hospitals/day centres (n = 103) |
|||||
|
Residential care (days) |
51 (18) |
35 (51) |
3,670 (5,312) |
||
|
Day care |
81 (29) |
6.4 (5.3) |
6,715 (5,539) |
||
|
Home-based visits from one or more social care staff (n = 127) |
|||||
|
Social worker |
61 (22) |
27 (48) |
2,776 (3,454) |
||
|
Personal care assistant |
64 (23) |
496 (397) |
13,172 (15,964) |
||
|
Domestic help |
44 (16) |
83 (89) |
4,228 (5,211) |
||
|
Day sitting service |
37 (13) |
97 (84) |
10,525 (15,841) |
||
|
Night sitting service |
5 (2) |
185 (128) |
40,958 (25,079) |
||
|
aExchange rates based on Purchasing Power Parities for 2008: £1 = 1.24 Euros, 1.54 US dollars. bMean (SD) total health service costs were £9,368 (24,975). cMean (SD) total social service costs were £8,496 (15,822). SD: standard deviation; ITU: intensive treatment unit. |
|||||
One third had in-patient treatment, accounting for nearly half (46%) of formal service costs. Just under 20% had stayed in a residential setting accounting for 4% of costs, and 19 (7%) had stayed in both types of setting during the previous year.
Out-patient and primary healthcare services were used by most cases and yet these services accounted for only a small proportion of total formal care costs. Three quarters had contact with their general practitioner, but as the cost of these consultations is small, this accounted for only 1% of costs. Nearly all had seen secondary care doctors, accounting for 4% of costs. While fewer adults (just over half) had contact with nurses and/or therapists, the mean number of contacts respectively (40/year) was the highest for these professional groups, and these each accounted for 4% of formal care costs.
Day care services were used by just under one third of adults (n = 81) accounting for 12% of formal care costs. Some attended day centres run by social services (n = 26) or voluntary organisations (n = 23), while others received palliative care (n = 9), rehabilitation (n = 7), day hospital care (n = 6) or educational/vocational services (n = 10). Almost half received home-based services. Personal home care contacts were high, averaging almost 10/week for those receiving them. The highest per capita costs were for night-sitting and day-sitting services.
Comparisons between informal and formal care use and costs
Table III presents a breakdown of ranges and mean (SD) annual costs of informal and formal care inputs across the sample. As in Table II, formal care costs are presented by professional groups within service types. In contrast to the mean annual informal care cost of £82,620, the mean annual formal care cost was £18,117, amounting to just 18% of total care costs, and indicating the substantial burden of care borne by family carers.
|
Table III. Annual costsa of informal care and formal health and social care by service type provided to adults with long-term neurological conditions (n = 282) |
||
|
Range, £ |
Mean, £ (SD) |
|
|
Informal care domains |
|
|
|
Personal care |
0–59,130 |
13,031 (11,036) |
|
Communication |
0–26,280 |
6,937 (8,059) |
|
Administration |
0–10,353 |
1,793 (1,707) |
|
Therapy/leisure |
0–46,908 |
5,114 (6,979) |
|
Psychosocial |
0–68,328 |
5,935 (9,531) |
|
Transport |
0–28,080 |
2,077 (2,843) |
|
Supervision |
0–137,970 |
48,655 (45,269) |
|
Total informal care costs |
468–157,680 |
82,620 (58,493) |
|
Formal care |
|
|
|
Health services |
||
|
In-patient health care |
0–177,755 |
7,231 (23,822) |
|
Out-patient health care |
0–25,618 |
1,203 (2,306) |
|
Home-based health care |
0–14,688 |
739 (1,755) |
|
Primary care doctorsb |
0–5,400 |
235 (497) |
|
Secondary care doctorsb |
0–19,560 |
565 (1,489) |
|
Dental surgeonsb |
0–300 |
33 (42) |
|
General/special nursesb,c |
0–6,500 |
227 (648) |
|
Therapists: PT, OT, SALTb,c |
0–16,128 |
728 (1,712) |
|
Mental health professionalsb,c |
0–14,688 |
152 (1,055) |
|
Total |
0–180,333 |
9,368 (24,975) |
|
Social services |
||
|
Day care |
0–22,968 |
1,929 (4,243) |
|
Residential care |
0–35,756 |
664 (2,650) |
|
Home-based social care |
0–129,996 |
6,072 (14,526) |
|
Social workersd |
0–16,560 |
605 (1,971) |
|
Care assistantsd |
0–82,800 |
3,011 (9,394) |
|
Domestic helpd |
0–23,040 |
660 (2,553) |
|
Day/night sittersd |
0–115,920 |
2,107 (10,655) |
|
Total |
0–129,996 |
8,496 (15,822) |
|
Total formal care costs |
0–180,885 |
18,117 (28,990) |
|
aExchange rates based on Purchasing Power Parities for 2008: £1 = 1.24 Euros, 1.54 US dollars. bProfessionals included in out-patient health care costs. cProfessionals included in home-based health care costs. dProfessionals included in home-based social care costs. SD: standard deviation; PT: physical therapist; OT: occupational therapist; SALT: speech and language therapist. |
||
The notably higher cost of informal care as compared to formal care ranged widely but held across every diagnostic group (Table IV). Except for the two adults with hypoxic brain damage, the greatest difference in costs occurred in adults with Parkinson’s disease and the smallest in adults with brain infections.
|
Table IV. Mean annual service costsa in 2007/2008 by demographic and clinical characteristics (n = 282) |
||||
|
Characteristic |
n |
Informal care costsb Mean (SD) |
Healthcare costs Mean (SD) |
Social care costs Mean (SD) |
|
Gender |
||||
|
Male |
156 |
82,735 (58,981) |
11,025 (29,640) |
7,375 (15,547) |
|
Female |
126 |
82,477 (58,123) |
7,417 (17,927) |
9,881 (16,111) |
|
Age group |
||||
|
17–29 years |
27 |
88,757 (63,618) |
29,865 (49,716) |
6,293 (10,620) |
|
30–39 years |
33 |
81,445 (62,817) |
11,814 (28,300) |
10,046 (19,170) |
|
40–49 years |
57 |
74,552 (57,525) |
9,348 (24,233) |
8,228 (18,279) |
|
50–59 years |
79 |
79,532 (57,667) |
3,817 (8,817) |
9,407 (17,426) |
|
60–69 years |
74 |
91,148 (55,920) |
6,525 (19,052) |
8,986 (12,870) |
|
> 70 years |
12 |
76,998 (64,711) |
6,996 (8,937) |
1,503 (2,747) |
|
Duration of condition |
||||
|
< 2 years |
45 |
65,694 (55,268) |
24,866 (42,781) |
5,515 (10,573) |
|
2–5 years |
68 |
82,215 (62,142) |
11,352 (24,363) |
7,542 (18,885) |
|
6–10 years |
55 |
76,833 (56,182) |
6,715 (24,495) |
7,794 (17,736) |
|
11–19 years |
61 |
93,192 (58,125) |
3,160 (7,312) |
9.389 (14,196) |
|
> 20 years |
53 |
91,627 (57,300) |
3,460 (7,315) |
11,934 (14,890) |
|
Recruitment source |
||||
|
Neurosciences centre |
138 |
72,720 (58,671) |
9,022 (24,918) |
5,678 (14,988) |
|
Voluntary centre |
144 |
91,954 (56,970) |
9,694 (25,115) |
11,293 (16,182) |
|
NSF group |
||||
|
Progressive |
182 |
79,588 (57,213) |
3,888 (6,835) |
9,461 (18,038) |
|
Sudden onset |
77 |
94,202 (58,210) |
20,536 (40,792) |
8,170 (11,406) |
|
Stable/intermittent |
23 |
68,421 (65,408) |
13,628 (30,828) |
2,123 (5,174) |
|
Diagnosis |
||||
|
Head injury |
40 |
95,699 (55,640) |
14,341 (28,395) |
6,929 (8,606) |
|
Brain infection |
17 |
92,015 (57,503) |
31,935 (59,334) |
11,257 (11,254) |
|
Stroke |
18 |
84,944 (66,937) |
24,354 (43,114) |
8,647 (16,730) |
|
Hypoxia |
2 |
157,680 (0) |
6,280 (8,881) |
2,088 (2,953) |
|
Multiple sclerosis |
81 |
85,676 (56,131) |
5,079 (8,773) |
14,689 (19,747) |
|
Huntington’s disease |
51 |
84,289 (57,414) |
2,421 (5,367) |
4,444 (6,564) |
|
Motor neurone disease |
37 |
62,843 (59,687) |
4,126 (4,545) |
9,095 (25,043) |
|
Parkinson’s disease |
13 |
71,863 (52,265) |
2,086 (1,679) |
1,443 (4,580) |
|
Epilepsy |
11 |
71,257 (67,719) |
4,659 (8,746) |
0 (0) |
|
Other |
12 |
65,821 (66,121) |
22,598 (41,741) |
4,070 (6,701) |
|
Impairment |
||||
|
Mild |
72 |
38,164 (38,510) |
4,914 (15,989) |
2,041 (4,800) |
|
Physical |
55 |
68,896 (49,634) |
14,375 (30,550) |
10,244 (18,650) |
|
Hidden |
51 |
67,971 (56,586) |
12,539 (34,717) |
3,478 (6,124) |
|
Mixed |
104 |
128,172 (42,434) |
8,159 (20,238) |
14,643 (19,731) |
|
aExchange rates based on Purchasing Power Parities for 2008: £1 = 1.24 Euros, 1.54 US dollars. bInformal care costs represent the estimated savings to the State that are provided by family carers. SD: standard deviation. |
||||
Comparisons between health and social care costs
Health and social care costs were similar across the sample, with the former being just 10% higher than the latter. However, further breakdown revealed that in progressive conditions, social care costs (mean £9,461, (SD £18,038)) were significantly greater than healthcare costs (mean £3,888, (SD £6,835); t = –3.83, p < 0.001). This was largely explained by adults with multiple sclerosis, for whom the mean cost of social care (mean £14,689 (SD £19,747)) was 3 times higher than healthcare costs (mean £5,079 (SD £8,773); t = –3.71, p < 0.001), and to a lesser extent by adults with other progressive conditions, though the differences were not statistically significant.
In contrast, formal healthcare costs in sudden onset conditions (mean £20,536 (SD £40,792)) were significantly greater than social care costs (mean £8,170 (SD £11,406); t = 2.466, p < 0.05). A reason for this was the high in-patient costs incurred by some adults. No significant differences were found between health and social care costs in stable/intermittent conditions. Table IV gives a breakdown of mean annual service costs of informal care, healthcare and social care by demographic and clinical characteristics and illustrates these findings.
By far the highest cost burden for in-patient and/or residential care was taken up by a small number of adults in the youngest (17–29 years) age group, representing just 6% of the cohort. Most had sudden onset conditions, head injuries (n = 10) and encephalitis (n = 3), with the remaining 3 having intermittent conditions, epilepsy (n = 2) and complex regional pain syndrome with dystonia (n = 1). Their average length of in-patient stay was three months; markedly longer than for those in other age bands, which averaged 2 to 8 weeks. Just under half (n = 6, 43%) of the 14 receiving in-patient care were within two years of condition onset.
In contrast, the greatest numbers of adults receiving in- patient and/or residential care were those with progressive conditions in the 50–59 and 60–69 age groups. Half (47/96; 50%) had in-patient care (36 progressive) and two-thirds (33/51; 65%) residential care (30 progressive). The mean time in hospital (not necessarily in one stay) was 3 weeks for those aged 50–59 years and 5 weeks for those aged 60–69 years, thus the cost of care was low compared to that of the younger groups in age bands 17–29 and 30–39. The 19 adults who had stayed in both types of setting were also older, with ages ranging from 37–70 years, mean 55 years (SD 8.8). Of these, 16 (84%) had progressive conditions; multiple sclerosis (n = 12), Huntington’s disease (n = 3) and Parkinson’s disease (n = 1), and had lived with their condition for 3–38 years; mean 16.3 years (SD 9.9).
Predictors of the costs of caring
Table V shows the regression models for costs relating to informal care, formal healthcare and formal social care, respectively. Informal care costs were significantly higher if the adult cared for had a sudden onset condition as compared to a progressive one, and if they had hidden or mixed impairments, reflecting the need for supervision in these groups. This model explained 41% of the variation in informal care costs.
|
Table V. Regression models for costsa relating to informal care, formal healthcare and formal social care (2007/8 £s) |
|
|||||||
|
Variable |
Informal care costs |
Healthcare costs |
Social care costs |
|||||
|
Coefficient |
95% CI |
Coefficient |
95% CI |
Coefficient |
95% CI |
|||
|
Recruitment source |
||||||||
|
Voluntary organisationsb |
3,020 |
–10,846 to 15,772 |
–6,982 |
–14,326 to 82 |
2,973 |
–1,302 to 7,771 |
||
|
Gender |
||||||||
|
Malec |
–3,935 |
–14,988 to 7,270 |
–1,915 |
–6,993 to 2,782 |
1,392 |
–2,412 to 5,156 |
||
|
Age |
28 |
–464 to 442 |
–283 |
–607 to 54 |
–77 |
–240 to 75 |
||
|
Duration of condition |
71 |
–537 to 727 |
–348* |
–579 to –132 |
67 |
–89 to 236 |
||
|
Barthel Index |
–1,479 |
–3,414 to 287 |
–1,479* |
–2,762 to –337 |
–1,292* |
–1,922 to –710 |
||
|
NSF condition group |
||||||||
|
Sudden onsetd |
18,654* |
1,427 to 35,196 |
21,042* |
11,119 to 33,440 |
1,682 |
–2,353 to 5,439 |
||
|
Stable/intermittentd |
9,642 |
–9,038 to 28,516 |
10,616 |
–696 to 23,436 |
–3,364 |
–8,778 to 1,381 |
||
|
Impairment group |
||||||||
|
Physicale |
18,110 |
–6,434 to 41,032 |
2,391 |
–9,490 to 14,087 |
–4,347 |
–11,198 to 3,072 |
||
|
Hiddene |
23,226* |
5,408 to 42,251 |
598 |
–9,434 to 10,772 |
–302 |
–2,883 to 2,288 |
||
|
Mixede |
71,901* |
46,464 to 95,315 |
–10,103 |
–23,141 to 1,114 |
–3,068 |
–8,764 to 3,613 |
||
|
Adjusted R2 |
0.41 |
0.21 |
0.21 |
|||||
|
*p < 0.05. aExchange rates based on Purchasing Power Parities for 2008: £1 = 1.24 Euros, 1.54 US dollars. bCompared to neuroscience centres, cfemales, dprogressive conditions and emild impairments. The coefficient is the value for predicting the dependent variable from the independent variable. R2 is the proportion of variance in the dependent variable which can be explained by the independent variables and is adjusted to allow for extraneous predictors to the model. CI: confidence interval. |
||||||||
Healthcare costs were also significantly higher if the adult cared for had a sudden onset condition as compared to a progressive one. Costs related to ADL dependency; each point increase in BI score (indicating greater independence) reducing healthcare costs by £1,479. The time between onset of the condition and recruitment to the study was inversely related to healthcare cost, with each additional year reducing costs on average by £348. This model explained 21% of the variation in healthcare costs.
Finally, social care costs were associated with ADL dependency; each point increase in BI score being related to a mean reduction in costs of £1,292. This model explained 21% of the variation in social care costs.
DISCUSSION
To our knowledge, this paper is the first to estimate and compare the annual costs of both informal care provision and formal health and social care services used by adults with LTNCs in the UK. Data were collected in a ‘bottom up’ study of individual patient-level data, and the strength of this methodology is that costs can be related to specific patient groups and compared across demographic and diagnostic variables. The adults in our sample covered nine diagnostic conditions grouped into NSF categories of progressive, sudden onset and stable/intermittent. As evidenced by the considerable number with mixed physical and hidden impairments and long condition durations, many had multiple complex problems, and were long term users of health and social services.
Informal care was predominantly provided by co-resident family carers, the majority of whom cared for a spouse/partner. When valued using the replacement cost of a home care worker, who would be the most likely professional to take over were the caring relationship to break down, the average annual cost accounted for 82% of total costs, with formal health and social care costs making up the remaining 18%. This is in line with informal care estimates of 80% in Parkinson’s disease (18), 73% in stroke (35) and 64–71% (dependent on disease severity) in multiple sclerosis (19).
Conversely, Saka et al. (21) attributed just 27% of the costs of stroke in the UK to informal care. However, their formal costs evaluation included diagnostic and pharmacological costs, lost income through morbidity and mortality, and lost productivity and benefit payments, which may explain the lower proportion of total costs made up by informal care in their study. Making further comparisons between our findings and the wider literature on service costs in LTNCs is confounded by methodological differences like these, and also by differences in healthcare systems cross-nationally.
Nonetheless, our findings may underestimate the true proportion of care borne by families since it is social care inputs, for example the personal care, sitting services and day care provided by paid care assistants, rather than healthcare services, that offset what carers themselves do every day. When health costs were excluded, informal care inputs made up more than 91% of everyday care costs, with just 9% being provided by social care services to offset that provided by families. It should, though, be noted that the carers who participated in this study had been selected because they were spending time every day on their caring responsibilities. They were therefore likely to represent those at the higher end of the scale in terms of the care they provided.
There was considerable diversity in formal service use and costs across the sample, with some services being used by almost all the adults while others were used by only a few but intensively so. In line with studies of Parkinson’s disease (18) and stroke (22), out-patient and primary healthcare services were used by most adults and absorbed the least formal costs. Three-quarters had regular contact with general practitioners and most saw one or more secondary care doctors several times a year. In contrast, rather fewer had contact with nurses and/or therapists and only a handful with psychologists or counsellors. While fewer adults used social care services, contacts were considerably higher, reflecting the regular personal care inputs received by about a quarter of the sample and the domestic support and sitting services received by others.
A number of variables impacted on cost patterns and predictors of costs. Prominent among them were NSF group, impairment group, dependency on others for ADL support, the age of the adult cared for and LTNC duration. Having a sudden onset condition with hidden or mixed impairments explained 41% of informal care costs. A likely cause was the prevalence of safety and/or behavioural problems requiring constant supervision and endorsing findings in a study of stroke patients, in which over 70% of carers reported spending ‘all day and night’ or ‘all day’ caring (22).
We found some notable differences in formal costs by NSF group over time. The greatest healthcare costs appeared to be due to in-patient care early after onset for a few younger adults with sudden onset and intermittent conditions. Indeed, healthcare costs could be explained by having a sudden onset condition, its duration (costs reducing as time went by) and a lessening of dependency on others for ADL support. Social care costs, however, increased over time for this group and a much greater proportion of responsibility for providing care was borne by family carers. In contrast, a sizeable number of older adults with progressive conditions used in-patient and/or residential care services for shorter periods of time later on in their disease trajectory, resulting in lower per capita costs. Social care costs were significantly higher than healthcare costs in this group.
Both health and social care costs increased in line with increasing dependency, reflecting findings from a study of Belgian community dwelling adults with multiple sclerosis, for whom medical costs increased with disability (36), and an examination of service use and costs in stroke, which found that costs were associated with severity of disability and time since stroke onset (22). As it is not known how many adults in this study were deteriorating over time, nor how many of the services they received were targeted to their rehabilitation needs, the reasons for this relationship remain uncertain. However, if reducing dependency can mitigate service costs in the longer term, and as current evidence highlights the importance of timely access to integrated health and community services as key to maintaining independence and well-being (37), increasing access to specialist rehabilitation and aftercare in community settings could be a worthwhile investment.
There were several limitations to this study. While carers were recruited nationally, and had diverse experiences of service receipt, they were not necessarily representative of all carers of adults with LTNCs. On the other hand, recruitment criteria required them to be spending time every day on their caring role, so the findings are likely to reflect experiences of providing care to adults with the greatest needs for support. Further work is needed to confirm our findings.
Service use was measured using recall by carers and possibly the adults cared for too. This was necessary to obtain data on the breadth of information required, but needs to be considered as a limitation due to potentially compromised recall bias, given the need to recollect the number and duration of services used over the previous year. Previous studies have, though, found self-report of service use to be a reasonable method (20–22).
The formal health care costs analysed in this study were restricted to service costs and did not include other direct costs, such as medication, equipment or home adaptations, which is a limitation. It would be useful to include these costs in future studies.
Finally, we did not take into consideration activities such as employment foregone by carers in order to take on a caring role. A number of difficulties are associated with this, including the need to make judgments about how carers might spend their time had they not taken on a caring role. Given that carers spanned both working-age and retired groups, and the high proportion of females, who may have given up work for reasons other than caring, we could not have given an accurate picture of lost opportunity costs. Nonetheless, a quarter of the adults cared for needed care 24 h 7 days a week, with another quarter needing care for 12–23 h/day. Opportunities for their carers to work and/or participate in activities outside their caring role are therefore likely to have been severely curtailed.
In conclusion, building capacity in staffing and the development of high quality services for people with LTNCs were identified as key areas for implementation in the NSF for LTNCs (2). This paper provides a baseline of service use and costs across a sizeable sample of adults with a range of LTNCs and impairment types. Findings will increase knowledge of the burden of care borne by informal family carers, as well as the costs of formal health and social care services currently used by these adults. They will inform the potential cost of future service development to provide timely and continued support in answer to needs. It was beyond the scope of this study to examine unmet service needs in this group, but research of this kind that includes costing potential service use is now needed.
ACKNOWLEDGEMENTS
The authors wish to thank all the carers who participated in this study. Their contributions were greatly appreciated given the demands on their time and the difficult circumstances many were living in. Thanks are also due to the following national voluntary organisations for assistance with recruitment: Headway, Encephalitis Society, Epilepsy Action, MS Society, Motor Neurone Disease Association, Huntington’s Disease Association, and to clinicians and research nurses who facilitated recruitment at seventeen UK neuroscience centres. Members of our Lay Project Advisory Panel: Nancy Esterson, Savita Jain, Norman Keen, Martin McLeish, Mary Porter and Caryl Reeves guided the study throughout. Jo Clark, Deirdre Howley and Alistair Price assisted with data collection and administration.
This paper presents independent research commissioned and funded by the Department of Health Policy Research Programme. The views expressed are those of the authors and not necessarily those of the Department of Health. We are grateful to the Dunhill Medical Trust for on-going financial support.
REFERENCES

