Sanne W. T. Frazer, MSc1,2, Willem E. H. Hellebrand, PT3 and Noël L. W. Keijsers, PhD1
From the 1Department of Research, Sint Maartenskliniek, 2Department of Language and Speech, Faculty of Arts,
Centre for Language and Speech Technology, Radboud University Nijmegen and 3Department of Rehabilitation,
Sint Maartenskliniek, Nijmegen, The Netherlands
OBJECTIVES: To measure the variation in activity parameters
in patients with stroke over several days, and to assess whether patients with chronic stroke differ from each other in their achievement of ambulatory activity level.
DESIGN: Descriptive study.
METHODS: A total of 14 patients with chronic stroke wore 2 tri-axial accelerometers in their pockets for 7 consecutive days. The mean and standard deviation of activity parameters (duration of activity in minutes, and length and number of bouts of activity) were assessed across days. Outcome parameters were divided into morning, afternoon and evening, in order to assess the activity pattern.
RESULTS: The total group had a mean activity time of 54 min and standard deviation of 23 min over several days (range 5–45 min). Inactive participants had a significantly lower mean number of activity bouts, but no clear difference in length of bouts. Although activity level decreased during the day for the total group, only 4 participants showed a significant difference between periods of the day.
CONCLUSION: A high level of variation in activity parameters over several days indicates the importance of measuring multiple days when assessing a patient’s ambulatory activity level. Moreover, individual differences between patients indicate the importance of tailored advice in promoting their level of physical activity.
Key words: stroke; accelerometers; individual variation; physical activity.
J Rehabil Med 2013; 45: 00–00
Correspondence address: S. W. T. Frazer, Department of Research, Sint Maartenskliniek, PO Box 9011, NL-6500 GM
Nijmegen, The Netherlands. E-mail: s.frazer@maartenskliniek.nl
Accepted Apr 8, 2013; Epub ahead of print Jul 4, 2013
Introduction
Motor impairment due to stroke can lead to restrictions in daily activities by affecting muscle movement and mobility (1). Several studies have shown that the activity level of patients with chronic stroke is low (mean range 1,389–6,428 steps/day (2–8)), compared with an older healthy population (2,015–8,939 steps/day (9)). As a result, patients with stroke are at greater risk of inactivity (7, 10), which can lead other health problems, such as cardiovascular deconditioning, muscle loss, obesity, and/or diabetes. Physical inactivity can be a problem, because a major goal for patients with stroke is to return home and live independently (3), which requires a certain level of sensorimotor function and aerobic capacity. Moreover, being more active also reduces the risk of another stroke (11). Because of the wide range of (in)activity, and since even a small increase in physical activity will lead to higher benefits (12), a therapist should focus on a patients’ individual activity level in order to give optimal tailored advice. Furthermore, this advice should consider promoting physical activity mainly by increasing normal daily ambulatory tasks (3, 5, 11).
Tailored advice can be beneficial in promoting physical activity level. Not only the total activity time during a day is important, but also how a person achieves this total activity time. If, for example, an individual is most active in the morning and sedentary during the rest of the day, they could be advised to focus on increasing activity time during the afternoon. In addition, the number of bouts of exercise and their length will provide usable information and can indicate deficits in initiation of activity or walking (7, 13). In addition, it is important to take posture into account when increasing the activity level of a patient with chronic stroke. For example, standing may be a difficult posture, requiring extra energy for this patient group. To monitor the above-mentioned factors in order to provide optimal tailored advice, objective measurement tools, such as accelerometers, will be optimal (13–16).
In addition to objective measurement tools, tailored advice is only beneficial when patients with chronic stroke differ among each other in how they achieve their activity level. Moreover, to indicate differences between patients, not only the mean of activity parameters, but also the variation between days in activity parameters is important. Therefore, activity parameters should be measured for multiple days. Although patients with chronic stroke have been measured with accelerometers in several studies (2, 3, 6, 7, 17, 18), they were measured for a maximum of only 3 days, and mainly total activity levels were presented. As a result, it is not known whether there are statistical differences in the achievement of activity level among patients with chronic stroke.
The purposes of this study was: (i) to assess the variation in activity parameters (such as activity level, activity pattern, and number and length of bouts of exercise) in patients with stroke across days; and (ii) to determine if patients with chronic stroke differ from each other in how they achieve their ambulatory activity level. Measurements of periods of multiple days was used to determine statistical differences between activity parameters and periods of the day.
Methods
Participants
A total of 17 participants gave written informed consent to participate in this study, which was approved by the local institutional review board. Participant characteristics were assessed with a questionnaire. The participants were at least 12 months post-stroke and had mild-to-moderate hemiparetic deficits (see Table I for participant characteristics). Participants who were unable to walk more than 10 m were excluded. Other exclusion criteria were: heart failure, major cognitive problems, aphasia, and other conditions that would influence physical/ambulatory condition.
|
Table I. Characteristics of the participants |
|
|
Variable |
Sample (n = 14) |
|
Age, years, mean (SD) |
61 (6) |
|
Gender, female/male, n |
2/12 |
|
Post-stroke, months, mean (SD) |
43 (36) |
|
Hemiparetic side, right/left, n |
5/9 |
|
Walking aid, no aids/cane or crutch, n |
7/7 |
|
Physical therapy, no/yes, n |
3/11 |
|
Participate in sport activities*, no/yes, n |
4/10 |
|
*The most common sport activities are group fitness (5) and swimming (5), followed by individual fitness (4) and walking (2). |
|
Data acquisition
Activity level was recorded with 2 DynaPort MiniMod tri-axial acceleration sensors (62×41×18 mm, 53 g). The sensor signals were stored on a secure data card with a sampling frequency of 100 Hz. The sensors were worn by the participants in their left and right trouser pockets. Participants wore their normal clothes, and a clip secured the sensors in the pockets. Participants were asked to wear the sensors during waking hours and to write down the start and end time of wearing them. The sensors are not waterproof; when having a shower or going for a swim, the participants did not wear them, but instead wrote down the duration of these activities without turning off the sensors. The only instruction given was to continue their normal daily routine during the measurements. Participants wore the sensors for 1 week. However, some days were not completely recorded during the week, due to technical malfunction of the sensor, or to the participant forgetting to put the sensors in the pocket during part of the day. For a good overview of the week, a minimum of 5 complete days was necessary to continue with the analysis. Incomplete days were not used.
Data analysis
The data captured on the secure data card were processed with custom-written Matlab programs. Per second, the data was automatically classified into 1 of 3 groups: sitting, standing, and active. Because of possible misclassification by the current method, a Matlab program was used to visually inspect the classification and to manually adapt and correct misclassifications. To indicate the performance of the automatic classification, the percentage of data that did not need correction was calculated.
Based on the classification of the accelerometers in sitting, standing, and activity for each second, various parameters were calculated (Table II). The first parameters were standing, activity, and sitting time per day. Subsequently, the number of transitions per day was calculated. Transitions were defined as a change from a sitting position to a standing position or vice versa. Finally, the number and length of activity bouts were assessed. An activity bout was defined as continuous activity of at least 4 s, measured in seconds. For each activity parameter, the mean and standard deviation (SD) over the period of days were calculated. To express the pattern of activities during the day, the activity parameters were also calculated for 3 separate periods of the day: morning (from the time the subject started wearing the sensors until 12.30 h), afternoon (from 12.30 h to 17.30 h) and evening (from 17.30 h to the end of wearing the sensors). Due to differences in the start and end times, the periods of measurement for morning, afternoon and evening sessions were not equal. Therefore, the activity parameters for the different periods of the day were divided by the measurement time for that particular period, expect for the parameter length of bouts, as measurement time has no influence on this parameter.
|
Table II. Definitions of activity parameters measured; these parameters are calculated for the total day and for the 3 periods of the day |
|
|
Activity parameter |
|
|
Activity time |
Total min of activity per day |
|
Standing time |
Total min of standing per day |
|
Sitting time |
Total min of sitting per day |
|
Number of transitions |
Count of changes between standing and sitting or vice versa |
|
Number of activity bouts |
Counts of periods of activity of at least 4 s |
|
Length of activity bouts |
Duration of activity bouts (in s) |
Statistical analysis
One-way analysis of variance (ANOVA) tests were used to express the differences in the activity parameters between patients. Unpaired t-tests without Bonferroni correction were used to indicate which participants were different from each other. The percentage of comparison that was significantly different was calculated. Number and length of bouts can be seen as a combined parameter. Therefore, the percentage of participant comparisons in which either the number or the length of bouts was significantly different was also calculated.
To determine the differences between periods of the day, a one-way repeated measures ANOVA was used. Individual differences between periods of the day were also determined with a one-way repeated measures ANOVA. The level of significance was set at 0.05. Post-hoc Bonferroni tests were used to indicate which participants differ and which periods of the day were significantly different from each other.
Results
Of the included 17 participants, 3 were excluded because fewer than 5 complete days’ data were collected during the measurement week. The mean age of the 14 remaining competing participants was 61 years (SD 6); and the mean interval following stroke was 42 months (SD 36). Participant characteristics are presented in Table I.
The participants were measured for a mean of 6.1 days (SD 0.9), for a mean of 12.5 h (SD 1.6) per day. For 90% of the data, the automatic classification data was not manually corrected. Automatic misclassification occurred for the following main reasons: lack of consensus between the 2 sensors, the orientation of 1 of the sensors was changed in the pocket, or the person was extremely inactive or moved very slowly when active.
The participants spend a mean of 589 min (SD 92.8) of their day sitting. Of the remaining time, the group had a mean standing time of 115 min (SD 61) and a mean activity time of 54 min (SD 33). Fig. 1 shows the mean duration and SD for standing and activity for each participant. The one-way ANOVA revealed a significant difference in activity time (F(13,72) = 11.21, p < 0.001) and standing time (F(13,72) = 8.01, p < 0.001) among the participants. Post hoc testing with Bonferroni correction showed that participants 12–14 were significantly more inactive and stood less than the 7 most active participants (1–7). The 3 inactive participants had an activity duration that was less than 10 min and stood for only approximately 50 min a day, whereas the 7 most active participants had at least 58 activity min and 80 min of standing. The 3 inactive persons did not differ among age, onset of stroke, and physical therapy compared with the other participants, but they all used a walking aid and used a wheelchair for long distances. Participant comparisons without Bonferroni correction showed that 53.9% of the comparisons were significantly different for activity time and 48.4% for standing time. The SD over several days was large between the participants; ranging between 5 and 45 min for activity time and between 11 and 108 min for standing time (with an outlier of 203 min for participant 4).
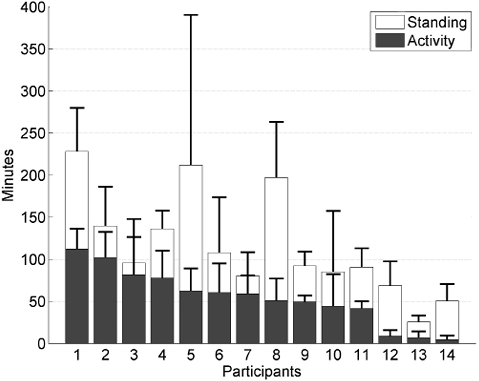
Fig. 1. Mean and standard deviation of activity time (grey bars) and standing (white bars) time per participant.
Accumulation of ambulatory activity
The number of transitions during a day ranged from 29 to 95 among the 14 participants. For the total group, the activity time of 54 min was accumulated by a mean number of bouts of 197 (SD 109) and a mean length of 16 s per bout/day (SD 5). Fig. 2 shows the relationship between number of bouts and their length for each individual participant. The one-way ANOVA revealed significant differences in number of bouts (F(13,72) = 7.15, p < 0.001) and length of bouts (F(13,72) = 4.29, p < 0.001) among the participants. The comparison between the participants without Bonferroni correction were for 48.3% significantly different for number of bouts, 36.3% for the length of bouts, and for 62.6% in either number or length of bouts. The 3 mostly inactive subjects (3 data-points on the left) differ mainly from the other participants in the number of bouts. In addition, they had a small variation in number of bouts during the day. In contrast, the more active participants show a relatively high SD in number of bouts. Fig. 2 also shows that participants clearly differ in the way they distribute their activities. The participants represented by the 3 upper data-points have longer, but fewer, activity bouts compared with the participants represented by the data-points on the middle right side. In agreement with the number of bouts, the number of transitions depends on the mean activity time. The inactive participants (12–14) made only a small number of transitions and made almost the same number of transitions as number of bouts; the mean ratio was 0.98 (SD 0.14), whereas the ratio for the other participants was 3.9 (SD 1.3).
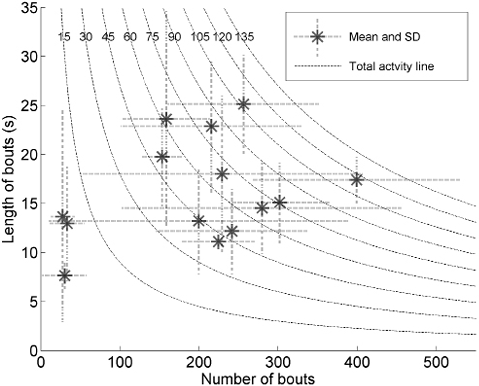
Fig. 2. Relationship between number of bouts and their length (in s) per participant. The dashed line indicates the total activity (in min) (number of bouts multiplied by length of bouts). The dotted lines at each data-point indicate the standard deviation (SD) in length of bouts (vertical) and number of bouts (horizontal) across days.
Daily pattern of ambulatory activity
Mean measurement times per day were 3.18 h (SD 1.03) for the morning, 4.85 h (SD 0.19) for the afternoon, and 4.90 h (SD 1.00) for the evening. The activity parameters per hour for the 3 periods of the day are shown in Fig. 3. Repeated measures ANOVAs revealed that standing time F(13,2) = 23.1, p < 0.001, activity time F(13,2) = 5.9, p = 0.008, number of bouts F(13,2) = 17.4, p = 0.00 and transitions F(13,2) = 12.4, p = 0.0002 were significantly different. Post hoc analysis revealed that the evening was significantly different from the morning and the afternoon for all 4 parameters and, furthermore, that morning and afternoon differ significantly for standing time (Fig. 3). However, the bout length did not differ significantly (F(13,2) = 0.53 p = 0.59).
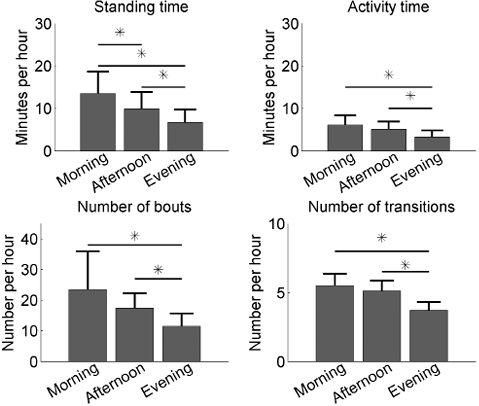
Fig. 3. Mean and standard deviation of the activity parameters per part of the day for the total group. *Significant difference between periods of the day.
The one-way ANOVA test on the individual data revealed that only 4 of the 14 participants had significant differences between the periods of the day for activity time per hour: participant 4: F(2,18) = 6.73, p = 0.007; participant 6: F(2,15) = 9.66, p = 0.002; participant 8: F(2,14) = 6.23, p = 0.01; and participant 10: F(2,15) = 15.47, p = 0.0002. The 4 participants were significantly more active during the morning than in the evening.
Discussion
Activity level
The mean activity time of 54 min/day was relative low compared with other studies, in which activity times of 75–120 min/day (19), 98 min/day (SD 68) (10) and 72 min/day (5) (sum of moderate and high intensity minutes) were assessed. However, the measurement device and definition of activity differ greatly between studies. Manns & Baldwin (5) and Roos et al. (19) used an ankle-worn StepWatch Activity Monitor, in which the number of steps per min and per 5 s were measured, respectively. Manns defined a moderate minute as having at least 15 strides, and a highly active minute as having at least 40 strides, whereas Roos defined 3 strides in 15 s as an active bout. As a result, a participant could be classified as being active even when not active during the whole time-period. Therefore, the studies of Manns and Roos will probably overestimate the length of activity. In the current study and in the study by Van den Berg-Emons (10), posture and activity were assessed for each second, and activity was defined as a person being active for at least 5 s. Moreover, previous studies (2, 7, 13) took measurements for 2 or 3 days with sensors attached to the body. This could have caused reactivity (20, 21); as participants could feel the sensors and were probably aware that they were being measured; this might prompt them to increase their activity level, as has been found when sealed and unsealed pedometers were compared (22). Therefore, Hart (23) suggested that multiple days are required to predict average activity accurately, especially for light and sedentary behaviour. Many other studies used a pedometer to assess the activity level of patients with stroke for 1 week. The pedometer measures the total number of steps per day, which varied between 1,389 and 6,428 (2–8). With a step cadence of 81 steps/min (24, 25) this would mean an activity time of between 17 and 79 min. Hence, the 54 min of activity time in the present study is in the same range as previous studies.
Variation between days
One of the main advantages of the current study is the multiple days of measurements, which gives the opportunity to assess the variation over several days and statistically to compare the activity between participants. The data on variation in activity between days could be helpful in developing strategies to increase activity level. A patient with a high variation in activity over a week should be stimulated on less active days, whereas a patient with a low variation should be coached to increase their activity level in general. The present study shows a SD of 23 min between the various days, averaged over the participants. Moreover, the variation in activity time between days ranged from 5 to 45 min (Fig. 2). As a result of the high variation between days, patients with chronic stroke had a statistically significant difference in activity level when they had at least a difference in activity of approximately 30 min. The high variation in activity over several days can be explained by a burst of activity due to physical therapy sessions, which is usually carried out once or twice a week. Therefore, we suggest that the mean activity time should be combined with variation in activity across days.
Achievement of ambulatory activity level
Powell stated that if the total activity is equal to the norm, the benefits for health are equal, indicating that it does not matter which activities comprise the total activity pattern (12). Although how the activity is achieved is not important for the health benefits, it contributes in optimizing the strategy to stimulate a person to be more active. From this perspective, Cavanaugh et al. (26) emphasized the important correlation between the number of bouts of exercise and their length. They found that healthy older adults accumulated a similar length of activity as younger healthy adults, but that they did this in fewer bouts. They concluded that initiating ambulatory activity could become more difficult with age. Moreover, Manns et al. (27) found that shorter bouts of activity were associated with longer recovery times from submaximal exercise, suggesting that the importance of the length of bouts of activity might be an appropriate target for intervention. Recently, Roos demonstrated a significantly lower number of bouts between 2 patient groups with chronic stroke (limited and unlimited community ambulated) and controls, but the 3 groups had the same median length of bouts (19). In the current study, 63% of the comparisons between participants revealed a statistically significant difference in the number or length of bouts, indicating that patients with chronic stroke differ among each other in how they achieve their activity level. Moreover, inactive patients with stroke showed a low mean and SD for the number of bouts, whereas the more active patients with stroke showed a larger number with a larger SD. This finding suggests that initiating ambulatory activity seems to be more difficult for the inactive patient with stroke. As Cavanaugh et al. (26) suggests for the older adults, they may be limited by their poor physical condition in performing a range of ambulatory tasks under different conditions. Therefore, in order to increase the activity level in inactive patients with chronic stroke the therapy should either increase the length or the number of bouts of activity, depending on how the individual patient achieves the total activity level.
The distribution of activity during the day could also be incorporated into the strategy to increase the level of physical activity. In the current study, the amount of activity decreased as the day progressed. Other studies showed a similar pattern in distribution of activity over the day for inactive patient groups, whereas the healthy control groups showed an increasing activity pattern (28, 29). Despite the clear general pattern of decreasing activity, only 4 of 14 participants showed significant differences between the morning and evening. Therefore, the activity pattern over the day seems to be less useful when planning how to increase the activity level in mildly active patients with stroke.
Ambulatory monitoring
In the present study, we chose to put the sensors in subject’s trouser pockets because of the practical problems that would be associated with having the sensors attached to the body for 7 consecutive days. As a consequence, the data had to be checked and corrected afterwards due to movements of the pocket sensors in relation to the body. In general, the correction was made for only 10% of the data and it was easy to recognize misclassifications; walking has a typical pattern, and transition from standing to sitting or vice versa can be easily identified. Because inactive patients with stroke often walk and move very slowly, walking in inactive participants could have been seen as standing. However, in contrast to the mildly active patients, the ratio of the standing time and activity time was almost the same. Therefore, we conclude that the classification was accurate and represented the actual situation.
Conclusion
The ambulatory activity level in patients with chronic stroke is low, and they show a high variation in activity parameters across days, indicating that multiple measurement days are important. Nevertheless, there is significant difference between patients in terms of activity parameters. Inactive participants had a significantly lower mean number of bouts of activity, but no clear difference in length of bouts. Although the activity level of patients with chronic stroke decreased during the day, only 4 participants showed a significant difference between the periods of the day. The large differences between patients in activity parameters indicate that tailored advice is important in promoting physical activity levels.
References

