Katarina Skough Vreede, PT1, Jan Henriksson, MD, PhD1,2, Kristian Borg, MD, PhD1 and Marketta Henriksson, PT, PhD1
From the 1Division of Rehabilitation Medicine, Department of Clinical Sciences Danderyd Hospital and 2Department of Physiology and Pharmacology, Karolinska Institutet, Stockholm, Sweden
OBJECTIVE: To evaluate gait in patients with post-polio syndrome, using the 6-minute walk test (6MWT) combined with three-dimensional kinematic analysis.
DESIGN: Descriptive study.
SUBJECTS: Eighteen patients and 11 healthy controls.
METHODS: Kinematic data were obtained during a 6MWT by a Vicon motion capture system. Distance, heart rate, leg tiredness, dyspnoea and exertion were also recorded.
RESULTS: Patients with post-polio syndrome showed larger increases in leg tiredness (p < 0.001) and dyspnoea (p < 0.05) as a result of the 6MWT than did controls. Walking speed decreased by 14.1% in patients vs 4.7% in controls (p < 0.05). Fourteen out of 18 patients displayed plantar-flexed ankle at initial contact (1/11 controls). At foot-off, the patients had a flexed hip (extended in controls) and a more flexed knee. Walking speed in patients correlated with hip angle at foot-off, at the start (r = –0.60, p < 0.001) and the end of the 6MWT (r = –0.74, p < 0.001), being higher the more the hip was extended.
CONCLUSION: The 6MWT is fatiguing for patients with post-polio syndrome, and this was reflected in the kinematic data. Walking speed was negatively correlated with the increased hip flexion, but not with the ankle plantar-flexion at foot-off in the patients with post-polio syndrome. The three-dimensional results underscore the importance of hip function in this patient group.
Key words: gait; post-polio syndrome; kinematics.
J Rehabil Med 2013; 45: 924–928
Correspondence address: Katarina Skough, Division of Rehabilitation Medicine, Danderyd University Hospital, Bldg 39, floor 3, SE-182 88 Stockholm, Sweden. E-mail: katarina.skough@ki.se
Accepted Apr 15, 2013; Epub ahead of print Aug 27, 2013
Introduction
Many patients with prior poliomyelitis are at risk of developing new or increased symptoms, known as post-polio syndrome (PPS). Weakness in previously affected and unaffected muscles, fatigue and pain are the most common symptoms of PPS (1).
Due to compensatory neuromuscular mechanisms, there is a non-linear association between muscle strength and walking ability (2–4). The increase in slow-twitch muscle fibres and a loss of fast-twitch muscle fibres reported in patients with PPS (5–7) may decrease their ability to rapidly avoid obstacles when walking, and may be the background for the subjective feeling of reduced balance and fear of falling. Furthermore, patients with PPS often display drop-foot (8), which necessitates compensatory changes in gait pattern.
The aim of the present study was to characterize gait in patients with PPS, by using the 6-minute walk test (6MWT) combined with 3-dimensional (3D) movement analysis in order to obtain spatio-temporal and kinematic parameters during the gait cycle. The PPS patients’ gait was compared with that of healthy controls. A further aim was to evaluate differences between the beginning and end of the 6MWT in the gait variables, in order to evaluate whether any influence of fatigue could be detected during the test.
Material and methods
Subjects
A total of 18 patients with PPS, according to the criteria of March of Dimes (9), were recruited from the post-polio outpatient clinic at the Department of Rehabilitation Medicine, Danderyd University Hospital. Eleven healthy controls were recruited externally. Table I shows the characteristics of the subjects. Five patients and one control were on anti-hypertensive medication. Heart rate data from these subjects were included, as data did not differ from the whole group. Subjects had no other cardiovascular disorders.
|
Table I. Characteristics of patients with post-polio syndrome and healthy controls |
||
|
|
PPS (n = 18) Mean (SD) |
Control (n = 11) Mean (SD) |
|
Age at examination, years |
67 (9.5) |
68 (6.1) |
|
Body length, m |
1.68 (0.09) |
1.74 (0.09) |
|
Body weight, kg |
75.5 (13.4) |
71.3 (11.6) |
|
BMI |
26.7 (3.2) |
23.5 (2.4) |
|
Polio duration, years |
59 (5.7) |
5/6 |
|
Gender, men/women, n |
9/9 |
|
|
BMI: body mass index; SD: standard deviation. |
||
All subjects were able to walk for 6 min. Canes/crutches were used indoors by 4 of the patients with PPS. Eight of the patients with PPS regularly used some kind of orthosis on the analysed leg; 1 used a full-leg orthosis, 5 used a dorsal extension support, and 2 used a knee orthosis. In all, 10 of the patients with PPS were normally dependent on assistive devices, and 8 walked unaided in their daily life. When performing gait analysis, all the subjects walked unaided and barefoot.
All patients in the study had reduced muscle strength, with different patterns, in the lower extremity. According to Manual Muscle Testing (MMT) scale 0–5, from the PPS patients’ medical history, medians (range) were: hip flexion/extension 4 (3–5)/3.25 (2–5), knee flexion/extension 3 (1–4.5)/3.5 (1.5–4), ankle dorsal flexion/plantar flexion 2 (0–5)/2.5 (0–5).
Gait analysis
Registration of 3D movement analysis during 6MWT, was performed in the Human Physiological Laboratory Karolinska Institutet at Danderyd University Hospital.
For 3D movement analysis an 8-camera VICON MX System (Vicon, Oxford, UK), sampling frequency 100 Hz, was used. The Vicon Plug-in-Gait marker set and model were used to generate the kinematic data. The most affected leg of the patients with PPS was chosen on the basis of data from medical records and by means of MMT. For 10 patients it was obvious which leg was the most affected. For the remaining 8 patients, the most affected leg was chosen in agreement with notes in the patients’ medical records regarding which leg was the weakest. The most affected leg was compared with the mean value of the right and left legs of the healthy controls.
The test was performed over a distance of 10 m, due to the length of the laboratory. Subjects were told to walk as far as possible during 6 min, at a self-selected speed. They were allowed to rest and were not given any physical assistance during the test. Borg scales (10) were used, immediately before and after the test, to evaluate leg tiredness and dyspnoea on the Category Ratio (CR-10) scale and exertion on the Ratio of Perceived Exertion (RPE) scale. Heart rate was recorded with a heart rate monitor (Polar Electro Oy, Kempele, Finland) strapped with an elastic band around the thorax.
Data analysis
During the first and the last 30-s periods of the 6MWT data were recorded over 7 s in each period. Mean values of 2 consecutive steps were analysed. For spatio-temporal gait parameters (cadence, step length and walking speed), the data of Plug-In-Gait were further processed using the Polygon 3.5.1 software (Vicon). The ASCII files of the kinematic data (sagittal plane hip, knee and ankle angles at 2 foot positions) were analysed manually in AxoGraph 4.9 (Axon Instruments, Inc., Foster City, CA, USA). Two critical foot positions were analysed, initial contact (IC), when one foot contacts the ground and foot-off (FO), when the same foot leaves the ground.
Statistical analysis
The statistics program SPSS Statistics (version 20) was used for calculation of data. p < 0.05 was considered statistically significant. Following tests for normality with the Kolmogorov-Smirnov test, an independent samples t-test was used for comparisons between groups, regarding 6MWT, heart rate and gait parameters. A paired samples t-test was used to compare gait parameters within groups. The Wilcoxon signed-ranks test was used for evaluation of Borg scales (RPE, CR-10) within groups and the Mann-Whitney U test for results between groups. Correlations were analysed with Pearson correlation test. Data are given as median (range) and means (standard deviation; SD).
Ethical approval
The study was approved by the Ethical Review Board in Stockholm, Sweden (Dnr 2010/1883-32).
Results
Walk distance
Patients with PPS walked a mean distance of 229 (88) m during the 6MWT (range 54–380 m). This was a significantly shorter distance than controls (441 (51) m; range 366–510 m) (p < 0.001). Patients with PPS who were normally dependent on assistive devices walked a shorter distance (193 (86) m) than patients with PPS who normally walked unaided (275 (71) m) (p < 0.05). This difference was secondary to a lower cadence (p < 0.05).
Exertion, leg tiredness, dyspnoea and heart rate
In the basal state, patients with PPS experienced more leg tiredness, exertion and dyspnoea than did controls (Table II). All 3 variables increased as a result of the 6MWT in both the patients with PPS and the controls, but the increases were significantly larger in the PPS patients regarding leg tiredness and dyspnoea compared with controls. There were no differences between patients with PPS who were normally dependent on assistive devices and those who normally walked unaided.
Heart rate at rest before the test was 75 (12) beats per minute (bpm) (mean (SD)) in patients with PPS and 68 (11) bpm in controls (not significant). Heart rates increased (p < 0.001) to reach plateau levels during the test, of 96 (12) and 101 (18) bpm in the 2 groups, respectively.
|
Table II. Exertion at the Borg Ratio of Perceived Exertion (RPE) scale and leg tiredness, dyspnoea at the Borg CR-10 (Category Ratio) scale, presented with mean (standard deviation; SD) and median (range) |
||||||||||
|
PPS (n = 18) |
Controls (n = 11) |
PPS vs controls |
||||||||
|
Before p-value |
After p-value |
Difference after before p-value |
||||||||
|
Before |
After |
p-value |
Before |
After |
p-value |
|||||
|
Exertion |
||||||||||
|
Mean (SD) |
10.4 (3.2) |
14.2 (2.7) |
< 0.001 |
6.3 (0.6) |
9.2 (2.9) |
< 0.05 |
< 0.001 |
< 0.001 |
n.s. |
|
|
Median (range) |
11 (6–18) |
15 (9–19) |
6 (6–8) |
9 (6–14) |
||||||
|
Leg tiredness |
||||||||||
|
Mean (SD) |
2.0 (1.1) |
5.3 (2.0) |
< 0.001 |
0.1 (0.2) |
0.8 (1.0) |
< 0.05 |
< 0.001 |
< 0.001 |
< 0.001 |
|
|
Median (range) |
2.5 (0–3) |
5 (2–10) |
0 (0–0.7) |
0.5 (0–2.5) |
||||||
|
Dyspnoea |
||||||||||
|
Mean (SD) |
1.4 (1.2) |
3.6 (2.0) |
< 0.001 |
0.2 (0.4) |
1.4 (1.1) |
< 0.01 |
< 0.005 |
< 0.005 |
< 0.05 |
|
|
Median (range) |
1.25 (0–4) |
3.5 (0–7) |
0 (0–1) |
2 (0.3–3) |
||||||
|
PPS: post-polio syndrome; SD: standard deviation; n.s.: not significant. |
||||||||||

Spatio-temporal and kinematic gait parameters
Spatio-temporal gait parameters at the beginning and end of the 6MWT are shown in Table III. All spatio-temporal gait parameters differed significantly between the groups, both at the beginning and the end of the 6MWT (p < 0.001). The relative decrease in step length and walking speed from the beginning to the end of the 6MWT was significantly larger in patients with PPS than in controls (p < 0.05), but not significantly different between patients with PPS who were normally dependent on assistive devices and those who normally walked unaided. Patients with PPS, who were normally dependent on assistive devices, walked slower at the end of the 6MWT compared with those who normally walked unaided (p < 0.05).
|
Table III. Spatio-temporal gait parameters (mean and SD) at the beginning and end of the 6-minute walk test (6MWT), the difference beginning-to-end in percent and the p-value, for the post-polio syndrome (PPS) and control groups |
|||||||||
|
Parameters |
PPS (n = 18) |
Controls (n = 11) |
|||||||
|
Beginning Mean (SD) |
End Mean (SD) |
Diff % |
p-value |
Beginning Mean (SD) |
End Mean (SD) |
Diff % |
p-value |
||
|
Cadence, steps/min |
103 (17) |
97 (18) |
–5.7 |
< 0.05 |
128 (11) |
126 (14) |
–2.4 |
n.s |
|
|
Step length, m |
0.51 (0.13) |
0.47 (0.13) |
–8.4 |
< 0.001 |
0.75 (0.05) |
0.74 (0.05) |
–1.9 |
n.s |
|
|
Walking speed, m/s |
0.88 (0.29) |
0.77 (0.29) |
–14.1 |
< 0.001 |
1.61 (0.18) |
1.54 (0.20) |
–4.7 |
< 0.05 |
|
|
SD: standard deviation; diff: difference; n.s: not significant. |
|||||||||
The kinematic gait parameters from the beginning and end of the 6MWT are shown in Table IV.
|
Table IV. Kinematic gait parameters (mean and SD) at the beginning and the end of 6-minute walk test (6MWT), and the p-value, for the post-polio syndrome (PPS) and control groups |
|||||||
|
Parameters |
PPS (n = 18) |
Controls (n = 11) |
|||||
|
Beginning Mean (SD) |
End Mean (SD) |
p-value |
Beginning Mean (SD) |
End Mean (SD) |
p-value |
||
|
Hip angle at IC |
34 (9) |
34 (10) |
n.s. |
30 (5) |
31 (5) |
n.s. |
|
|
Knee angle at IC |
10 (6) |
11 (7) |
n.s. |
10 (3) |
11 (4) |
n.s. |
|
|
Ankle angle at IC |
–5 (6) |
–5 (6) |
n.s. |
5 (4) |
4 (4) |
< 0.05 |
|
|
Hip angle at FO |
13 (11) |
14 (13) |
n.s. |
–7 (9) |
–9 (9) |
< 0.005 |
|
|
Knee angle at FO |
41 (10) |
39 (9) |
n.s. |
35 (7) |
31 (8) |
< 0.05 |
|
|
Ankle angle at FO |
–8 (9) |
–6 (11) |
n.s. |
–11 (6) |
–9 (6) |
n.s. |
|
|
A positive value denotes flexion (for ankle: dorsal flexion), whereas negative values denote extension (for ankle: plantar flexion). IC: initial contact; FO: foot-off; SD: standard deviation; n.s.: not significant. |
|||||||
Fourteen of 18 patients with PPS and one control had ankle plantar flexion at IC (PPS patients vs controls, p < 0.001). Furthermore, 3 patients with PPS had an ankle angle less than –10º, both at the beginning and the end of the test. Patients with PPS normally dependent on assistive devices had a more plantar-flexed ankle at IC at the end (but not at the beginning) of the test, compared with those who normally walked unaided (p < 0.05). There was no significant correlation between ankle dorsal flexion strength and ankle plantar flexion at IC.
Generally, a larger hip flexion was seen in patients with PPS than in controls. This was most evident at FO, where the hip was flexed in the patients, but extended in the controls (p < 0.001). At the end of the 6MWT, the patients with PPS also had a significantly greater knee flexion at FO compared with controls (p < 0.05). Patients with PPS who were normally dependent on assistive devices tended to have a more flexed hip at FO than those who normally walked unaided (p < 0.06). There were no significant correlations between hip extension strength (or plantar flexion strength) and hip flexion at FO.
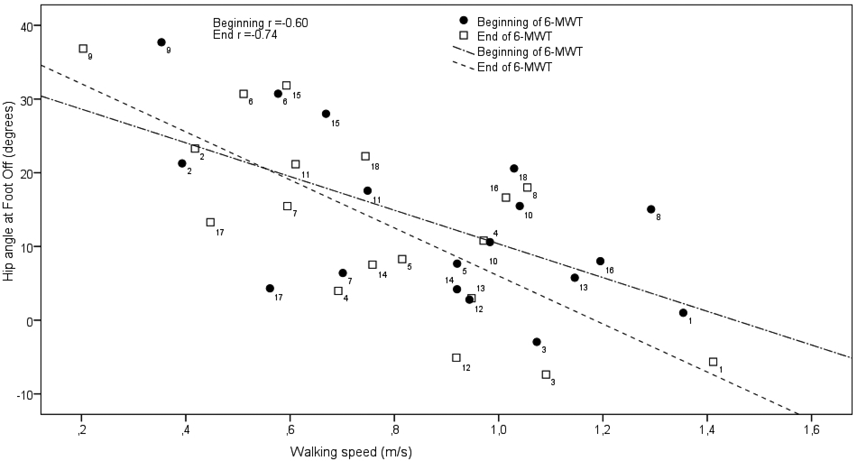
In the patients with PPS only, both hip and knee flexion at FO at the end of the 6MWT were significantly correlated with perceived exertion at the end of the 6MWT (in both cases r = 0.47, p < 0.05). Only in the patients with PPS, was walking speed as well as cadence inversely correlated with hip flexion at FO at both the beginning (r = –0.60, p < 0.01; r = –0.54, p < 0.05) and the end (r = –0.74, p < 0.001; r = –0.52, p < 0.05) of the 6MWT. The correlation between hip angle at FO and walking speed for the PPS group is shown in Fig 1.
Fig. 1. Correlation between hip angle at foot-off and walking speed, at the beginning and end of the 6-minute walk test (6MWT) for the post-polio syndrome (PPS) group. A positive hip angle denotes hip flexion, whereas negative values denote hip extension. Numbers (1–18) denote individual patients.
There were no differences between the patients with PPS and controls regarding the change between the beginning and end of the 6MWT for these variables. In the patients with PPS, walking speed was inversely correlated with both perceived exertion and leg tiredness following the 6MWT (r = –0.65 and r = –0.62, p < 0.01). In controls, walking speed was instead positively correlated with perceived exertion following the 6MWT (r = 0.62, p < 0.05).
Discussion
The main finding of this study was related to the ankle and the hip. At IC the ankle was plantar-flexed in the majority of patients with PPS, but dorsal-flexed in the majority of controls. This was anticipated, as drop-foot is often seen in this patient group. It is known that, in general, ankle plantar flexion strength has an important role in gait and is the best predictor of cadence and velocity (11). A reduced plantar flexion power leads to a decreased pre-swing “propulsive” force. Plantar flexor function cannot be excluded as a limiting factor for walking speed in patients with PPS, as plantar flexion range of motion (ROM) was not measured, but we found no correlation between walking speed and plantar flexion strength. The most striking finding was instead related to the hip joint, where, in the patients with PPS only, hip extension at FO was robustly correlated with cadence and walking speed. It is mechanically feasible that hip extensors would be important to maintain gait speed, e.g. by assisting the advancement of the contralateral leg (12). In accordance with this, reduced hip extension has been suggested to be a functionally significant gait impairment in the elderly (13). No statistically significant correlation between peak hip extension (at FO) during gait and walking speed in elderly subjects is normally reported in the literature (14, 15). This illustrates the importance of 3D movement analysis in the patients with PPS. We can only speculate regarding the origin of the decreased hip extension. It could be the natural consequence of an extension defect, or of hip extensor weakness, although we found no correlation between hip extension and hip extensor muscle strength in the present study. It cannot be excluded that the flexed hip is a compensation mechanism in order to secure the advancement of the leg into the swing phase. Whether rehabilitation measures focussed on the hip will be important in PPS cannot be stated with certainty from the present results.
An additional finding in the present study was that both patients with PPS and controls slow down during the 6MWT. The decline in walking speed was larger in the patients with PPS than in controls, indicating greater fatigability in the PPS group. This was anticipated, as the patients with PPS had lower muscle strength. It can be noted that, following the 6MWT, patients with PPS, on average, perceived exertion as between somewhat exhausting and exhausting according to the Borg scale (10), whereas controls perceived the walking as very easy. The much larger fatigue perceived by the patients with PPS was also reflected in the kinematic data, where, in the patients with PPS only, both hip and knee flexion at FO were significantly correlated with perceived exertion at the end of the 6MWT. The short walkway of 10 m, due to the length of the laboratory, may also increase fatigue due to a high number of turnarounds.
In conclusion, the 6MWT is fatiguing for patients with PPS, as reflected in the kinematic data. Walking speed was negatively correlated with the increased hip flexion, but not with the ankle plantar-flexion at FO in the patients with PPS. The 3D results underscore the importance of hip function in patients with PPS.
AcknowledgementS
The study was supported by grants from Karolinska Institutet and the Stockholm County Council (Stockholms Läns Landsting ALF-grant).
References

