Johan Styrke, MD, PhD1, Peter Sojka, MD, PhD2, Ulf Björnstig, MD, PhD1, Per-Olof Bylund, PhD3 and Britt-Marie Stålnacke, MD, PhD4
From the 1Division of Surgery, Department of Surgical and Perioperative Sciences, Umeå University, Umeå, 2Department of Health Sciences, Mid Sweden University, Östersund, 3Emergency and Disaster Medical Centre, Umeå University Hospital, 4Department of Community Medicine and Rehabilitation, Rehabilitation Medicine, Umeå University, Umeå, Sweden
OBJECTIVE: To investigate sex differences in symptoms, structure of symptoms, disability and life satisfaction 3 years after mild traumatic brain injury. Secondary aims were to find risk factors for adverse outcome.
DESIGN: Population-based cohort study.
Patients: The cohort comprised 137,000 inhabitants at risk in a defined population served by a single hospital in northern Sweden. Patients attending the emergency department following a mild traumatic brain injury in 2001 were included.
METHODS: Of 214 patients aged 18–64 years, 163 answered a questionnaire on symptoms, disability, and life-satisfaction 3 years post-injury. The instruments were analysed with descriptive statistics. A principal component analysis of the Rivermead Post-Concussion Symptoms Questionnaire was conducted. Risk factors were identified using logistic regression.
RESULTS: Post-concussion syndrome was found in 50% of the women and 30% of the men. Disability was found in 52% of the women and 37% of the men, and 57% of the women and 56% of the men were satisfied with their lives. For both genders, high frequency of symptoms was a risk factor for disability and low life satisfaction. Back pain was a risk factor for disability. Living alone was a risk factor for low levels of life satisfaction. The principal component analysis revealed differences between the sexes.
CONCLUSION: There are sex differences in outcome 3 years after mild traumatic brain injury. Women and men should be analysed separately.
Key words: traumatic brain injury; minor head injury; sex differences; post-concussion syndrome; follow-up studies; quality of life; principal component analysis; odds ratio.
J Rehabil Med 2013; 45: 786–794
Correspondence address: Johan Styrke, Division of Surgery, Department of Surgical and Perioperative Sciences, Umeå University, SE-901 85 Umeå, Sweden. E-mail: johan.styrke@surgery.umu.se
Accepted July 16, 2013
INTRODUCTION
Traumatic brain injury (TBI) is defined as “an alteration in brain function, or other evidence of brain pathology, caused by an external force” (1). The incidence of TBI in Europe has been found to vary between 91/100,000/year and 546/100,000/year (2). In addition to these cases of TBI registered at hospitals, 30–40% of persons who sustain an MTBI do not seek medical care (3).
Approximately 90% of treated TBI are mild (MTBI) (2). The definition of MTBI varies in different studies, but often includes patients presenting at the emergency department (ED) with a Glasgow Coma Scale score (GCS) (4) of 13–15 and/or a history of loss of consciousness (LOC) not exceeding 30 min and/or a history of post-traumatic amnesia (PTA) not exceeding 24 h (5).
The literature on consequences following MTBI is extensive. Patient symptoms are often divided into 3 subgroups: physical, cognitive or behavioural/emotional (5). Carroll et al. conducted a systematic review of the prognosis for MTBI, and concluded that symptoms and cognitive deficits are common immediately following MTBI, but most often resolve within 3–12 months (6). There is, however, a significant minority of patients whose symptoms persist. In hospital-based cohort studies with follow-up extending over a 1-year period symptoms or disabilities are found in approximately 10–50% of cases (7–9).
Men are at higher risk than women of sustaining a TBI (9). Sex differences in outcome following MTBI have been addressed in a number of studies, of which some found women to have an unfavourable outcome compared with men (10, 11). The evidence, however, is limited and some studies on cognitive symptoms found no difference between women and men, or even found men to have a worse outcome (12, 13). A lack of age matching and other baseline data between women and men, as well as the possibility that women and men report subjective symptoms differently have been known to bias the research of TBI gender studies (14).
The point prevalence of low back pain varies between 12% and 33% in the general population, and pain can confound results from studies of MTBI outcome because pain correlates with cognitive difficulties (15, 16). Zhang et al. (17) recently included neck/shoulder pain and low back pain in a regression analysis of factors contributing to poor perceived general health 6 weeks after MTBI, and found that presence of neck/shoulder pain and low back pain were associated with worse outcome.
Few studies have addressed long-term sex-related outcome after MTBI. The aim of this study was therefore to analyse symptoms, structure of symptoms, disability, and life satisfaction from this perspective in our hospital-based MTBI cohort 3 years after injury. Secondary aims were to investigate the frequency of neck, thoracic and lumbar back pain among the patients, and to find risk factors for adverse outcome of disability and life satisfaction.
MATERIAL AND METHODS
Participants and setting
Umeå is a mid-sized Swedish city located approximately 400 km south of the Arctic Circle. The city has only one hospital, serving a defined population of 137,000 inhabitants (2001 census). The distance to the next nearest hospital is 110 km. The study cohort originates from prospectively collected data in the Umeå University Hospital’s (UUH) injury register from 2001. This ED-based register describes all injuries that necessitate inpatient or outpatient treatment at the hospital. An extraction of data from the register was conducted in 2003. The data was re-evaluated and additional data added by retrospective analysis of medical records.
Inclusion criteria
In 2001, 485 patients with TBI were included in the injury register, 214 of whom met the inclusion criteria for the current study, listed below:
Follow-up
Of the 214 MTBI patients, 200 could be contacted, as shown in Fig. 1. In 2004 they were sent a set of postal questionnaires; a mean of 3 years and 3 months after the injury incident. Non-responders were contacted by telephone and reminded to complete the questionnaires. A total of 163 persons (81%) responded and were further analysed. Data on sex, age, type of injury event, presence of alcohol inebriation at the time of the injury, PTA, LOC, and presence of intracranial bleeding (ICB) were tested for differences in mean values between responders and non-responders.
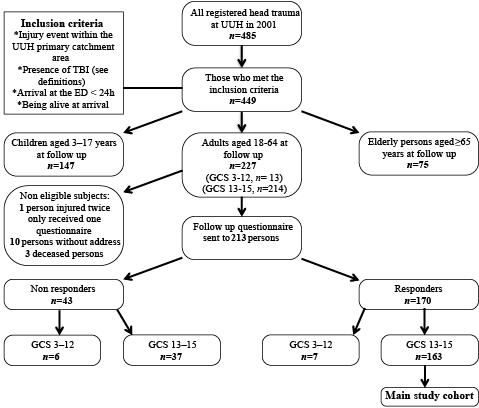
Fig. 1. Study flow chart. UUH: Umeå University Hospital; TBI: traumatic brain injury; ED: emergency department; GCS: Glasgow Coma Scale.
Severity classification
Our definition of MTBI falls within the American Congress of Rehabilitation Medicines definition of MTBI, with some exceptions (5). We did not, at the time of the primary data analysis in 2003, exclude patients with LOC exceeding 30 min or PTA exceeding 24 h from the MTBI group, because data on LOC and PTA could not be determined in approximately 40% of the patients. When answering the questionnaires in 2004, the patients responded to questions about the length of LOC and PTA. Five of the patients with GCS 13–15 at arrival claimed that the length of LOC had exceeded 30 min, and 3 of the patients stated that PTA had lasted for more than 24 h. These 8 patients are included in the study even though they could have been classified as moderate TBI in retrospect.
Definition of post-concussion syndrome
We used the definition of post-concussion syndrome (PCS) given by the International Classification of Diseases – 10th revision (ICD-10) (18). Hence 3 of the following symptoms (score 2–4) on the Rivermead Post-Concussion Symptoms Questionnaire (RPQ) were required: headache, dizziness, fatigue, poor memory, poor concentration, irritability, or sleep disturbance.
Statistical analysis
All data were analysed using SPSS 19 (SPSS Inc., Chicago, IL, USA) and Microsoft Excel 2011 (Microsoft Corp., Redmond, WA, USA). Contingency tables were analysed with Pearson’s χ2 test or Fisher’s exact test if any value was below 5. When comparing mean and median values, Student’s t-test (t-test) or the non-parametric Mann-Whitney U test (U-test) was used. Interquartile ranges (IQR) were used as measures of variability. Effect sizes were calculated for t-tests (d) (Cohen’s d) and U-tests (r) (r = z / √n). Statistical significance was set at p < 0.05. A principal component analysis (PCA) was performed to explore patterns in the RPQ data for women and men, respectively. Scree tests were used to determine the number of components to be included. These components also had eigenvalues > 1. No rotation was used. We investigated how to interpret the first 2 components by plotting the female component scores on the x-axis and the male component scores on the y-axis. We also graphically explored the relationship between the components and the presence of PCS, presence of disability and low levels of life satisfaction. To do this, we extracted the component scores and plotted them on scatterplots, coloured for the outcome measures. Finally, the component scores were included in multiple logistic regressions. These regressions were conducted to analyse the relationship between the dependent factors Rivermead Head Injury Follow-Up Questionnaire (RHFUQ) (presence of any disability) and life satisfaction checklist (LiSat-11) (< />median) vs some independent demographic and injury-related factors, along with the mean values of back pain and the RPQ component scores for each component. The tested demographic and injury-related risk factors were: age ≥ 40 years, traffic injury, presence of amnesia, presence of LOC, presence of ICB, living alone, unemployment, less than university-level education, TBI before 2001, TBI after 2001, and on-going insurance claim. An initial screening was conducted with χ2 tests and Mann-Whitney U tests, thereby ruling out risk factors with a p-value > 0.3. All remaining risk factors were included in the regression models and the models were subsequently simplified by the exclusion of risk factors with a p-value > 0.1. Nagelkerke R2 was used as a measure of goodness of fit for the models.
Follow-up instruments
RPQ. The RPQ is a frequently used questionnaire consisting of 16 symptoms commonly exhibited after MTBI (19). The patient is asked to rate symptoms exhibited during the last 24 h on a scale from 0 to 4, where 0 means no experience of the symptom, and 4 means that the symptom is a severe problem. The answers were dichotomized into 0–1 = no symptom experienced or 2–4 = symptom experienced. We added 3 questions regarding symptoms of back pain: During the last 24 h did you experience: 1, neck/cervical pain; 2, thoracic pain; or 3, lumbar pain? The total score from all 3 types of back pain is referred to as “back pain score”.
RHFUQ. The RHFUQ is an instrument aimed at describing outcome of mild to moderate TBI in terms of disability (20). The 10 items cover social and domestic activities, work, and relations with friends and family. The participants are asked to rate changes in their abilities compared with prior to the injury. The answers range from 0 = no change to 4 = a very marked change. The RHFUQ was dichotomized into 0 = no disability and 1–4 = presence of disability.
LiSat-11. Life satisfaction was assessed using the LiSat-11 (21). The instrument uses a 6-grade scale (from 1 = very dissatisfying to 6 = very satisfying). The LiSat-11 scale was dichotomized into satisfied (5–6) or dissatisfied (1–4).
Reference populations
The RPQ answers were compared with a 2007 reference group consisting of 461 18–64-year-old consecutive blood donors at the Blood Centre of UUH (the only blood donor site in the area) (Nilsson Sojka & Sojka, unpublished, anonymously collected data). The LiSat-11 reference population comprised 2,533 Swedes, aged 18–64 years, who answered the questionnaire in 1996 (21).
Ethics
The regional ethics committee approved the study (04-097M).
RESULTS
Characteristics of the patients, non-responders and reference groups
Some demographic and injury-related characteristics are shown in Table I. There were no significant differences between women and men, except that men more often had presence of LOC and were less often university-educated. No significant differences in proportions were found between responders and non-responders, with the exceptions that alcohol inebriation at the time of the injury was more common among the non-responders, and LOC was more common among the responders. There was no significant difference in sex distribution between the RPQ reference population and the study population. The references were older than the study population: median 35 years (IQR 24) vs 25 years (IQR 23) (p < 0.001, U-test, r = 0.25). Previous TBI was reported by 116 of the references. When comparing the LiSat-11 reference population with the study population, the distribution of women and men was similar. The mean age of the LiSat-11 references was unknown.
|
Table I. Demographic and injury-related characteristics |
||||||
|
Women (n = 68) |
Men (n = 95) |
p-value |
Responders (n = 163) |
Non-responders (n = 37) |
p-value |
|
|
Male, % |
– |
– |
– |
58 |
58 |
0.97 |
|
Age ≥ 40 years, % |
24 |
33 |
0.21 |
29 |
32 |
0.74 |
|
Age, years, median (IQR) |
25 (19) |
25 (27) |
0.90 (U-test) |
25 (23) |
29 (22) |
0.22 (U-test) |
|
Injured in traffic, % |
37 |
32 |
0.49 |
34 |
37 |
0.72 |
|
PTA present, % |
38 |
47 |
0.25 |
44 |
45 |
0.90 |
|
PTA, min, median (IQR) |
15 (115) |
30 (236) |
0.31 (U-test) |
– |
– |
– |
|
LOC present, % |
40 |
57 |
0.031 |
50 |
26 |
0.009 |
|
LOC, min, median (IQR) |
5 (I28) |
5 (22) |
0.97 (U-test) |
– |
– |
– |
|
ICB present, % |
3 |
5 |
0.70 |
4 |
3 |
0.53 |
|
Alcohol inebriation, % |
18 |
27 |
0.15 |
23 |
42 |
0.019 |
|
Living alone, % |
34 |
32 |
0.76 |
– |
– |
– |
|
Unemployed, % |
27 |
26 |
0.98 |
– |
– |
– |
|
Not university-educated, % |
52 |
78 |
< 0.001 |
– |
– |
– |
|
TBI before year 2001, % |
44 |
40 |
0.60 |
– |
– |
– |
|
TBI after year 2001, % |
12 |
12 |
0.97 |
– |
– |
– |
|
Insurance process present, % |
32 |
34 |
0.86 |
– |
– |
– |
|
Significant p-values are shown in bold. PTA: post-traumatic amnesia; LOC: loss of consciousness; ICB: intracerebral bleeding; TBI: traumatic brain injury; IQR: interquartile range. |
||||||
Rivermead Post-Concussion Symptoms Questionnaire and back pain
The scores for all symptoms on the RPQ in women and men, with the addition of back pain, are shown in Table II. Women had a significantly higher median RPQ score than men: 13 (IQR 21) vs 6 (IQR 16) (p = 0.006, U-test, r = 0.22). PCS according to the ICD-10 was found in 50% of the women and 30% of the men (p = 0.008). When comparing presence of symptoms (score 2–4), the share of women who exhibited symptoms of headache, dizziness, nausea/vomiting, noise sensitivity, fatigue, feelings of depression, and taking longer to think were significantly higher than the share of men claiming to have those symptoms (Table III). Feelings of depression were reported by 41% of the women and 22% of the men among the patients, but only by 5% and 4% among the references. In the reference group, fewer differences between women and men were found (Table III).
|
Table II. Number of post-concussion symptoms (RPQ) and back pain in women/men |
||||||
|
RPQ scorea |
0 |
1 |
2 |
3 |
4 |
Missing value |
|
Headache |
27/53 |
7/18 |
18/13 |
10/7 |
6/4 |
|
|
Dizziness |
29/67 |
15/9 |
15/13 |
7/6 |
2/0 |
|
|
Nausea, vomiting |
47/78 |
10/11 |
9/2 |
2/3 |
0/1 |
|
|
Noise sensitivity |
33/74 |
13/5 |
11/8 |
8/7 |
2/1 |
1/0 |
|
Sleep disturbance |
36/59 |
7/12 |
4/7 |
14/12 |
7/5 |
|
|
Fatigue |
27/49 |
9/18 |
15/15 |
7/10 |
10/3 |
|
|
Irritability |
31/56 |
16/16 |
7/14 |
10/5 |
4/4 |
|
|
Feeling depressed |
29/57 |
11/17 |
15/12 |
7/4 |
6/5 |
|
|
Feeling frustrated |
30/55 |
15/17 |
15/16 |
4/4 |
4/3 |
|
|
Poor memory |
31/46 |
13/23 |
7/15 |
12/4 |
4/7 |
1/0 |
|
Poor concentration |
35/57 |
9/14 |
10/14 |
10/6 |
4/4 |
|
|
Taking longer to think |
41/65 |
10/18 |
7/5 |
6/4 |
4/3 |
|
|
Blurred vision |
42/71 |
12/11 |
10/6 |
3/3 |
1/4 |
|
|
Sensitivity to light |
42/68 |
9/9 |
5/9 |
8/7 |
4/2 |
|
|
Double vision |
57/86 |
8/4 |
1/4 |
0/1 |
1/0 |
1/0 |
|
Restlessness |
40/62 |
10/19 |
6/7 |
11/5 |
1/2 |
|
|
Back pain |
||||||
|
Cervical spine |
29/56 |
6/10 |
15/10 |
10/11 |
6/8 |
2/0 |
|
Thoracic spine |
38/69 |
7/8 |
11/3 |
8/10 |
2/4 |
2/1 |
|
Lumbar spine |
31/60 |
10/15 |
10/5 |
8/10 |
8/5 |
1/0 |
|
a0: not experienced; 1: no longer a problem; 2: a mild problem; 3: a moderate problem; 4: a severe problem. RPQ: Rivermead Post-Concussion Symptoms Questionnaire. |
||||||
Presence of almost all RPQ symptoms was significantly more frequent in the MTBI group than in the reference group (Table III). The median RPQ score was higher among the patients of this study than among the references: 9 (IQR 18) vs 2 (IQR 5) (p< 0.001, U-test, r = 0.31). This was also true for women: 13 (IQR 21) vs 3 (IQR 6) (p< 0.001, U-test, r = 0.26) and men: 6 (IQR 16) vs 2 (IQR 5) (p< 0.001, U-test, r = 0.40). The symptoms with the highest difference of occurrence between the patients and the references in women were: headache, poor concentration, and feeling depressed, whereas in men the affective symptoms feeling frustrated and irritability accompanied headache and poor memory.
Neck pain (score 2–4) was found in 37%, lumbar back pain in 28%, and thoracic back pain in 24% of the patients. Women reported these symptoms significantly more frequently than men (Table III). Women also had a significantly higher median back pain score than men: 3 (IQR 6) vs 1 (IQR 4) (p = 0.015, U-test, r = 0.19).
|
Table III. Comparison between the frequencies of post-concussion symptoms (RPQ-score 2–4) and back pain (score 2–4) exhibited by respondents of the present study and a reference group of blood donors |
||||||||
|
Present study |
Reference |
p-value |
||||||
|
Women (n = 68) % a |
Men (n = 95) % b |
Women (n = 179) % c |
Men (n = 282) % d |
|||||
|
a–b |
c–d |
a–c |
b–d |
|||||
|
Headache |
50 |
25 |
7 |
4 |
0.001 |
0.25 |
< 0.001 |
< 0.001 |
|
Dizziness |
35 |
20 |
8 |
2 |
0.029 |
0.002 |
< 0.001 |
< 0.001 |
|
Nausea, vomiting |
16 |
6 |
0 |
0.7 |
0.042 |
0.52 |
< 0.001 |
0.004 |
|
Noise sensitivity |
31 |
17 |
7 |
3 |
0.035 |
0.047 |
< 0.001 |
< 0.001 |
|
Sleep disturbance |
37 |
25 |
10 |
10 |
0.11 |
0.97 |
< 0.001 |
< 0.001 |
|
Fatigue |
47 |
30 |
28 |
18 |
0.022 |
0.017 |
0.004 |
0.023 |
|
Irritability |
31 |
24 |
5 |
3 |
0.34 |
0.15 |
< 0.001 |
< 0.001 |
|
Feeling depressed |
41 |
22 |
5 |
4 |
0.009 |
0.62 |
< 0.001 |
< 0.001 |
|
Feeling frustrated |
34 |
24 |
8 |
3 |
0.18 |
0.015 |
< 0.001 |
< 0.001 |
|
Poor memory |
34 |
27 |
7 |
6 |
0.38 |
0.49 |
< 0.001 |
< 0.001 |
|
Poor concentration |
35 |
25 |
6 |
5 |
0.17 |
0.90 |
< 0.001 |
< 0.001 |
|
Taking longer to think |
25 |
13 |
2 |
3 |
0.042 |
0.32 |
< 0.001 |
< 0.001 |
|
Blurred vision |
21 |
14 |
3 |
4 |
0.24 |
0.42 |
< 0.001 |
0.001 |
|
Sensitivity to light |
25 |
19 |
6 |
3 |
0.35 |
0.082 |
< 0.001 |
< 0.001 |
|
Double vision |
3 |
5 |
0 |
0.4 |
0.70 |
1.0 |
0.075 |
0.005 |
|
Restlessness |
27 |
15 |
3 |
3 |
0.063 |
0.81 |
< 0.001 |
< 0.001 |
|
Cervical spine pain |
47 |
31 |
0.034 |
|||||
|
Thoracic spine pain |
32 |
18 |
0.044 |
|||||
|
Lumbar spine pain Any spinal pain |
39 62 |
21 37 |
0.014 0.002 |
|||||
|
Significant p-values are shown in bold. RPQ: Rivermead Post-Concussion Symptoms Questionnaire. |
||||||||
Rivermead Head Injury Follow-Up Questionnaire
Presence of any disability was reported by 52% of the women and 37% of the men. The most frequently reported disability items were tiredness at work (23%), difficulty in sustaining previous workload (18%), and difficulty in ability to enjoy previous leisure activities (18%). Women had a significantly higher median RHFUQ score than men: 2 (IQR 11) vs 0 (IQR 4) (p = 0.040, U-test, r = 0.16). Women scored higher on all disability items, however, only significantly higher on 3 items: conversation with 2 or more people, tiredness at work, and family expectations (Table IV).
|
Table IV. Disability (RHFUQ score 1–4) in comparison between women and men |
|||
|
Women (n = 68) % |
Men (n = 95) % |
p-value |
|
|
Conversation 1 person |
6 |
4 |
0.72 |
|
Conversation ≥ 2 persons |
24 |
11 |
0.025 |
|
Domestic work |
10 |
5 |
0.24 |
|
Social activities |
16 |
8 |
0.13 |
|
Leisure activities |
24 |
14 |
0.11 |
|
Workload |
24 |
14 |
0.11 |
|
Tired at work |
32 |
17 |
0.021 |
|
Relationship with previous friends |
19 |
9 |
0.076 |
|
Relationship with partner |
13 |
5 |
0.13 |
|
Family demands |
18 |
6 |
0.023 |
|
Significant p-values are shown in bold. RHFUQ: Rivermead Head Injury Follow-Up Questionnaire. |
|||
LiSat-11
For most items, the proportion of persons indicating satisfied or very satisfied on the LiSat-11 was significantly lower in the MTBI-group compared with the reference population. Exceptions were partner relationship and family life, where no significant differences were found (Table V). Fifty-seven percent of the women and 56% of the men were satisfied with their life as a whole. There were no significant differences in any of the items or the mean LiSat-11 score between men and women: 46.0 (IQR 16) vs 46.7 (IQR 15) (p = 0.70; difference 0.7, 95% CI –4.1–2.7, t-test, d = 0.06) (Fig. 2).
|
Table V. LiSat-11: comparison between the patients of this study and the Swedish general population reference group (Fugl-Meyer et al. [21]) for the answers “very satisfied” or “satisfied” on all items |
||||
|
Present study (n = 163) % |
Reference (n = 2,533) % |
p-value |
||
|
Life as a whole |
56 |
70 |
< 0.001 |
|
|
Closeness |
||||
|
Sexual life |
46 |
56 |
0.011 |
|
|
Partner relationship |
80 |
82 |
0.65 |
|
|
Family life |
81 |
81 |
0.98 |
|
|
Health |
||||
|
ADL |
90 |
95 |
0.003 |
|
|
Somatic health |
43 |
77 |
< 0.001 |
|
|
Psychological health |
60 |
81 |
< 0.001 |
|
|
Spare time |
||||
|
Leisure |
45 |
57 |
0.002 |
|
|
Contacts |
54 |
65 |
0.003 |
|
|
Provision |
||||
|
Vocation |
42 |
54 |
0.001 |
|
|
Economy |
25 |
39 |
< 0.001 |
|
|
Significant p-values are shown in bold. ADL: activities of daily living. |
||||
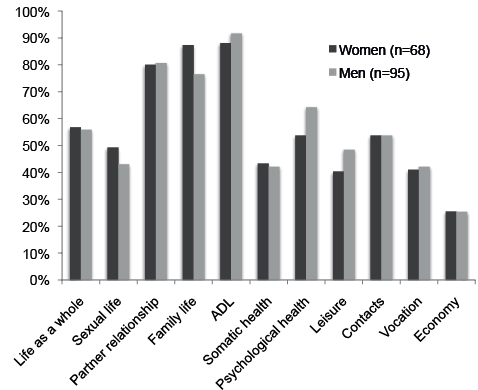
Fig. 2. Frequency of persons being satisfied or very satisfied (score 5–6) with different aspects of life measured on the LiSat-11. ADL: activities of daily living.
Principal component analysis
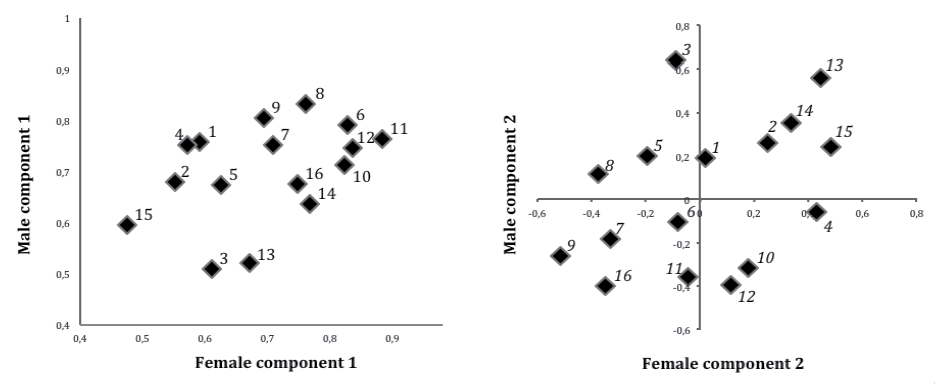
In women, we found 3 significant components (eigenvalues 8.0, 1.5 and 1.1) explaining 50 + 10 + 7=66% of the total variance and in men 2 significant components (eigenvalues 8.0 and 1.7) explaining 50 + 11 = 61% of the total variance. In both women and men, all symptoms of the RPQ highly contributed to component 1, and those symptoms that also highly contributed to component 2 were mainly vision-related symptoms, whereas, for example, frustration and restlessness were low contributors. Differences between women and men existed; for example, noise sensitivity and headache were slightly more prominent symptoms on component 1 in men, while noise sensitivity and poor memory scored high in women but not in men on component 2 (Fig. 3). To reach a 1-component solution in men, the 3 vision-related symptoms plus dizziness, nausea/vomiting, and sleep disturbance had to be excluded. To reach a 2-component solution in women, the vision-related symptoms had to be removed, and to further reach a 1-factor solution, noise sensitivity also had to be eliminated.
Fig. 3. First and second component scores in women and men. 1, Headache; 2, Dizziness; 3, Nausea, vomiting; 4, Noise sensitivity; 5, Sleep disturbance; 6, Fatigue; 7, Irritability; 8, Feeling depressed; 9, Feeling frustrated; 10, Poor memory; 11, Poor concentration; 12, Taking longer to think; 13, Blurred vision; 14, Sensitivity to light; 15, Double vision; 16, Restlessness.
The first component was a strong indicator for PCS and when graphically investigating the importance of the first and second components for the outcome (disability and life satisfaction), the first component, but not the second, indicated whether the patients had an unfavourable outcome (Fig. 4). Women and men did not differ in this matter. In conclusion, vision-related factors and other factors scoring high on the second component are of less importance for disability and life satisfaction than are the other RPQ symptoms. The first component in women and men also predicted worse outcome in the multiple logistic regressions (Table VI).
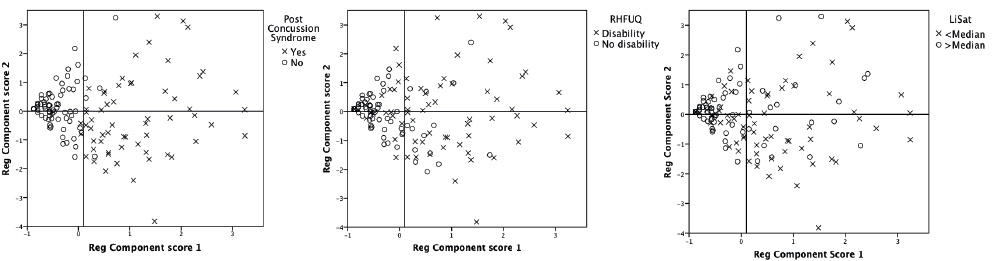
Fig. 4. Scatterplots of the component scores of components 1 and 2 in all patients coloured by post-concussion syndrome (PCS), Rivermead Head Injury Follow-Up Questionnaire (RHFUQ) and LiSat-11 scores.
|
Table VI. Multiple logistic regression analysis of the relationship between disability and life satisfaction vs possible demographic and injury-related risk factors, the RPQ-components and mean back pain score in women and men |
||||||||||
|
RHFUQ (disability/no disability) |
LiSat-11 (< median /> median) |
|||||||||
|
B |
OR |
95% CI |
p-value |
B |
OR |
95% CI |
p-value |
|||
|
Women |
||||||||||
|
Injured in traffic |
1.5 |
4.5 |
1.2–17 |
0.029a |
1.2 |
3.3 |
0.91–12 |
0.069 |
||
|
Living alone |
– |
– |
– |
– |
2.0 |
7.1 |
1.9–110 |
0.006e |
||
|
TBI after 2001 |
2.5 |
12 |
0.89–150 |
0.061 |
– |
– |
– |
– |
||
|
RPQ: Female Component 1b |
0.17 |
1.2 |
1.1–1.3 |
0.006c |
0.2 |
1.2 |
1.1–1.4 |
0.001f |
||
|
Back painb |
0.26 |
1.3 |
1.0–1.6 |
0.026d |
– |
– |
– |
– |
||
|
Constant |
–1.4 |
1.4 |
0.33 |
–0.71 |
0.49 |
0.36 |
||||
|
Nagelkerke R2 0.52 |
Nagelkerke R2 0.46 |
|||||||||
|
Men |
||||||||||
|
Living alone |
– |
– |
– |
– |
1.7 |
5.2 |
1.9–14 |
0.001i |
||
|
TBI after 2001 |
1.8 |
5.9 |
0.86–41 |
0.070 |
– |
– |
– |
– |
||
|
RPQ: Male Component 1b |
1.1 |
1.1 |
1.0–1.2 |
0.003g |
1.0 |
1.1 |
1.0–1.1 |
0.004j |
||
|
Back painb |
0.52 |
1.7 |
1.2–2.3 |
0.002h |
– |
– |
– |
– |
||
|
Constant |
1.1 |
0.01 |
0.25 |
–0.52 |
0.59 |
0.24 |
||||
|
Nagelkerke R2 0.64 |
Nagelkerke R2 0.25 |
|||||||||
|
Significant p–values are shown in bold. A positive value on B indicates that the patients with the potential risk factor had unfavourable outcome. aWomen injured in traffic had 4.5 times the odds of having disability than those who were not injured in traffic. bContinuous variables. cFor every 1-point increase in RPQ: female component 1, the women had 1.2 times higher odds of having disability. dFor every 1-point increase in the mean back pain score, the women had 1.3 times higher odds of having disability. eWomen living alone had 7.1 times the odds of having a life satisfaction below median than those who lived with someone. fFor every 1-point increase in RPQ: female component 1, the women had 1.2 times higher odds of having a life satisfaction below median. gFor every 1-point increase in RPQ: male component 1, the men had 1.1 times higher odds of having disability. hFor every 1-point increase in the mean back pain score, the men had 1.7 times higher odds of having disability. iMen living alone had 5.2 times the odds of having a life satisfaction below median than those who lived with someone. jFor every 1-point increase in RPQ: male component 1, the men had 1.1 times higher odds of having a life satisfaction below median. RPQ: Rivermead Post-Concussion Symptoms Questionnaire; RHFUQ: Rivermead Head Injury Follow-Up Questionnaire; TBI: traumatic brain injury; OR: odds ratio; CI: confidence interval; RPQ components: the component scores. |
||||||||||

Multiple logistic regression analysis
The multiple logistic regression analysis is summarized in Table VI. This revealed some possible risk factors for having any disability, as measured with RHFUQ, or life satisfaction less than the median, as measured with LiSat-11:
DISCUSSION
The present study addresses long-term consequences after MTBI. Similar studies have been conducted previously, but not presented from a gender-perspective. It is important to recognize and study differences between women and men because this might lead to future development of separate management strategies for the different sexes following MTBI. The main findings were that significant unfavourable outcome for women in comparison with men was found in the total RPQ score, back pain score, and RHFUQ score, but not in the LiSat-11 score reported 3 years post-MTBI. The MTBI group reported higher prevalence of symptoms and lower life satisfaction compared with the reference groups. PCS was found in 50% of the women and 30% of the men. Disability was found in 52% of the women and 37% of the men and satisfaction with life as a whole was found in 57% of the women and 56% of the men. In the PCA, the structure of RPQ differed between women and men, thus giving different numbers of components. In the multiple regression analysis, living alone or having a high value on the first RPQ-component were the most significant risk factors for low life satisfaction regardless of gender. Having a high value on the first RPQ component or a high back pain score were the most significant risk factors for disability in women and men.
Regarding sex differences, the general impression from our cohort is that females had more symptoms and disability compared with males, although significance was reached in only 3 of 10 RHFUQ items and 6 of 16 RPQ items. Effect sizes were small. Long-term evaluations of sex-specific outcome after MTBI have been conducted previously and the females appear to be at risk of unfavourable outcome in most studies. Regarding outcome 3 months post-MTBI, Bazarian et al. (10) concluded that adult females are at greater risk than males for having a high RPQ score. Several other studies support that females are at greater risk for adverse outcome (7, 22, 23). There are, however, also studies in which no sex differences are found (13, 24–26). Bay et al. (11) noted more depression, stress and symptoms in women up to 6 months after mild and moderate TBI. After 12 months, no sex differences remained. In the RPQ-items dizziness, noise sensitivity, fatigue, and feeling frustrated we found sex differences to be significant among the references. This is important to be aware of because it suggests that at least some differences found in our cohort could be normal rather than a result of MTBI.
Post-concussion symptoms were frequently reported. The 3 most prominent symptoms in women were headache (50%), fatigue (47%), and feeling depressed (41%); whereas in men, fatigue (30%), poor memory (27%), and headache/sleep disturbance/poor concentration (25%) were most common. Lannsjö et al. (27) investigated the prevalence of symptoms reported by 2,523 Swedes at 3 months post-MTBI. They found that fatigue (23%), headache (22%), dizziness (16%), and poor memory (16%) were the most commonly reported symptoms (27). Their figures were clearly lower than ours; however, they included children over the age of 6 years and elderly persons over 65 years of age, thus comparison is difficult. In other studies, the prevalence of the most commonly reported symptoms varies between 12% and 63% (7, 9, 24, 26, 28, 29). When synthesized, other studies report the following symptoms to be most common: 1, headache; 2, fatigue; 3, dizziness; 4, poor memory; 5, poor concentration; 6, irritability; and 7, sleep disturbance (7, 9, 24, 26, 27, 29).
The frequencies of PCS were within the span of previous findings (24, 26, 28, 30).
Presence of any disability was more common in women than in men. The answers to the RHFUQ revealed that tiredness at work, leisure activities, and workload were the domains where women and men most frequently reported problems. In both genders, a high frequency of RPQ symptoms predicted disability. Unfortunately, disability was not assessed in the reference population, thus it is difficult to evaluate the importance of the MTBI to the disability. Other studies have shown frequencies of disability using various measurements between < 10% and approximately 50% of the patients (7, 9, 22, 29–31). The association that more symptoms give more disability has also previously been shown (7, 30).
The patients of the present study had significantly lower life satisfaction on most of the LiSat-11 items compared with the references. Similar results on LiSat-11 from our area were found by Stålnacke et al. (31). Petchprapai et al. (32) in a review found the literature on quality of life (QoL) to be inconclusive; however, several studies have found MTBI patients to have adverse outcome on various measures of QoL (17, 33). The finding of no differences between women and men regarding life satisfaction, despite the fact that women had more symptoms and disability than men, were interesting. It might suggest that women and men have different patterns in translating symptoms and disability to life satisfaction.
The frequencies of back pain seem to correspond with previous studies (34, 35) and back pain was associated with disability. As previously suggested by Zhang et al. (17), if chronic back pain in MTBI patients leads to impaired life satisfaction, then treatment for back pain should be given.
Previous PCA, factor analysis, and Rasch analysis have found multiple factor-solutions when analysing the RPQ (27, 30, 36–38). Our PCA showed different number of components in women and men. On the other hand, with a few exceptions, both genders had similar distributions of the RPQ symptoms when graphically examined. Lannsjö et al.(36) concluded that sex did not affect their results. We conclude that the issue needs further clarification and we suggest that future factor analysis within the field of MTBI should be conducted separately on women and men.
This study’s strength is that it covers symptoms, disability and life satisfaction in women and men from a defined population seeking medical attention for MTBI during a 1-year period at the only hospital within a 100 km radius. Given these circumstances, we can describe the burden and consequences of hospital-registered MTBI with accuracy in our community. The major disadvantage of this type of cohort study, however, is it does not catch the 30–40% of MTBI cases not seen at the ED (3). It is reasonable to believe that persons not seeking medical attention because of their MTBI have less severe injuries and/or are less worried about their injuries than the others. This would create a selection bias that theoretically might enhance the frequency of symptoms and disability being reported.
Men had more LOC and less education than women. However, LOC is not considered an important risk factor for outcome after MTBI (7, 25), and both LOC and education were included in the multiple regression analysis and thereby controlled for. We did, however, not control for PTSD, which has been reported to be an important confounding factor (39).
Do symptoms like those in the RPQ reflect MTBI? Questions have been raised about their specificity. A review by Fayol et al. (39) states that PCS is reported in healthy subjects, general trauma patients, psychiatric patients, neurology patients, pain patients, patients with minor medical issues, and insurance claimants. Overestimation of the pre-injury health status along with symptom over-endorsement can also bias the results of questionnaires (40). It is also possible that life events during the 3-year follow-up influenced the answers to the questionnaires. However, we clearly show that our MTBI patients are bothered by more symptoms and have lower life satisfaction than the reference groups. Because we simultaneously analysed RPQ, RHFUQ, and LiSat-11, causal conclusions cannot be made.
In conclusion, this study of sex differences in late outcome following MTBI shows that symptoms, structure of symptoms, disability, and risk factors for adverse outcome differs between women and men. These aspects should be considered in future studies of MTBI. As much as 50% of the women and 30% of the men met the definition of PCS 3 years post-injury and almost all symptoms were reported more frequently in our cohort than in a reference population. Life satisfaction was also inferior in comparison with references. A high frequency of symptoms was independently associated with worse outcome in terms of disability and life satisfaction. These aspects need to be taken into consideration in the management of patients with MTBI.
ACKNOWLEDGEMENTS
The authors would like to thank Gabriel Granåsen for assisting in the statistical analysis and Asta Strandberg for helping us to administer the questionnaires. This work was supported by grants from the Swedish Association of Brain Injured and Families and the Department of Research and Development, Västernorrland County Council.
REFERENCES

