Shamay S. M. Ng, PhD1, Shirley S. M. Fong, PhD2, Carrie W. L. Chan, BSc(Hons)3,
Fiona M. C. Fung, BSc(Hons)3, Peter K. W. Pang, BSc(Hons)3, Nancy N. L. Tsang, BSc(Hons)3, Carson L. H. Yeung, BSc(Hons)3, Patrick W. H. Kwong, MSc1, Mimi M. Y. Tse, PhD4
and Eric W. C. Tam, PhD5
From the 1Department of Rehabilitation Sciences, Faculty of Health and Social Sciences, The Hong Kong Polytechnic University, 2Institute of Human Performance, The University of Hong Kong, 3Faculty of Health and Social Sciences, 4School of Nursing, Faculty of Health and Social Sciences and 5Interdisciplinary Division of Biomedical Engineering, Faculty of Engineering, The Hong Kong Polytechnic University, Hong Kong (SAR), China
OBJECTIVE: To investigate: (i) intra-rater, inter-rater and test-retest reliability of the Timed Floor Transfer Test (FTT); (ii) validity of FTT times with stroke-specific impairments and functional mobility; and (iii) cut-off time that best discriminates people with stroke from healthy older adults.
DESIGN: Cross-sectional study.
SETTING: University-based rehabilitation laboratory.
SUBJECTS: Forty-seven people with stroke and 35 healthy older adults.
METHODS: FTT completion times were measured along with a Fugl-Meyer assessment of the lower extremities (FMA-LE); Five Times Sit-To-Stand Test (FTSTST) completion times, Berg Balance Scale (BBS) scores; Timed “Up & Go” (TUG) test; and assessment using the Activities-specific Balance Confidence Scale (ABC).
RESULTS: FTT completion times showed good to excellent intra-rater, inter-rater and test-retest reliability. The minimal detectable change of FTT completion times was 7.7 s. A cut-off time of 8.8 s was found to discriminate well between people with stroke and healthy older adults. The FTT times showed significant negative correlation with FMA-LE scores and BBS scores, and significant positive correlation with FTSTS completion times and TUG times.
CONCLUSION: The FTT is a reliable clinical test for assessing the floor-transfer ability of people with chronic stroke.
Key words: balance; stroke; rehabilitation.
J Rehabil Med 2015; 47: 00–00
Correspondence address: Shamay S.M. Ng, Department of Rehabilitation Science, The Hong Kong Polytechnic University, Hong Kong (SAR), China. E-mail: Shamay.Ng@polyu.edu.hk
Accepted Jan 29, 2015; Epub ahead of print Apr 15, 2015
INTRODUCTION
In many cultures, sitting down on and rising from the floor is a basic functional task required for independent daily living. In any culture, when a fall has occurred, the ability to return to an upright position is critical (1); inability to do so is considered an indicator of frailty in elderly people (2). Tinetti et al. (2) reported that 47% of older adults studied who had fallen without injury reported an inability to get up again without assistance. This group of older fallers was prone to functional decline compared with the non-fallers or fallers who could get up independently from the floor.
Impaired muscle strength, uncoordinated joint movements and poor balance are common after stroke (3). Such impairments affect the performance of various daily activities, including rising from sitting or from the floor. In fact, the adjusted relative risk of inability to get up after a fall is 1.6 compared with non-fallers (95% confidence interval (95% CI) = 1.0–2.4) (2).
A major aim of stroke rehabilitation is to optimize the performance of motor tasks. Clinicians need reliable and valid outcome measures to document the changes in motor performance during the rehabilitation process. There are various reliable and valid outcome measures in documenting gait (4) and balance performance (5–7) in patients with stroke. However, there was no reliable and valid outcome measure for the ability to sit and rise from the floor among people with stroke.
The Timed Floor Transfer Test (FTT) was developed by Murphy and colleagues (8) to assess the functional ability of older adults to sit down on and rise from the floor, and to screen out those at greater risk of falling. The FTT measures the time necessary to sit on the floor from a standing start and then return to standing in any way the participant prefers (8). The test has been shown to have good test-retest reliability in evaluations using 13 older adults (intra-class correlation coefficient; ICC3,1 = 0.79, p ≤ 0.0001) (8). In the same study, the FTT times were also shown to be significantly correlated with the completion times of the 5-Step Test (8) (Pearson correlation coefficient [r] = –0.57), functional reach distance (r = –0.49), 50-ft walk test times (r = –0.52), and scores on the Performance-oriented Mobility Assessment for Balance (r = 0.44). In addition, the ability to complete the FTT was shown to be a significant predictor of falls among community-dwelling elderly people. It could correctly classify 95% of fallers and non-fallers among 50 community-dwelling older adults, with 81.8% correct prediction of falls and 100% correct prediction of no-falls (8).
Despite the FTT’s potential utility in stroke rehabilitation for assessing functional capacity in daily life, its intra-rater, inter-rater and test-retest reliabilities have not yet been investigated systematically with people after stroke. In addition, no published study has attempted to find a correlation between FTT completion times and stroke-specific impairment assessments, nor has there been any published investigation of the best cut-off completion time for discriminating patients with chronic stroke from healthy older adults. This study was therefore designed to examine: (i) the intra-rater, inter-rater and test–retest reliabilities of FTT completion times; (ii) the validity of FTT times with stroke-specific impairments and functional mobility including Fugl-Meyer assessment of the lower extremities (FMA-LE) scores, leg length, Five Times Sit-To-Stand Test (FTSTST) times, Berg Balance Scale (BBS)ratings, Activities-specific Balance Confidence Scale (ABC) scores, and Timed “Up & Go” (TUG) test times; and (iii) to determine the cut-off time that best discriminates people with stroke from healthy elderly subjects.
METHODS
Participants
This was a cross-sectional study. A total of 47 people with chronic stroke (31 men, 16 women; mean age 61.4 years, standard deviation (SD) 6.6 years; mean post-stroke duration 9.1 years, SD 3.5 years) were recruited. Stroke subjects were recruited from a local self-help group for persons with stroke. Subjects with stroke were included if they: (i) had had a single stroke at least 12 months previously; (ii) had an Abbreviated Mental Test score (9) of 7 or higher; and (iii) had a stable medical condition that allowed them to participate in the testing. Subjects were excluded if they had other neurological conditions, such as Parkinson’s disease, or other co-morbid disabilities, such as arthritis, which could affect proper assessment.
In addition, 39 healthy older adults (12 men, 27 women; mean age 64.2 years, SD 7.5 years) were recruited as a control group from a local community centre. Controls were recruited if they were able to perform the FTT manoeuvre once independently (with or without using hand support) and could understand verbal instructions.
The ethics committee of Hong Kong Polytechnic University approved the study protocols as meeting all of the guidelines set by the Declaration of Helsinki. Before testing began, all of the eligible individuals were informed about the purpose and procedures of the study and gave their written consent.
Procedures
Each of the people with stroke was assessed by 2 independent trained assessors (A and B) in 2 separate sessions 3–7 days apart (day X and day Y). In addition to the FTT (4), each subject was also required to complete the Fugl-Meyer lower extremity assessment (10), the FTSTST (11), a Berg Balance Scale (BBS) assessment (12), an ABC assessment (13), and the TUG (14). The order of testing was randomized by selecting cards. Two minutes of rest was allowed after each test in order to minimize any effect of fatigue. Each session lasted approximately 60–90 min. The data collection procedures are illustrated in Fig 1.
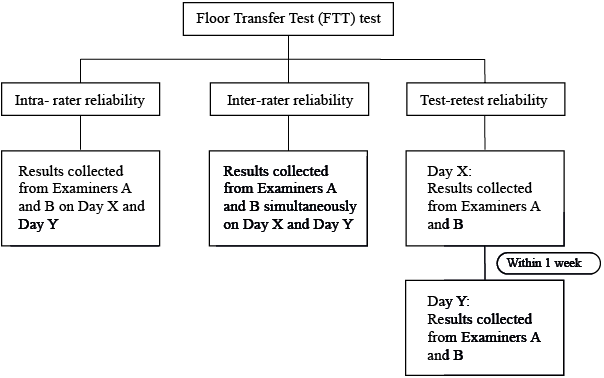
Fig. 1. Data collection and analysis.
The healthy older adults were only required to perform the FTT test in one session. The testing session lasted approximately 20 min.
Outcome measures
All outcome measures were recorded by 2 trained, independent examiners (A and B). Both examiners were trained to conduct all assessments for 2 days before data collection started. Each examiner was blinded to the other’s results.
Floor Transfer Test. At the beginning of the test, the subject stood upright on a floor mat. A chair was placed nearby to be used for support. When 1 of the examiners announced “start”, the subject transferred from a standing position to a sitting position on the floor mat, and then returned to standing in any way that he or she preferred. The time for completing one sequence was recorded in seconds. If the subject required any assistance for any part of the process, the test was stopped and this was recorded. One practice trial was performed for familiarization purposes, followed by 3 timed trials for each subject. The mean of the 3 timed trials was used for data analysis. A 2-min rest was allowed between trials in order to minimize fatigue.
Fugl-Meyer Assessment. The FMA-LE (10) is widely used with people with stroke to evaluate lower-extremity motor impairment, including reflexes, movement synergies and coordination. The FMA-LE consists of 17 items, and each item is scored on a 0–2 scale, giving a maximum possible score of 34. The higher the score, the less is the motor impairment. High inter-rater reliability (ICC = 0.83–0.95) has been reported when the FMA-LE is used with people after stroke (15).
Five Times Sit-to-Stand Test. The FTSTST measures functional muscle strength in the lower limbs (11). Subjects were required to stand up and sit down 5 times as quickly as possible (11). The test has previously shown excellent intra-rater, inter-rater and test-retest reliabilities (ICC = 0.970–0.999) with stroke survivors (16). The mean of the 3 timed trials was used for data analysis. A 2-min rest was allowed between trials to minimize fatigue.
Berg Balance Scale Assessment. The BBS is a clinical tool for assessing balance performance (12). The scale consists of 14 items, each of which is rated by an assessor using a 5-point (0–4) scale. The maximum score is 56 points. Excellent intra-rater and inter-rater reliabilities (ICC = 0.98–0.99) have been reported for people with stroke (12).
Timed “Up & Go” Test. The TUG measures functional mobility (14), and it too has been shown to have excellent test–retest reliability (ICC = 0.95) for people with chronic stroke (17). Subjects are required to rise from a chair without armrests, walk 3 m, turn around, return to the chair and sit down. The time to complete the task is recorded in seconds using a stopwatch. The mean of the 3 timed trials was used for data analysis. A 2-min rest was allowed between trials to minimize fatigue.
Activities-specific Balance Confidence Scale Assessment. A Chinese version of the ABC was used to quantify the participants’ subjective balance confidence (18). The ABC is a self-administered questionnaire of 10 items, which was developed to evaluate self-perceptions of efficacy in maintaining balance while performing a wide range of activities (13). Its scores range from 0 to 100. Good test–retest reliability (ICC = 0.85) has been demonstrated in previous studies among people with chronic stroke (19).
Statistical analysis
Data analysis was carried out using version 17.0.b of the SPSS software package (SPSS Inc., Chicago, IL, USA). Descriptive statistics were compiled describing the subjects’ characteristics. Model 3 ICCs (ICC3,1 and ICC3,2) were used to calculate the degree of intra-rater and inter-rater respectively, as either raters or subjects are considered as random effects. The (ICC2,1) model was used for test–retest reliability, as both raters and subjects are considered as random effect with single rating (20).
To identify any relationships between the FTT completion times and the other 6 test results, Pearson and Spearman’s correlation coefficients were calculated when the variables were or were not normally distributed, respectively. When multiple correlation tests were performed, the Bonferroni adjustment was applied to adjust for the alpha level. Since 5 primary outcome measures are used (FMA-LE, FTSTS, BBS, TUG and ABC), the maximum p-value considered significant was 0.01 (i.e. 0.05/5) after the Bonferroni correction. The strength of the correlation was defined in terms of the correlation coefficient obtained, with p < 0.250 described as little or no correlation, p = 0.250–0.500 defined as fair, p = 0.500–0.750 termed moderate to good, and p > 0.750 regarded as good to excellent (20).
The test-retest reliability and its standard deviation were used to calculate the standard error of measurement (SEM) and the minimum detectable change (MDC) using the following formulas (20):
![]()
Where Sx is the standard deviation of the FTT completion times and rxx is the reliability coefficient.
MDC = 1.96 * SEM *
This estimation is based on a 95% confidence interval, so 95% of the subjects demonstrated random variation less than the MDC when tested on multiple occasions (20) (Fig 1).
Two receiver operating characteristic (ROC) curves were generated on the basis of the results of the within-group and between-group comparisons. Sensitivity indicates the true-positive probability, whereas specificity indicates the false-positive probability (20). A trade-off between sensitivity and 1 minus specificity was performed using Youden’s index to obtain the FTT cut-off time, which best distinguished the healthy older adults from the people with stroke. The area under the ROC curve (AUC) then provides a quantitative measure of the accuracy of the cut-off time in distinguishing members of the 2 groups on the basis of the null hypothesis that the AUC equals 0.5 (20, 21).
RESULTS
Descriptive statistics characterizing the 47 stroke subjects and mean values of all outcome measures are presented in Tables I and II, respectively. The data presented in Table III show excellent intra-rater (ICC = 0.855–0.895), inter-rater (ICC = 1.000) and test–retest reliabilities (ICC = 0.954) for the FTT completion times of these stroke survivors. The 95% MDC of FTT completion times was 7.7 s.
|
Table I. Characteristics of the subjects |
||
|
Characteristics |
Stroke (n = 47) |
Healthy elderly (n = 39) |
|
Age, years, mean (SD) |
61.4 (6.6) |
61.2 (7.5) |
|
Gender, n (%) Male Female |
31 (66.0) 16 (34.0) |
12 (30.8) 27 (69.2) |
|
Height, cm, mean (SD) |
164.2 (7.4) |
159.8 (9.2) |
|
Weight, kg, mean (SD) |
67.2 (10.4) |
57.6 (10.8) |
|
Body mass index, kg/m2, mean (SD) |
24.7 (3.0) |
22.5 (3.6) |
|
Ppost-stroke duration, years, mean (SD) |
9.1 (3.5) |
N/A |
|
AMT score, mean (SD) |
9.7 (0.6) |
N/A |
|
Number of falls in the previous 6 months, mean (SD) |
0.2 (0.4) |
N/A |
|
Mobility status, n |
||
|
Unaided |
23 |
N/A |
|
Stick |
19 |
N/A |
|
SBQ |
3 |
N/A |
|
AMT: Abbreviated Mental Test; SBQ: small-base quadripod; SD: standard deviation; N/A: not available. |
||
|
Table II. Mean values of outcome measures |
|
|
Outcome measures |
Subjects with stroke (n = 47) Mean (SD) |
|
FTT completion time, s |
20.9 (13.6) |
|
FMA-LE score |
26.0 (4.6) |
|
FTSTS completion time, s |
17.8 (9.6) |
|
BBS score |
52.9 (2.6) |
|
TUG time |
15.7 (4.7) |
|
ABC score |
74.6 (15.5) |
|
FTT: Floor Transfer Test; FMA-LE: Fugl-Meyer lower extremity assessment; FTSTS: 5 Times Sit-To-Stand Test; BBS: Berg Balance Scale; TUG: Timed “Up & Go” test; ABC: Activities-Specific Balance Confidence scale. |
|
|
Table III. Reliability of Floor Transfer Test (FTT) completion times with stroke subjects (n = 47) |
||||
|
Reliability |
Assessor |
Day |
FTT time, s, mean (SD) |
ICC (95% CI) |
|
Intra-rater reliability-ICC(3,1) |
A |
X |
22.4 (14.6) |
0.855 (0.777–0.911) |
|
Y |
19.5 (12.9) |
0.895 (0.819–0.940) |
||
|
B |
X |
22.4 (14.6) |
0.857 (0.779–0.912) |
|
|
Y |
19.4 (13.0) |
0.893 (0.816–0.939) |
||
|
Inter-rater reliability-ICC(3,2) |
A-B |
X |
22.4 (14.6) |
1.000 (1.000–1.000) |
|
Y |
22.4 (14.6) |
1.000 (1.000–1.000) |
||
|
Test-retest reliability-ICC(2,1) |
A |
X-Y |
19.4 (12.9) |
0.954 (0.878–0.979) |
|
B |
X-Y |
20.9 (13.8) |
0.954 (0.880–0.979) |
|
|
95% CI: 95% confidence interval; ICC: intra-class correlation coefficient; SD: standard deviation. |
||||
The correlation between FTT completion times and the other measures are shown in Table IV. As all of the variables were normally distributed, Pearson correlation coefficients are reported. The FTT times showed significant negative correlation with FMA-LE scores and BBS scores and significant positive correlation with FTSTS completion times and TUG times. However, there was no significant correlation between FTT completion times and ABC scores.
|
Table IV. Correlation between Floor Transfer Test (FTT) completion times and other test results |
||
|
Outcome measures |
Correlation of FTT |
p-value |
|
FMA-LE |
–0.419* |
≤ 0.001 |
|
FTSTS |
0.650** |
≤ 0.0001 |
|
BBS |
–0.69** |
≤ 0.0001 |
|
TUG |
0.705 |
≤ 0.0001 |
|
ABC-C |
–0.31 |
0.061 |
|
*Significant at the 1% level of confidence. FMA-LE: Fugl-Meyer motor assessment for the lower extremities; FTSTS: 5 Times Sit-To-Stand test; BBS: Berg Balance Scale; TUG: Timed “Up and Go” test; ABC-C: Chinese version of the Activities-Specific Balance Confidence scale. |
||
An FTT completion time of 8.75 s was found to differentiate the elderly older adults and subjects with stroke (sensitivity 91.5%; specificity 71.8%; AUC = 0.881; p < 0.0001). The AUC analysis is shown in Fig 2.
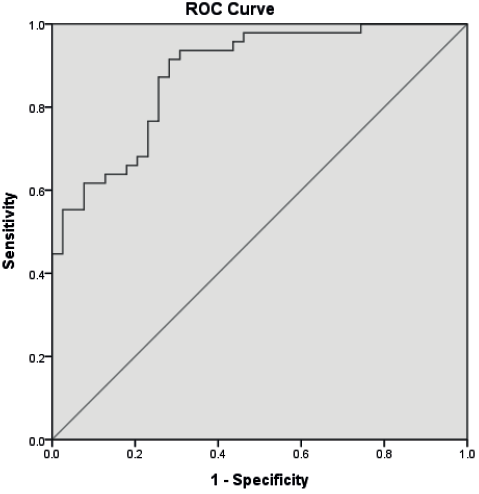
Fig. 2. Receiver operating characteristic (ROC) curves for the Floor Transfer Test (FTT) completion times of healthy older adults and people with stroke (area under the curve (AUC) = 0.881). The curved line is the ROC curve. The straight line indicates non-discriminating characteristics of the test.
DISCUSSION
Reliability of the Floor Transfer Test
Consistent with the results of previous studies with community-dwelling older adults (8), the FTT times demonstrated excellent intra-rater, inter-rater and test–retest reliabilities with these stroke survivors. Overall, the well-defined clinical protocol, the standardized assessment environment, clear instructions and the homogenous sample may have resulted in the high reliability of the FTT completion times. The subjects had had a single stroke at least 12 months previously. Changes in motor function due to spontaneous recovery following stroke and variation in motor performance were minimized by this selection criterion.
Floor Transfer Test performance
No previous study has evaluated the FTT completion times of people with stroke. The FTT completion times of these stroke subjects (mean completion time 20.9 s, SD 13.6 s) were almost 2.5 times those of the healthy controls (mean completion time 8.0 s, SD 2.8 s) (Table II). Mong and colleagues have previously reported that stroke subjects take 58.3% longer to complete the 5 times sit-to-stand task than healthy controls (16). Descending to and rising from the floor requires a certain amount of muscle strength, joint coordination, flexibility and balance (22). The subjects were required to flex their hips and knees in the course of sitting down, then extend their trunk and lower limbs when rising again, always keeping the centre of gravity within the base of support. The substantial difference in FTT completion times between the 2 groups is presumably due to stroke-specific impairments, such as lower limb control and poor balance (3). Stroke survivors often display insufficient recruitment and decreased firing frequency of muscle motor units (23, 24), localized adaption of paretic muscle fibres (25), and decreased voluntary activation (26).
The minimal detectable change (MDC) of FTT completion times was calculated according to the results of test-retest reliability (ICC = 0.954); 95% MDC would be 7.7 s. Mean FTT completion times of people with stroke was 12.9 s longer compared with healthy older adults. Therefore, the differences in FTT completion times between 2 subject groups were unlikely to be due to measuring error.
Floor Transfer Test times and other indicators
The significant negative correlation observed between the FTT completion times and the FMA-LE scores was not unexpected, as the FMA is a comprehensive quantitative measure of motor impairment following stroke, including reflexes, movement synergies and coordination (10).
The significant negative correlation with BBS scores is also not surprising. The sitting down and rising movements of the FTT involve shifting the centre of gravity with changes in the base of support. This challenged some subjects’ balance ability. Several tasks in the BBS test, such as sit-to-stand, stand-to-sit, and squatting to pick up a slipper, resemble the movements in the FTT. This similarity tends to explain the significant correlation between FTT completion times and BBS scores. Indeed, a group led by Murphy et al. (8) has previously found that FTT times correlate with the results of 5-step, tandem stance, functional reach and penny pick-up tasks, which were all similar to components of the BBS.
The FTT completion times correlated moderately with FTSTS times (r = 0.65, p ≤ 0.0001). A previous study has reported a strong negative correlation between FTSTS times and BBS scores (r = –0.83, p ≤ 0.01), and that BBS scores also predict FTSTS performance (26). It is therefore reasonable to expect significant correlation between FTT and FTSTS times.
The TUG consists of a series of transitional movements: sit-to-stand, walking, turning, and stand-to-sit (14). Lower limb muscle strength, joint co-ordination and balance are all important for performing both the FTT and TUG manoeuvres. Their similar requirements tend to explain the close relationship between FTT and TUG times observed in this study. In addition, previous studies have shown that TUG times significantly correlate with the FMA-LE scores (27) and BBS scores (28) of people with stroke. All 3 measures were shown to be significantly correlated with FTT completion times in this study.
It is surprising that the FTT completion times did not show any significant correlation with ABC scores, as significant correlation between BBS and ABC scores have been reported (19). The discrepancy in this study might be explained by the fact that the ABC scale measures feelings of confidence about maintaining balance (19), which is quite different from the physical performance measured by the FTT (12, 29). Moreover, the testing in this study was conducted in a secure and controlled environment, which is different from the real-life environment of the ABC. It may also be true that education, income and occupational status could affect one’s sense of control and eventually one’s self-perceptions of efficacy (30). Socioeconomic status was not controlled for in this study. This warrants further investigation.
Sensitivity and optimal cut-off time of the Floor Transfer Test
A test with good discriminatory ability should have both high sensitivity and high specificity (21). This study has been the first to define an optimal FTT cut-off time for distinguishing healthy older adults from those with chronic stroke. An FTT completion times of 8.8 s was found to differentiate the elderly older adults and subjects with stroke (sensitivity 91.5%; specificity 71.8%; AUC = 0.881; p < 0.0001) (Fig. 2). The AUC of 88.1% signifies the probability of identifying someone with impaired functional mobility using FTT completion times.
Study limitations
The FTT is a complex task and involves different abilities, some of which, such as proprioception and attention, were not examined individually in this study. In addition, the FTT only assesses the time to complete the task, not the quality of movement including use of other compensatory strategy.
It should be noted that the majority of the subjects with stroke were men, while the majority of controls were women. Gender differences in muscle strength (31) and the performance of functional tasks (32, 33) have been reported in previous studies, and this might have affected the results. In addition, the cut-off time recommended should be used only for differentiating the healthy older adults from people with stroke rather than for categorizing the severity of stroke impairment. In particular, these results from our small samples should not be generalized to a general stroke population, and should only be applied to those who fulfil the same inclusion criteria.
As each subject had to perform the FTT 3 times and to undergo assessment for other outcome measures, there may have been a certain degree of learning and fatigue effect, although 2-min rest periods between each trail of FTT and randomization of testing sequences by drawing lots were intended to minimize such perturbations. In addition, further studies would be warranted to investigate the optimal number of trials in FTT adopted in clinical situations in order to obtain the stable performance of FTT. A further limitation is that, as a pilot study, the sample size might be too small to detect correlations of FTT times and other outcome measures. Future studies should use a large and more homogenous sample for better prediction and regression analysis.
Conclusion
The FTT is an easy-to-administer clinical test for assessing the functional mobility of subjects with stroke. It demonstrates good intra-rater, inter-rater and test-retest reliability with stroke survivors. An FTT completion time of 8.8 s is able to differentiate reliably between people with chronic stroke and healthy adults. Further research with a larger sample size is warranted to investigate the correlation between FTT times, stroke-specific impairments, balance and functional mobility in order to increase the generalizability of the results.
ACKNOWLEDGEMENTS
This study was supported by General Research Grant 562413 from Hong Kong’s Research Grants Council to Dr Shamay S. Ng and her team.
The authors would like to express their sincere thanks to Mr David Fong Yat-Fai for his assistance in recruiting subjects and data collection.
REFERENCES

