Andreas Vigelsø, MSc1*, Martin Gram, PhD1*, Caroline Wiuff, MSc1, Jesper L. Andersen, PhD2, Jørn W. Helge, PhD1 and Flemming Dela, MD, DMSci1
From the 1XLAB, Center for Healthy Aging, Department of Biomedical Sciences, University of Copenhagen, 2Section of Molecular Physiology, Institute of Sports Medicine Copenhagen, Center for Healthy Aging, University of Copenhagen, Bispebjerg Hospital, Copenhagen, Denmark. *These authors contributed equally.
OBJECTIVE: To determine the effect of aerobic retraining as rehabilitation after short-term leg immobilization on leg strength, leg work capacity, leg lean mass, leg muscle fibre type composition and leg capillary supply, in young and older men.
Subjects and design: Seventeen young (23 ± 1 years) and 15 older (68 ± 1 [standard error of the mean; SEM] years) men had one leg immobilized for 2 weeks, followed by 6 weeks’ bicycle endurance retraining.
METHODS: Maximal voluntary contraction, leg work capacity (Wmax), and leg lean mass by dual energy X-ray absorptiometry were measured at inclusion, after immobilization and after 3 and 6 weeks’ retraining. Muscle biopsies were evaluated for fibre type, fibre area, and capillarization.
RESULTS: Immobilization decreased maximal voluntary contraction (–28 ± 6% and –23 ± 3%); Wmax (–13 ± 5% and –9 ± 4%) and leg lean mass (only in young, –485 ± 105g) in young and older men, respectively. Six weeks’ retraining increased maximal voluntary contraction (34 ± 8% and 17 ± 6%), Wmax (33 ± 5% and 20 ± 5%) and leg lean mass (only in young 669 ± 69 g) in young and older men, respectively, compared with the immobilized value.
CONCLUSION: Short-term leg immobilization had marked effects on leg strength, and work capacity and 6 weeks’ retraining was sufficient to increase, but not completely rehabilitate, muscle strength, and to rehabilitate aerobic work capacity and leg lean mass (in the young men).
Key words: immobilization; rehabilitation; older adults; lean leg mass; fibre type distribution; ageing; aerobic training.
J Rehabil Med 2015; 47: 00–00
Correspondence author: Andreas Vigelsø, XLAB – Center for Healthy Aging, Department of Biomedical Sciences, Panum Institute, 12.4, Blegdamsvej 3b, DK-2200 N, Denmark. E-mail: avhansen@sund.ku.dk
Accepted Jan 29, 2015; Epub ahead of print Apr 21, 2015
INTRODUCTION
A reduction in lean body mass (LBM), strength and aerobic capacity is one of the most marked changes associated with ageing (1, 2). Furthermore, ageing is also associated with a shift in the distribution of activity, such that less time is spent on moderate to vigorous intensity physical activity and more time is spent on light intensity activity (3). Collectively, this may contribute to frailty and may limit independent living (4). In addition, disease or injuries that can cause short-term immobilization are a further threat to independent living for older individuals.
Despite its clinical importance, few studies have examined older individuals after immobilization (5–8). Three studies compared immobilization of young and older individuals and reported that young and older men display similar loss of strength (5, 8, 9) and that strength declines even with short-term immobilization (9), but with an attenuated decline in leg lean mass (LLM) in older individuals (8).
At the cellular level, immobilization decreases muscle fibre cross-sectional area (CSA) (10) of both type I and type IIa and IIx fibres in young men (11–13), whereas in older men immobilization leads to atrophy of only type IIa fibres (11).
In addition, the overall muscle fibre phenotype of older individuals is relatively slower and more aerobic (2, 14, 15), but with a lower capillary supply (16) compared with that found in young individuals.
Endurance training can counteract age- and immobilization-related muscle loss by affecting angiogenesis, fibre type distribution and fibre size. Angiogenesis increases with aerobic training and the adaptability is maintained with ageing (16, 17). With endurance training the relative fibre type distribution shifts from type IIx towards type IIa (16, 18, 19). However, there is no consensus on the effects of endurance training on muscle fibre size; studies have reported no change (17), hypertrophy of fibre type IIa and IIx (19), hypertrophy of both type I and II (16), increased type I and decreased type IIx (18), and even atrophy of both type I and II fibres (20).
The overall adaptability of skeletal muscle to endurance training is maintained with ageing (16), but the older individuals normally have lower initial lean mass, strength and aerobic capacity (1, 2) and, possibly, a need for longer rehabilitation (11).
Strength training is the first choice of rehabilitation for muscle atrophy. This has been reported fully to restore muscle strength and LLM in both young and older men, albeit the older men needed longer fully to restore muscle mass (11). However, there is a lack of knowledge as to whether aerobic training can restore muscle mass and strength to baseline. This knowledge is advantageous for therapists, as not all individuals may enjoy or adhere to only one protocol.
The aim of this study was to investigate the effect of 2 weeks’ immobilization and subsequent rehabilitation with 6 weeks’ aerobic training on LLM, maximal voluntary contraction (MVC), and leg aerobic capacity (Wmax) in young and older men. At the cellular level we investigated fibre size, fibre type distribution and capillarization.
METHODS
Subjects
Seventeen young and 15 older healthy, untrained subjects were included. Inclusion criteria were age: 20–27 years and 60–75 years, for the young and older men, respectively. Furthermore, maximal oxygen uptake (VO2max), body mass index (BMI) and body fat percentage were representative for their age group according to the Danish Health Examination Survey (DANHES) (21) (Table I). Both young and older subjects were clinically screened prior to inclusion.
Some of the subject characteristics have been published previously, but in a different context, in which interleukin 6 (IL-6) and tumour necrosis factor alpha (TNF-α) release during acute exercise (22), skeletal muscle respiratory capacity (23) and plasma lipid profile (24) were investigated. The present study focuses on the effects of aerobic retraining after short-term immobilization on rehabilitation of skeletal muscle MVC, LLM, Wmax, fibre type, size and distribution, and capillarization in healthy young and older men.
|
Table I. Subject characteristics |
|||||||||||
|
|
Inclusion |
2 weeks’ immobilization |
6 weeks’ aerobic training |
||||||||
|
Young men (n = 17) Mean ± SEM |
Older men (n = 15) Mean ± SEM |
Young men Mean ± SEM |
Older men Mean ± SEM |
Young men Mean ± SEM |
Older men Mean ± SEM |
||||||
|
Age, years, |
23 ± 1** |
68 ± 1 |
|
|
|
|
|
||||
|
Weight, kg |
80 ± 2 |
83 ± 2 |
80 ± 2 |
83 ± 2 |
79 ± 2 |
82 ± 2 |
|||||
|
Fat, % |
21 ± 1** |
28 ± 1 |
21 ± 1** |
29 ± 1 |
19 ± 2** |
28 ± 1 |
|||||
|
BMI, kg/m2 |
24 ± 1** |
27 ± 1 |
24 ± 1** |
27 ± 1 |
24 ± 1** |
27±1 |
|||||
|
VO2max, ml O2/min/kg |
48 ± 1** |
|
33 ± 2 |
|
44 ± 1*,** |
|
32 ± 2* |
52 ± 1** |
|
36 ± 2 |
|
|
Fibre type, % |
|||||||||||
|
Type I |
50 ± 3 |
52 ± 4 |
52 ± 4 |
49 ± 3 |
53 ± 4 |
49 ± 4 |
|||||
|
Type IIa |
34 ± 2 |
33 ± 3 |
36 ± 3 |
35 ± 2 |
38 ± 4 |
35 ± 3 |
|||||
|
Type IIx |
17 ± 3 |
|
15 ± 2 |
|
12 ± 2 |
|
16 ± 2 |
9 ± 2*** |
|
15 ± 4 |
|
|
*p < 0.05 vs. Inclusion and Training, **p < 0.05 young vs. older men ***p < 0.05 vs. Inclusion. SEM: standard error of the mean; BMI: body mass index; VO2max: maximal oxygen uptake. |
|||||||||||
Anthropometric measurements
At inclusion, after immobilization, and after 2, 4 and 6 weeks’ retraining body composition was determined by dual energy X-ray absorptiometry (DXA) scanning (Lunar iDXA, GE Medical Systems, Madison, USA) and a graded VO2max test was performed as described previously (22–24). To assess daily activity level a combined triaxial accelerometer (Actitrainer, Actigraph, Pensacola, FL, USA) was worn on the right hip for 3 consecutive days at inclusion, during the immobilization and during the aerobic retraining (23). The cut-points for activity categories were used as described previously (25, 26): sedentary (0–100 counts/min (cpm)), light activity (101–1951 cpm), moderate activity (1,952–5,724 cpm) and vigorous activity (> 5,724 cpm).
Muscle function measurements
An MVC and a Wmax test were conducted in a custom-designed ergometer equipped with strain gauges (Fig. 1). Participants were placed in a seat and secured with belts to minimize movement. The subjects wore custom-made boots connected to a metal lever at the level of the medial malleolus, connected via a rigid steel bar to a strain-gauge load cell (Dan-Transducer dt8220, Gilleleje, Denmark), which was connected to an instrumentation amplifier (National Instruments, NI cDAQ-9174, Austin, TX, USA). The tibia moment arm was measured (from the point of fixation to the lateral epicondyle of the knee) to calculate the knee extensor moment. The knee was positioned in a 90° angle. After 10 min warm-up followed by 2–3 submaximal and maximal trials, each subject performed 3–4 knee extensions at maximal voluntary effort with an interval of approximately 1 min between repetitions. The subjects were verbally encouraged throughout the repetitions, and the best result was used for further analysis. All tests with a visible initial counter-movement were discarded from the analysis. The Wmax test has been described previously (22). In brief, a custom-made 1-legged knee-extension ergometer was used to evaluate the isolated work capacity of the leg in a graded exercise test. Subjects were familiarized with the kicking exercise and the MVC prior to the tests.
Study design
After the initial screening procedure, the subjects reported to the laboratory in the morning in an overnight fasted state. A muscle biopsy was obtained from both legs after local anaesthesia (lidocaine 5 mg/ml, Amgros I/S, Copenhagen, Denmark) using the Bergström needle modified with suction. A part of the biopsy was immediately frozen in liquid nitrogen. Another part was mounted in embedding medium (VWR chemicals, Herlev, Denmark), rapidly frozen in isopentane. The biopsies were stored at –80°C for further analysis.
Immobilization
One leg was chosen by randomization for 2 weeks’ immobilization (IM) with a DonJoy® knee brace (DJO Nordic, Malmö, Sweden) locked at 60° for 14 days. The other leg served as a control (CON). The subjects used crutches and were repeatedly instructed not to engage in any weight-bearing activity with the immobilized leg; however, they ambulated freely during the entire period. After 2 weeks, the subjects once again reported to the laboratory after overnight fasting. The brace was removed, and a second biopsy was obtained (Fig. 1).
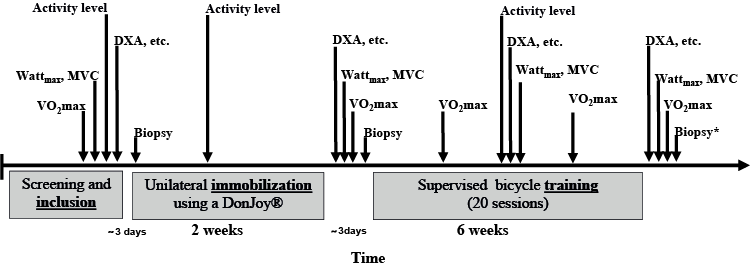
Fig. 1. Experimental outline. DXA: dual energy X-ray absorptiometry; MVC: maximal voluntary contraction. Biopsies were obtained from both legs, *except after retraining where a biopsy was only obtained from the previously immobilized leg.
Retraining
Each subject underwent 6 weeks’ of supervised ergometer bicycle training (Ergomedic 839e, Monark Exercise AB, Vansbro, Sweden) consisting of 12 sessions of continuous and 8 sessions of interval training (48–58 min effective exercise per session). The subjects trained 3 times/week for the first 4 weeks and 4 times/week for the last 2 weeks. The training started with 2 cycles of 2 continuous training sessions followed by one interval training session. Thereafter, the continuous and interval training was interspersed 1:1. Heart rate was collected by heart rate monitors during the exercise (Polar RS400, Polar Electro Oy, Kempele, Finland). During the continuous training the subjects’ mean exercise was 84 ± 1 [SEM] % and 85 ± 1% of HRmax (measured for the last 10 min of the session), while during the interval training sessions (5–10 × 3–4 min intervals+2 min break) the relative intensity at the last minute of the intervals was 89 ± 1% and 90 ± 1% HRmax in young and older subjects, respectively. After 2, 4 and 6 weeks’ retraining the subjects performed a VO2max in order to adjust the training intensity and to evaluate progress. Three days after the last training session, the subjects reported to the laboratory and the final biopsy was obtained from the previously immobilized leg (Fig. 1).
Biopsy analysis
Histochemical ATPase and immunohistochemical staining. Serial transverse sections (10 µm) were cut in a cryostat (Leica, Ballerup, Denmark) at –20°C and mounted on poly-L-lysine-coated glass slides (SuperFrost© Plus, Braunschweig, Germany) for histochemical and immunohistochemical staining. Muscle fibre types were determined using a myosin ATPase staining method (27). The slides were stained at pH 9.4 after pre-incubation at pH 10.3, 4.53, 4.57 and 4.37. Cross-sections of the biopsies were stained with Ulex europaeus I lectin (Sigma-Aldrich, Copenhagen, Denmark) and collagen type IV (Dako, Glostrup, Denmark) antibodies. The methods have been described previously (28). The secondary antibodies were: biotinylated goat anti-rabbit antibody and biotinylated goat anti-mouse antibody (Dako). Computer image analysis was performed using the software program Tema version 1.00 (CheckVision Aps, Denmark). The analysis included: muscle fibre classification (type I, II and IIx), fibre type cross-sectional area (CSA), fibre type distribution, capillaries per fibre (C:F ratio) and capillaries around a fibre (CAF). The total number of muscle fibres counted for the fibre type distribution was 140±4 fibres (range from 61 to 239 fibres) and 104±4 fibres (range from 51 to 197 fibres) for fibre size and capillarization.
Western blotting. The method has been described previously (29). In brief, the biopsies were homogenized in cold radio-immunoprecipitation assay (RIPA) buffer. Twenty micrograms of protein was separated on 12% Criterion TGX Stain-Free polyacrylamide sodium dodecyl sulphate gels (Criterion, Bio-rad, Copenhagen, Denmark). Thereafter, the gels were activated with ultraviolet (UV) light for 5 min in an LAS4000 image analyser (GE Healthcare, Little Chalfont, UK) and transferred to a polyvinylidene fluoride (PVDF) membrane (Bio-Rad, Copenhagen, Denmark). After transfer another 1 s image was taken with UV light to visualize protein content. The primary antibody was anti-vascular endothelial growth factor (VEGF) (Abcam, Cambridge, UK) and a horseradish peroxidase conjugated secondary antibody was used (Dako). Blots were developed in ECL detection reagents (GE Healthcare) and visualized with an LAS4000 image analyser (GE Healthcare). The images of the membranes and stain-free membranes were quantified by ImageQuant TL software version 7.0 (GE Healthcare). The intensity of the band of interest was normalized to total protein measured by stain-free fluorescence. Furthermore, in order to compare samples loaded on different gels all samples are presented as relative to the same calibrator (a pool from all samples) loaded in a minimum of 3 lanes on all gels.
Ethical approval
The study was performed according to the principles of the Declaration of Helsinki and was approved by the Ethics Committee of Copenhagen (H-4-2010-85). All subjects were carefully informed (verbal and written material) about the possible risks and discomfort involved before written consent to participate was obtained. Subjects received remuneration for participation and were reimbursed for all transportation during the immobilization and to/from meetings at the department.
Statistical analysis
Effects of group (young and older men), leg (IM and CON), intervention (inclusion, after; immobilization, 3 and 6 weeks’ retraining) and possible interactions (group × intervention × leg), were investigated using a mixed model analysis of variance (ANOVA) with least squares post hoc tests followed by a Tukey-Kramer adjustment. Systematic effects in the model were group, leg and intervention with random levels for subject nested within group. For correlations between different variables Pearson’s product moment correlation coefficient (R2) and corresponding p-value were obtained. Data that were not normally distributed or had unequal variance were log-transformed before statistical analysis. In the case of randomly missing values, the Satterthwaite approximation was used. The level of significance was set at p < 0.05. Statistical analyses were conducted in SAS Enterprise Guide 4.3 (SAS Institute, Cary, NC, USA). It was calculated that the minimum number of participants needed to obtain sufficient statistical power to detect a difference in LLM between interventions of 20% was 15 in each group. Data are presented as mean ± SEM. At inclusion, the 2 legs did not differ in any variable. Thus, to increase power and reduce variability in the fibre type, western blot and capillarity analysis the 2 legs were pooled at inclusion.
RESULTS
Subjects’ characteristics and activity pattern
Bodyweight, BMI, body fat percentage and VO2max have been reported previously (23) (Table I).
Furthermore, we have reported previously that there was no difference in daily activity level in absolute cpm between the young and older men (23). Here we divided the activity into relative time spent at different intensities. We observed that the young men spent more time in sedentary activities compared with the older men, whereas the older men spent more time in light activities, with no difference between the groups in time spent in moderate and vigorous activities (Fig. 2). Furthermore, the relative amount of time spent in sedentary activities was higher, and the amount of time spent in light activities decreased during immobilization in both groups compared with inclusion and during retraining (Fig. 2).
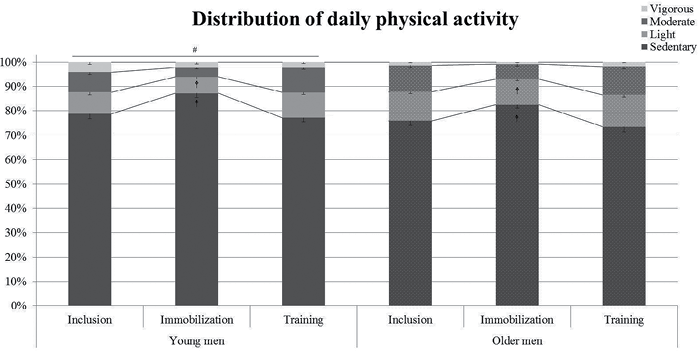
Fig. 2. Young and older men had their daily physical activity pattern recorded by triaxial accelerometer before (Inclusion), during 2 weeks’ Immobilization, and during 6 weeks’ aerobic retraining (Training) (23). The cut-points for activity categories were used as described previously (25, 26): sedentary (0–100 counts/min (cpm)), light activity (101–1,951 cpm), moderate activity (1,952– 5,724 cpm) and vigorous activity (> 5,724 cpm). All measurements were in 3 consecutive days. #p < 0.05 vs. older men in sedentary and light intensity. &p < 0.05 vs. “Inclusion” and “Training” in the same group. Data are mean ± standard error of the mean (SEM).
Muscle function
MVC was higher in the young compared with the older men (main effect) throughout the intervention and the groups responded similarly to the intervention. There was no difference between CON and IM leg at inclusion. Immobilization caused a –28 ± 6% and –23 ± 3% decrease in MVC in IM for the young and older men, respectively (main effect). With retraining, MVC increased in IM after 3 (35 ± 8% and 25 ± 4%) and 6 weeks (34 ± 8% and 17 ± 6%, young and older men, respectively) compared with after immobilization. However, MVC in IM was lower after 6 weeks’ retraining compared with inclusion in both groups. Furthermore, MVC in IM was lower than CON after immobilization in both groups (main effect). MVC of the CON leg decreased with immobilization (–10 ± 4% and –10 ± 5%) for the young and older men, respectively, and after 3 and 6 week’s retraining the MVC did not differ from the inclusion value in CON (Fig. 3A).
For Wmax there was an interaction between intervention and leg, with no difference between the young and older men, respectively: Wmax decreased (main effect) in the immobilized leg with immobilization (–13 ± 5% and –9 ± 4%) and increased after 3 (19 ± 5% and 23 ± 4%) and 6 weeks’ retraining (33 ± 5% and 20±5%, in young and older men, respectively) (Fig. 3B). In addition, 3 and 6 weeks’ retraining increased Wmax in the CON leg to a higher level than at inclusion (main effect) (Fig. 3B).
Leg lean mass
In LLM there was a 3-way interaction between leg, group and intervention. LLM decreased in the young men after immobilization (–485 ± 105 g) and returned to inclusion values after 3 (436 ± 88 g) and 6 (669 ± 69 g) weeks’ retraining compared with after immobilization (Fig. 3C). LLM in the older men did not change with immobilization (–245 ± 62 g, p = 0.08) or 6 weeks’ retraining (201 ± 75 g) (Fig. 4C). Furthermore, LLM was higher in the young than in the older men throughout the intervention in CON. Likewise, LLM in IM was higher in the young compared with the older men at inclusion, 3 and 6 weeks’ retraining, but was not higher after the immobilization period. In young and old men there was a correlation between LLM at inclusion and the decrease in LLM with immobilization (p < 0.05, R2 = 0.24, Fig. 3D) and a correlation between the amount of LLM lost with immobilization and the increase in LLM with 6 weeks’ retraining (p < 0.05, R2 = 0.22, data not shown).

Fibre and capillary morphology
At inclusion, there was no difference in relative fibre type distribution between the young and older men (Table I). In the young men, the relative type IIx distribution was lower after 6 week’s retraining compared with the inclusion value (Table I). In addition, the area of type I fibres were larger (main effect) in the older men compared with the young men (Fig. 4A). The fibre size of type II fibres decreased in response to immobilization (Fig. 4B) and both type I and II fibre area increased with 6 week’s retraining (Fig. 4, main effect).

There was no difference in capillary density between the groups and no effect of the intervention (data not shown). After immobilization the C:F ratio decreased (–10 ± 8% and –10 ± 5% for the young and older men, respectively, main effect) in IM compared with inclusion and retraining (Fig. 5A). The capillaries around all fibres (CAFtotal) decreased with immobilization (–12 ± 7% and –6 ± 4%) and increased with 6 week’s retraining (18 ± 8% and 4 ± 2% for the young and older men, respectively, Fig. 5B). In addition, capillaries around fibre type I(CAFI) in IM increased with retraining compared with the control leg (main effect, data not shown).
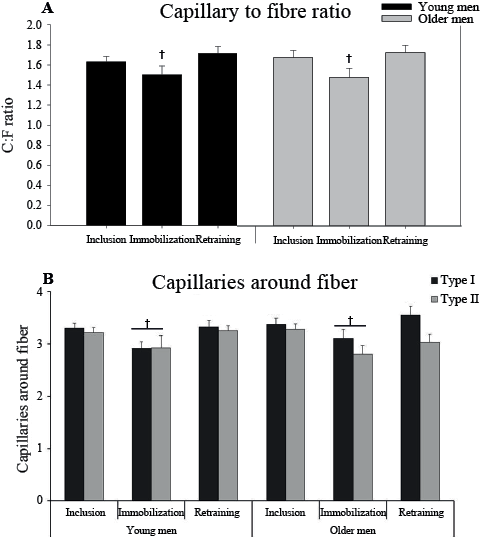
Fig. 5. (A) Capillary to fibre ratio (C:F) and (B) Capillaries around fibre (CAF) type I and type II at inclusion, after 2 weeks’ immobilization, and 6 weeks’ retraining in the immobilized leg in young and older men. †p < 0.05 immobilization vs. inclusion and retraining (main effect). In B, the line indicates a difference in CAFtotal. Data are mean ± standard error of the mean (SEM).
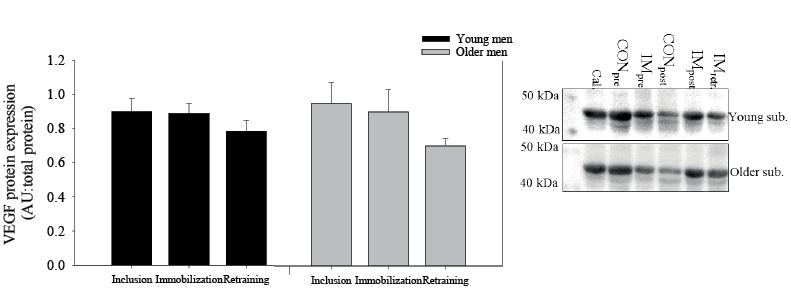
There was no difference in vascular endothelial growth factor (VEGF) protein expression between the young and older men. Furthermore, immobilization and retraining did not change VEGF protein expression (Fig. 6).
DISCUSSION
The main finding of this study was that 6 weeks’ aerobic retraining was sufficient to increase, but not rehabilitate, muscle strength (MVC). Furthermore, aerobic work capacity (Wmax), and LLM (only in the young men) was rehabilitated after the loss induced by 2 weeks’ immobilization of 1 leg in young and older men. In addition, the rehabilitation by aerobic training improved the metabolic profile of both groups (i.e. decreased whole-body fat mass, increased VO2max, leg aerobic work capacity (Wmax) and capillarization). Finally, there was a relationship between the amount of LLM at inclusion and LLM lost with immobilization and, conversely, a relationship that indicated that the subjects that lost most LLM with immobilization also gained most LLM with aerobic retraining. At the cellular level leg immobilization decreased and aerobic training restored capillarization (i.e. CAFI, CAFII and C:F ratio) and fibre size (CSA) in both groups, with no change in fibre type distribution. This indicates that adaptability to these variables is maintained with ageing. Collectively, these findings show that, after short-term immobilization, aerobic retraining can be considered as a partial alternative, combined with strength training, without impeding the rehabilitation process. This is of particular value to individuals at risk of lifestyle-related diseases, who could consider aerobic training as rehabilitation after a short period of immobilization-induced muscle atrophy.
The subjects were representative for their age group. Consequently, the 2 groups had different whole-body VO2max, MVC, BMI, and whole-body fat percentage at inclusion. Notably, in local leg parameters, there was no difference between the young and older group in aerobic work capacity of the legs (Wmax), muscle fibre size, distribution or capillarization (CAF and C:F). A possible explanation may be that the whole-body variables are impaired by age independent of the physical activity level, whereas local muscle variables are dependent on the physical activity level. This is supported by the fact that the 2 groups did not differ in daily physical activity level in absolute cpm during the entire intervention (23). Furthermore, the 2 groups did not differ in the relative amount of time spent during moderate and vigorous activity, which could have been a confounding factor (3). Therefore, it is likely that daily activity level, rather than ageing per se, could be the determinant for the local leg variables investigated in this study.
Here we confirm the observation that older men have attenuated loss of LLM by 14 days’ immobilization compared with young men (8). This was seen despite the fact that both groups in our study decreased and increased in muscle fibre size with the intervention. Furthermore, the same study (8) reported an attenuated increase in muscle mass with strength training in older men compared with young men. This is in accordance with our observation that 6 weeks’ aerobic retraining increased LLM in the young, but not the older, men. The underlying mechanisms for this should be elucidated further. The lack of a decrease in LLM in the older men with immobilization may have been masked by the applied statistical model. In the older men, there was a borderline (p = 0.087) decrease in LLM with immobilization when corrected for mass significance. When a 3-factor analysis is applied the correction for mass significance results in a rather conservative estimate because of the numerous comparisons and, indeed, the uncorrected p-value for the decrease in LLM in the older men was p = 0.002. In support of this, Fig. 3D reveals that all but one older subject lost LLM with immobilization.
In line with our results, other studies have reported lower MVC in older compared with young subjects (8, 9). In addition, we demonstrate that MVC decreased in the immobilized leg in both groups, which supports the findings reported previously (8, 10). The MVC in the control leg in our subjects decreased after immobilization. This indicates that our subjects did not maintain normal activity level in the control leg, which was also indicated by a borderline decrease in MVC in the young men found in (30) but not in (8).
MVC increased with 3 weeks’ aerobic retraining in IM compared with after immobilization and did not differ from inclusion. In contrast to the study by Suetta et al. (8), in which strength training was used as rehabilitation modality, we found that after 6 weeks’ retraining the MVC was lower in the immobilized leg compared with inclusion, but was higher than after immobilization. Whether the decrease in MVC from 3 to 6 weeks is a direct cause of immobilization is unclear, but not unlikely. However, the decrease in MVC could also be due to daily strength-like activities being down-prioritized during the intensive aerobic training the last 2 weeks, where the training frequency increased to 4 sessions/week compared with 3 sessions/week of approximately 55 min per session. This is supported by the finding that the control leg followed the same pattern, albeit not significantly. This indicates that intensive endurance training 4 times/week in untrained individuals may impair explosive leg strength. Whether the increase in MVC after 3 weeks’ retraining is due to the restoration of the daily activity level or the aerobic training is not known. In line with this, we cannot conclude that aerobic retraining alone can rehabilitate the loss in MVC induced by 14 days’ immobilization, as was shown in the study by Suetta et al. (8) using strength training. However, aerobic training and restoration of daily activity level can increase muscle strength after immobilization. Therefore, aerobic training may only be considered as a partial alternative to strength training.
No alteration in the muscle fibre distribution was seen after immobilization, which is in agreement with previously reported data using similar duration of immobilization (11, 13). In contrast, other studies using immobilization in young (3 weeks immobilization) (12) and older (3.5 months immobilization) men (31), or after 11 days’ space flight (32) demonstrated a shift from slow-to-fast MHC isoforms (type I fibres to type II fibres). However, given a turnover time of approximately 3 weeks for the MHC isoform proteins (33), it is very likely that changes in MHC distribution, due to physical inactivity as well as retraining, would need several weeks, or even months, to be fully apparent (34). However, we did observe a decrease in type IIx percentage in the young group after 6 weeks’ training, which is considered a classical training adaptation (16, 18, 19). This indicates that the adaptability to change fibre types is higher in young subjects.
Furthermore, we observed that immobilization decreased type II fibre size, which is in accordance with another study reporting that this occurs already after 4 days (~10% in both young and older men) and was decreased further after 14 days’ (~20% and ~13%, for young and older men, respectively) unilateral immobilization (7). These authors also reported that the decrease following 14 days’ immobilization was prominent in type II fibres, but also a small decrease in type I fibre size was found (7). The latter is in contrast to our finding of no change in type I fibre size. Here it is shown that the loss in fibre type II size with 2 weeks immobilization can be rehabilitated by 6 weeks of aerobic retraining. Furthermore, we observed that capillarization (i.e. CAFtotal and C:F) was impaired after immobilization compared with inclusion and retraining in both groups. The increase with retraining was expected, since both the duration of 6 weeks and the intensity of the retraining have been shown to increase CAF and C:F (19, 20). These findings imply that immobilization even for a short period induces decreased capacity to supply nutrients to the affected tissues.
We observed that VEGF protein expression did not differ between groups and the intervention. The first is in contrast to what is observed in 1 (35) but not another (36) study. The latter is in contrast to our observation that the capillarization (i.e. CAF and C:F) increased with retraining. Hence, an increased VEGF protein expression would have been expected to increase angiogenesis. However, other studies have shown that VEGF protein expression does not change with aerobic training (37, 38). It is unclear, but a study in mice has shown that VEGF protein expression increased after 10 days, but decreased below pre-value after 28 days’ aerobic training (39). It is likely that this pattern is also present in humans, but this needs to be elucidated.
Study limitations
This study included subjects who were representative for their age group. However, the clinical relevance for rehabilitation may be more pronounced in the proportion of the older population that is less physically active. Hence, our approach is applicable to a large proportion of the population, but possibly not to the weakest. However, for ethical reasons, it is not feasible to immobilize frail individuals for 2 weeks. Furthermore, the experimental model is clinically relevant in mimicking leg injuries with short recovery (e.g. muscle or minor ligament injuries). We recognize that immobilization of an uninjured leg may not provide full transferability to real-life rehabilitation, but the model illustrates some of the negative consequences associated with this type of injury.
Conclusion
Aerobic retraining was sufficient to rehabilitate LLM (in the young men) and Wmax. MVC increased with retraining but was not fully rehabilitated and did not differ in the timeneeded for rehabilitation between young and older men. Thus, after short-term immobilization, aerobic retraining can be considered as a partial alternative in combination with strength training without impeding the rehabilitation process. Moreover, aerobic retraining could be considered due to the beneficial effect of counteracting the increased risk of lifestyle-related diseases in the older population and may be advantageous for therapists, as not all individuals will enjoy or adhere to a single protocol.
ACKNOWLEDGEMENTS
This work was carried out as a part of the research programme of the UNIK: Food, Fitness & Pharma for Health and Disease. The UNIK project is supported by the Danish Ministry of Science, Technology and Innovation. This study was supported in part by The Nordea Foundation, A.P. Møller and Hustru Chastine Mc-Kinney Møllers Foundation and Aase and Ejnar Danielsens Foundation. We thank Jesper Nørregaard, Michael Taulo Lund, Helene Pape Pedersen and Dace Reihmane for their assistance.
REFERENCES

