Karin Verkerk, PT, PhD1,2,3, Pim A. J. Luijsterburg, PT, PhD2, Annelies Pool-Goudzwaard, MT, PhD4, Martijn W. Heymans, PhD5,6,7, Inge Ronchetti, MSc3, Harald S. Miedema, MD, MSc1 and Bart W. Koes, PhD2
From the 1Rotterdam University of Applied Sciences, 2Department of General Practice, Erasmus MC, University Medical Center, 3Spine & Joint Centre, Rotterdam, 4Research Institute MOVE, Faculty of Human Movement Sciences, VU University, 5EMGO Institute for Health and Care Research, VU University Medical Centre, 6Department of Methodology and Applied Biostatistics, VU University, Institute for Health Sciences and 7Department of Epidemiology and Biostatistics, VU University Medical Centre, Amsterdam, The Netherlands
OBJECTIVE: To investigate the clinical course of, and prognostic factors for, work-participation in patients with chronic non-specific low back pain.
METHODS: A total of 1,608 patients with chronic non-specific low back pain received a multidisciplinary therapy and were evaluated at baseline and 2-, 5- and 12-month follow-ups. Recovery was defined as absolute recovery if the patient worked 90% of his contract hours at follow-up. Potential factors were identified using multivariable logistic regression analysis.
RESULTS: Patients reported a mean increase in work-participation from 38% at baseline to 82% after 12 months. Prognostic factors for ≥ 90% work-participation at 5 months were being married (odds ratio (OR) 1.72 (95% confidence interval (95% CI) 1.12–2.65)), male (OR 1.99 (95% CI 1.24–3.20)), a higher score on disability (OR 1.00 (95% CI 0.997–1.02)) and physical component scale (Short-Form 36 (SF-36)) (OR 1.05 (95% CI 1.02–1.07)), previous rehabilitation (OR 1.85 (95% CI 1.14–2.98)), not receiving sickness benefits (OR 0.52 (95% CI 0.24–1.10)) and more work-participation (OR 4.86 (95% CI 2.35–10.04)). More work-participation (OR 5.22 (95% CI 3.47–7.85)) and male sex (OR 1.79 (95% CI 1.25–2.55)) were also prognostic factors at 12-month follow-up.
CONCLUSION: At 12 months 52% of patients reported ≥ 90% work-participation. The strongest prognostic factor was more work-participation at baseline for the recovery of chronic non-specific low back pain.
Key words: low back pain; course; prognosis; return to work; prospective cohort study; musculoskeletal disorder.
J Rehabil Med 2015; 00: 00–00
Correspondence address: Karin Verkerk, Rotterdam University of Applied Sciences, Rochussenstraat 198, 3015 EK Rotterdam, The Netherlands. E-mail: k.verkerk@hr.nl
Accepted Jun 10, 2015; Epub ahead of print Aug 24, 2015
INTRODUCTION
Much of the current research into low back pain (LBP) focuses on progression from the acute stage to a chronic stage, and on prognosis within the chronic stages (1, 2). The natural course of LBP affects the ability to function in both work and personal life (3, 4). Less than two-thirds of patients who develop chronic non-specific low back pain (CNSLBP) recover within 12 months (3).
In an Australian study (5) recovery was determined from measures of pain intensity, disability, and work status. This study showed that the prognosis is less favourable for those who have taken previous sick leave for LBP, have more disability or severe pain intensity at onset of CNSLBP (>3 months), have a lower level of education, and perceive themselves as having a high risk of persistent pain.
Our systematic review (6) on prognostic factors of CNSLBP at 12-month follow-up showed no association with the factor back muscle strength, and conflicting evidence for the association between return to work and age, sex, mobility and activities of daily living. At baseline, there was limited evidence for a positive influence of lower pain intensity and lower physical work demands on the outcome return-to-work.
More extensive information on the course and modifiable prognostic factors for improvement in work-participation could be helpful for professionals to better inform their patients and to influence their return to work. Thus, the aim of our prospective cohort study was: (i) to determine the course of work-participation of patients with CNSLBP in a multidisciplinary rehabilitation centre after 5 and 12 months, and (ii) to develop potential prognostic factors, which are associated with work-participation in patients with CNSLBP at 5 and 12 months following a multidisciplinary treatment.
METHODS
Study design and population
A prospective cohort study in patients with CNSLBP selected from a multidisciplinary outpatient rehabilitation clinic, the Spine & Joint Centre (SJC), Rotterdam, the Netherlands. All patients received several (postal) questionnaires and underwent a physical examination. Data were collected at baseline and at 2-, 5- and 12-month follow-ups. The study protocol was approved by the medical ethics committee of the SJC and all patients provided informed consent. Details of the study design are described elsewhere (7). All patients with CNSLBP were recruited between January 2003 and December 2008 at the SJC. Inclusion criteria were: complaints lasting ≥ 3 months, age ≥ 18 years, previous unsuccessful treatment (e.g. physiotherapy) in primary or secondary care, and having a work contract at baseline. Exclusion criteria were: insufficient knowledge of the Dutch language, signs indicating radiculopathy, asymmetrical Achilles tendon reflex and/or straight-leg raise test restricted by pain in the lower leg, positive magnetic resonance imaging (MRI) findings for disc herniation, neoplasm, recent (<6 months) fracture or surgery of the lumbar spine, the pelvic girdle, the hip joint, or the femur, systemic disease of the locomotor system, and being pregnant or ≤ 6 months post-partum at consultation.
Intervention
The multidisciplinary treatment at the SJC centre used a bio-psychosocial approach consisting of 16 sessions of 3 h each during a 2-month period (total of 48 h). Patients were coached by a multidisciplinary team (e.g. a physical therapist, physician, health scientist, psychologist) (7).
Prognostic factors and outcome
The selection of relevant prognostic factors was performed in 2 steps: (i) the literature on prognosis for CNSLBP and work-participation was reviewed; and (ii) a clinical group of experts on CNSLBP composed a list of 47 prognostic factors. Using the Policy Delphi method, this list was scored for importance (on a 4-point Likert scale ranging from 1 = very important to 4 = not important) by 8 experts working in different clinical settings (8, 9). A total of 23 prognostic factors was finally included, complying with the rule of at least 10 events per variable in the analysis (10) (see Box 1).
|
Box 1. The 23 potential prognostic factors |
|
|
Continuous variables |
|
|
1 |
Age |
|
2 |
Duration of back pain in years |
|
3 |
Present pain intensity (VAS: 0–100 mm) |
|
4 |
Degree of present fatigue (VAS: 0–100 mm) |
|
5 |
Quebec Back Pain Disability Scale (QBPDS: 0–100) |
|
6 |
Tampa scale for kinesiophobia (TSK, 17–68) |
|
7 |
Short-Form health survey 36 (SF-36); Physical Component Scale (PCS) (range 0 ’’low quality of life’’–100 points) |
|
8 |
Short-Form health survey 36 (SF-36; Mental Component Scale (MCS) (range 0 ’’low quality of life’’–100 points) |
|
9 |
Symptom Checklist 90 (SCL90; item 9; psychoneuroticism) |
|
10 |
Work-participation (0–100%) |
|
11 |
B200 Isostation (strength back extension in Newton) |
|
Categorical variables |
|
|
12 |
Body mass index (BMI ≤ 24.9/ 25–29.9/ ≥30 kg/m2) |
|
13 |
Cause of back pain (accident movement; after physical load; during pregnancy or after delivery; unknown; surgery pelvis/back or HNP) |
|
14 |
Course of pain in the previous 3 months (stable; increased; decreased) |
|
15 |
Duration of walking (0–15/16–30/31–60/>61 min) |
|
16 |
Duration of sitting (0–15/16–30/31–60/>61 min) |
|
17 |
Duration of standing (0–15/16–30/31–60/>61 min) |
|
Dichotomized variables |
|
|
18 |
Sex |
|
19 |
Co-morbidity (no vs having 1 or more co-morbidities) |
|
20 |
Marital status (being alone vs being married/living with 1 adult) |
|
21 |
Level of education (< high school vs => high school/university) |
|
22 |
Previous rehabilitation treatment (no vs 1 or more previous rehabilitation treatments) |
|
23 |
Sickness benefit (no vs all kinds of benefits from the government or employer) |
|
VAS: visual analogue scale; HNP: hernia nuclei pulposi. |
|
The outcome was work-participation, which was defined by dividing “current work hours” by “former work employment hours” prior to CNSLBP (7). Recovery of work-participation was operationalized according to the following definition: absolute work-participation, defined as ≥ 90% work-participation at follow-up (11–13).
Data analysis
Descriptive analysis was performed to describe the course of work-participation and patient characteristics.
First, eligible prognostic factors that were highly correlated (r > 0.8) were identified. This was the case for the B200 Isostation (strength in flexion, extension, lateroflexion, rotation) and the Symptom Checklist 90 (SCL90, items 1–8). Only the B200 extension and the total score (i.e. item 9) of the SCL90 were included in the analysis (14). The continuous factors were checked for linearity using spline regression curves, which revealed a non-linear relationship between body mass index (BMI) and work-participation.
The outcome work-participation is 1 of the 5 outcomes (back pain intensity, disability due to back pain, work-participation, quality of life and patients’ perceived recovery) measured in this prospective cohort. For all the outcomes the same 23 prognostic factors were included (7). BMI was changed into a categorical variable.
With regard to missing values, we applied multiple imputation of 5 data-sets. Because in some patients 28–45% of data were missing, the results were compared with 40 data-sets and complete case analyses (CCA) (14, 15). The Multivariate Imputation by Chained Equations approach was used as a multiple imputation method, which is implemented in SPSS 18. This method uses regression equations to estimate the missing values. As sensitivity analysis the results of 5 imputed data-sets were compared when 40 imputed data-sets were generated to see if the results would change. The number 40 was used because, in the initial model selection, 45% of the patients at 12 months were missing (loss-to-follow up). Because the results were similar, 5 imputed data-sets were used as the primary analysis method.
To develop our prognostic model, multivariable backward logistic regression analysis was performed and initially included 23 potential factors. In prediction research it is common to use a p-value of 15.7%, which is called Akaike information criterion (16). The variables with the highest p-value were removed 1 by 1, until all remaining variables had a p-value of < 0.157 (17–20).
The selection of variables was performed over all imputed data-sets using Rubin’s rules (21). To assess whether the level of significance influenced the final prognostic model, the selection of variables was repeated with a p-value of 0.05. A sensitivity analysis was performed with different work-participation cut-off values of 80% working and 100% working, and p-values of 0.05 and 0.157 (13).
The performance of the model was checked with regard to the goodness of fit (Hosmer-Lemeshow test), the explained variation, and the discriminative ability of the model. The explained variation of the model was estimated by Nagelkerke’s R-squared. Explained variation is the extent to which the outcome can be predicted by (the predictors in) the model in current data-set(s). The discriminative ability is reflected by the area under the receiver operating characteristic curve (AUC) (range 0.5 (chance) to 1.0 (perfect discrimination)) (22).
Bootstrapping techniques were used to internally validate the models, i.e. to simulate the performance with respect to the explained variance and the AUC in comparable patient data-sets (18, 19, 23, 24).
RESULTS
Study population
The original cohort consisted of 1,760 patients, of whom 1,608 had a work contract at baseline and were included (Fig. 1). Table I presents the baseline characteristics. The mean age of the patients was 39.5 (SD 9.8) years and 73.1% of the patients were female. Of all patients, 1,059 patients worked 0–99% of their “former work employment hours”, implying that they either had productivity loss, or partial or complete sick leave. At baseline, the mean duration of back pain complaints was 7.3 (SD 8.2) years.
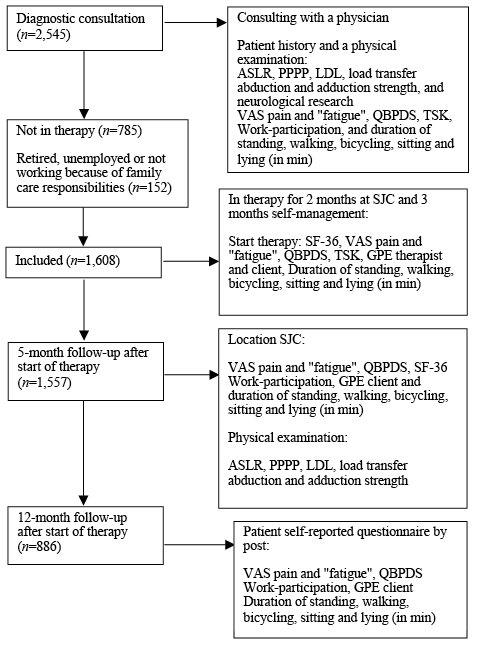
Fig. 1. Study design. SJC: Spine & Joint Centre; ASLR: Active Straight Leg Raise test; PPPP: Posterior Pelvic Pain Provocation test; LD: longum dorsal sacroiliac ligament; VAS: visual analogue scale; QBPDS: Quebec Back Pain Disability Scale; SF-36: Short-Form 36; TSK: Tampa Scale Kinesiophobia; GPE: Global Perceived Effect.
|
Table I. Baseline characteristics of 1,608 patients with chronic non-specific low back pain (CNLBP) |
||||
|
Characteristic |
n (%) |
Mean (SD) |
% missing |
|
|
Number of female patients |
1,176 (73.1) |
|
0 |
|
|
Age in years, mean (SD) |
39.5 (9.8) |
0 |
||
|
Demographic factors |
||||
|
Low education level |
630 (39.2) |
|
3.7 |
|
|
Marital status/living with 1 adult |
1,386 (88.2) |
2.7 |
||
|
Clinical status |
||||
|
Patients with BMI > 25 |
495 (30.8) |
|
4.7 |
|
|
Duration of complaints in years, mean (SD) |
7.3 (8.2) |
0 |
||
|
Cause reported by patient: |
||||
|
1 accident/wrong movement |
349 (21.7) |
0.81 |
||
|
2 after physical overload |
62 (3.9) |
|||
|
3 during pregnancy or after delivery |
552 (34.3) |
|||
|
4 unknown |
605 (37.6) |
|||
|
5 surgery pelvis/back or after HNP |
27 (1.7) |
|||
|
Previous revalidation programme |
||||
|
Co-morbidity |
234 (14.6) |
4.7 |
||
|
Pain intensity LBP (VAS in mm), mean (SD) |
||||
|
1 present pain intensity |
55.4 (22.9) |
0.12 |
||
|
Pain intensity due to CNLBP in the previous 3 months |
||||
|
1 stable pain intensity |
804 (51.3) |
2.5 |
||
|
2 increased pain intensity |
648 (41.4) |
|||
|
3 decreased pain intensity |
115 (7.3) |
|||
|
Degree of fatigue LBP (VAS in mm), mean (SD) |
||||
|
1 present fatigue |
56.67 (26.6) |
6.2 |
||
|
Disability (QBPDS), mean (SD) |
51.69 (15.4) |
0.19 |
||
|
Psychological factors |
||||
|
Fear avoidance (TSK), mean (SD) |
36.6 (7.3) |
2.6 |
||
|
SCL90 item 9, mean (SD) |
149.3 (40.0) |
12.4 |
||
|
SF-36 (health-related quality of life) |
||||
|
PCS |
31.8 (7.1) |
27.4 |
||
|
MCS |
46.5 (10.3) |
27.4 |
||
|
Work-related factors |
||||
|
Sickness benefit |
891 (67.1) |
17.4 |
||
|
Work-participation |
|
|||
|
1 100% working |
391 (24.3) |
9.8 |
||
|
2 0–99% working |
1,059 (65.9) |
|||
|
Physical examination |
||||
|
ADL function – duration >31 min without pain increase |
||||
|
1 walking |
367 (22.8) |
0.31 |
||
|
2 sitting |
395 (24.6) |
0.56 |
||
|
3 standing |
96 (6) |
0.37 |
||
|
B200 Isostation (strength) (Newton), mean (SD) |
||||
|
1 extension |
82.6 (46.3) |
5.8 |
||
|
SD: standard deviation; BMI: body mass index; CNLBP: chronic non-specific low back pain; VAS: visual analogue scale; QBPDS: Quebec Back Pain Disability Scale; TSK: Tampa Scale Kinesiophobia; SCL-90 (item 9): Symptom Checklist; SF-36: Short Form; PCS: Physical Component Summary; MCS: Mental Component Summary; ADL: activities of daily living. Missing values ranged from 0.12% (n = 2) to 27.4% (n = 441). For work-participation (n = 1,608 had a work contract) in 9.8% of cases there were missing values for “current work hours” at baseline, therefore work-participation could not be calculated. |
||||
Of all participants, 1,557 (97%) completed the 2-month multidisciplinary treatment, 1,433 (89%) returned the 5-month follow-up and 886 (55%) returned the 12-month follow-up questionnaire. The main reasons for missing variables were incomplete or not returned questionnaires.
Course
Table II presents the course of work-participation at baseline, and at 5- and 12-month follow-ups. At baseline, mean work-participation was 38.3% (SD 43.1); at 5-month follow-up this had increased to 73.4% (SD 44.9) and at 12-month follow-up to 81.8% (SD 52.9). Absolute work-participation (≥ 90%) was present in 25.4% at baseline, 43.2% at 5-month follow-up, and 52.0% at 12-month follow-up.
|
Table II. Course of work-participation in patients with chronic non-specific low back pain (CNSLBP) at 5- and 12-month follow-ups |
||||||||
|
Baseline (n = 1,608; 1,405) |
5 months (n = 820) |
12 months (n = 589) |
||||||
|
Mean (SD) |
% |
Mean (SD) |
% |
Mean (SD) |
% |
|||
|
Work-participation |
38.3 (43.1) |
73.4 (44.9) |
81.7 (52.9) |
|||||
|
Absolute work-participation (≥ 90%) |
25.4 |
43.2 |
52.0 |
|||||
|
CNSLBP: chronic non-specific low back pain; SD: standard deviation; n: number of patients. Missing values ranged from 12.6% to 36.2%. |
||||||||
Prognostic factors for absolute work-participation (≥ 90% at work)
Table III shows the results of the patients working ≥ 90% of their contract hours at 5- and 12-month follow-ups. At 5-month follow-up the factors remaining in the final model yield an explained variance of 30% with an AUC of 0.78. These factors were: being married or living with 1 adult, being male, high score on disability at baseline, previous rehabilitation, no sickness benefit, more work-participation at baseline, and a high Physical Component Scale (PCS) score on the SF-36 at baseline. At 12-month follow-up the explained variance was 17%, with an AUC of 0.70. More work-participation at baseline and being male were identified as prognostic factors.
At 5- and 12-month follow-ups, the bootstrapping analyses (internal validation of the model) revealed an explained variance of 30% and 17%, respectively, with an AUC of 0.78 and 0.70, respectively.
|
Table III. Multivariable models of prognostic factors for absolute recovery, work-participation (≥ 90%) at 5- and 12-month follow-ups |
|||||
|
Variable |
5-month follow-up |
12-month follow-up |
|||
|
OR (95% CI) |
p-value |
OR (95% CI) |
p-value |
||
|
Married/living with one adult (no/yes) |
1.72 (1.12–2.65) |
0.01 |
|||
|
Disability at baseline (QBPDS) |
1.00 (0.997–1.02) |
0.15 |
|||
|
Previous revalidation programme (no/yes) |
1.85 (1.14–2.98) |
0.01 |
|||
|
Sickness benefit (no/yes) |
0.52 (0.24–1.10) |
0.08 |
|||
|
Work-participation (0–100%) |
4.86 (2.35–10.04) |
< 0.001 |
5.22 (3.47–7.85) |
< 0.001 |
|
|
SF-36 PCS |
1.05 (1.02–1.07) |
< 0.001 |
|||
|
Sex (female/male) |
1.99 (1.24–3.20) |
0.09 |
1.79 (1.25–2.55) |
0.003 |
|
|
95% CI: 95% confidence interval; OR: odds ratio, an OR > 1 reflects a higher probability of 90% recovery for the outcome work-participation and an OR< 1 a lower probability of 90% work-participation compared with the reference category. OR estimated after multiple imputation (n = 5 data-sets) with p-value of 0.157. QBPDS: Quebec Back Pain Disability Scale; SF-36: Short Form 36 questionnaire; PCS: Physical Component Summary. |
|||||
At 5-month follow-up, sensitivity analyses demonstrated similarity in almost all of the prognostic factors between the different models. Only the CCA included some different factors. Work-participation and being male were reported most frequently. For the 12-month analysis, more work-participation at baseline was present in every model, as were several other factors similar to the presented final models. At 5-month follow-up the explained variance was 28–30%, with AUCs of 077–0.78, compared with 11–17% and AUCs of 0.66–0.70 at 12-month follow-up.
DISCUSSION
New and important findings of this current study are that the course of work-participation showed a clear increase during the 12-month follow-up, and various prognostic factors were identified, of which some can be influenced by a clinician.
To our knowledge, only long-term follow-up (≥ 6 months) of prognostic factors have been reported previously (6). Short-term follow-up (≤ 6 months) of work recovery is presented for the first time for this population with CNSLBP.
An important finding of this prospective cohort study is that different prognostic factors were identified from those reported in other studies (5, 6). Being male and more work-participation at baseline mostly appear in the multivariable models. Although there is no explanation for this in the literature, the answer might depend on the definition of work-participation used. We did not measure other work-related qualitative values, such as willingness to work, enjoyment in one’s work, or the desire to return to work, which could influence work-participation. Our findings on the clinical course and prognostic models show that more work-participation at baseline was included in all multivariable models; this might be because people working are generally healthier, experience social support and are more physically active, all of which may be related to greater physical well-being and an increased chance to recover (6). The baseline scores for back pain and disability are often related to returning to work (6, 25), but in our findings this was inconclusive. Being male was associated with work-participation; this might be because, in Dutch society, men traditionally earn the most wages for the family and it is less acceptable to work fewer hours.
Being married or living with another adult can provide social support for patients during their rehabilitation process, especially when they are involved in a multidisciplinary therapy, as was the case with our cohort study. There is some evidence for detrimental consequences of low back pain on marital satisfaction, partner emotions and relationship quality (26); on the other hand, beneficial effects are reported of spousal support and social interaction with other patients on low back pain coping and function for the outcome back pain and disability (27, 28).
A systematic review published in 2002 by Guzman et al. (29) provides evidence that intensive multidisciplinary bio-psycho-social rehabilitation with a functional restoration approach improves pain and function in patients with CNSLBP. Some trials reported improvements in work readiness, whereas others showed no significant reduction in sickness leave (29). Our study population received a therapy aimed at physical/functional recovery, which may partly explain the positive course of work-participation.
Strength and limitations
This study has some limitations. First, it is unknown whether the patients had the same contract work hours at baseline and one year later. Also, it is unknown if patients returned to work to their former job, or to a job with adjustments, or to another job; details on contractual working hours were surveyed only at follow-up. A second limitation is that we were unable to limit missing data (0–27.4%) at baseline and during the following year (45% loss of patients at 12 months), because data were collected during the daily process in rehabilitation care. At the 12-month follow-up, the postal questionnaires were mostly subject to loss of data. Possible reasons are postal collection of the data without a reminder about the SJC (policy), the patient was on vacation, the envelope was not stamped, the patient had completely recovered from CNSLBP or had started another intervention and there was no electronic collection of the data. Each time that data were collected, this involved collection of information on more than 100 variables; this can lead to overload for the patient and may result in lack of participation and/or incomplete questionnaires. Missing data and the impact of non-response at baseline and follow-up were analysed by comparing patients’ baseline response on individual prognostic factors with those at 5- and 12-month follow-ups. There were no reported differences between responders and non-responders on the main outcomes (data obtained by first author). However, some non-responders may have difficulty in implementing new behaviour and changed cognitions from one setting to another, or in remaining compliant to the therapy. First, when dealing with missing data we decided to use the multiple imputation procedure, as this is assumed to be more valid than simply omitting these patients from the analysis (23). Another consequence is that it reduces the sample size/power and thus the model’s validity (15). By performing sensitivity analyses and completed cases analyses (CCA), we validated our models in the population (15). In our study this revealed little or no difference in the identified prognostic factors, indicating that these models were relatively stable. Furthermore, in all analyses, the CCA showed slightly higher standard errors (SEs) and coefficients compared with the imputed data-sets. This indicates that, as expected, both the power and the precision were increased by use of imputation (30).
The MMICS statement recommends “days of work” to define an outcome work-participation (31). However, we were unable to retrieve this information from our data and therefore used work- participation, defined as dividing “current work hours” by “former work employment hours” prior to the CNSLBP. This definition has not been used before, because the clinometric values are unknown, thereby making comparison of the results difficult. Visual analogue scale (VAS) pain intensity, Quebec Back Pain Disability Scale (QBPDS), and Global Perceived Effect (GPE) are frequently used outcome measures (32–34, 13). Dichotomizing continuous variables, such as work-participation, has some implications on results: (i) information loss on patients outcome, (ii) patients close to but on opposite sides of the cut-off point ‘’≥ 90%’’ are characterized as being very different rather than very similar, and (iii) using 2 groups (e.g. improved vs. not improved) conceals any non-linearity in the relationship between the variable and the outcome (35).
Ostelo et al. reported that the change from baseline to follow-up can be defined as “clinically important” (e.g. a 30% improvement) because individual patients determine their own health status (35).
The present study is part of a larger investigation of a number of outcome measures, besides that of work-participation (7). For all outcomes, the same 23 prognostic factors were used in the multivariate regression models. Therefore, certain other variables, such as socio-economic variables (e.g. bread-winner), occupational variables (e.g. social security agency), job characteristics (e.g. job satisfaction), and other factors, such as work attitude and help with personal problems, were not selected in this study (36). It is also possible that other potential factors have not been addressed in the present study.
We used contemporary statistical methods to internally validate the prognostic models. These methods reduce the tendency for variable selection procedures to produce overly optimistic estimates of model performance (18). Further research is recommended in other settings to enable clinicians to eventually apply these models (17).
In conclusion, the results of this study show that clinical, work and psychosocial-related variables contribute to the development of improvement in CNSLBP. The most promising variable over the 12 months appears to be staying at work at baseline. This variable may be relevant for clinicians and occupational health physicians in advising their patients with respect to treatment strategy and optimal chance to improve over time.
REFERENCES

